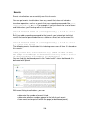
1
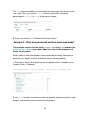
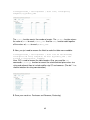
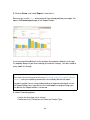
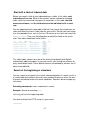
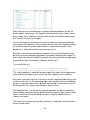
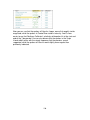
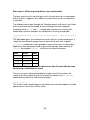
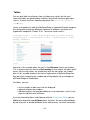
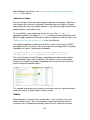
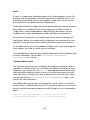
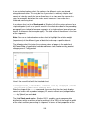
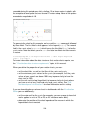
How do you get a report that displays the top msg and the values of mc_host that
sent them, so you get a table like this:
Messages by mc_host
CPU at 100%
log01
log02
log03
Log File Alert
host02
host56
host11
To do this, set up a search that finds the top message per mc_host (using limit=1
to only return one) and then sort by the message count in descending order:
source="mcevent.csv" | top limit=1 msg by mc_host | sort -count
Create reports that display summary statistics
Use the stats and eventstats reporting commands to generate reports that
display summary statistics related to a field.
To fully utilize the stats command, you need to include a "split by" clause. For
example, the following report won't provide much information:
sourcetype=access_combined | stats avg(kbps)
It gives you the average of kbps for all events with a sourcetype of
access_combined--a single value. The resulting column chart contains
only one
column.
But if you break out the report with a split by field, Splunk generates a report that
breaks down the statistics by that field. The following report generates a column
chart that sorts through the access_combined logs to get the average thruput
(kbps), broken out by host:
sourcetype=access_combined | stats avg(kbps) by host
Here's a slightly more sophisticated example of the stats command,
in a report
that shows you the CPU utilization of Splunk processes sorted in descending
order:
index=_internal "group=pipeline" | stats sum(cpu_seconds) by processor
| sort sum(cpu_seconds) desc
215