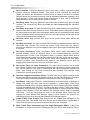
1
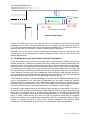
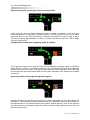
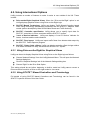
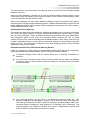
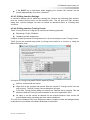
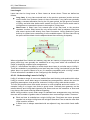
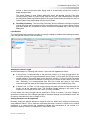
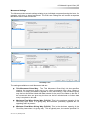
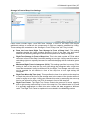
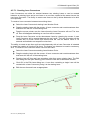
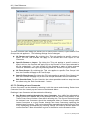
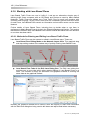
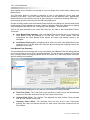
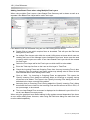
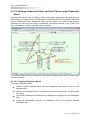
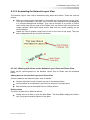
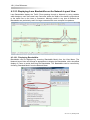
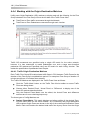
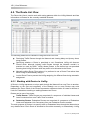
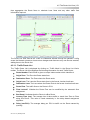
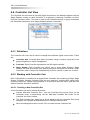
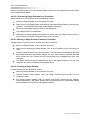
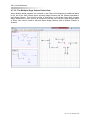
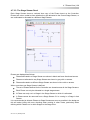
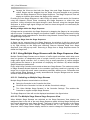
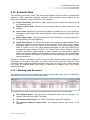
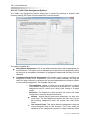
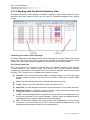
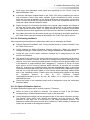
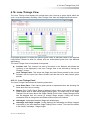
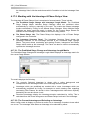
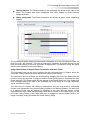
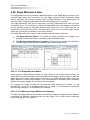
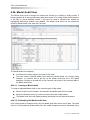
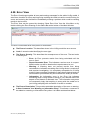
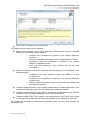
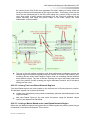
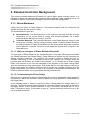
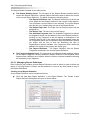
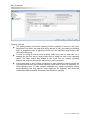
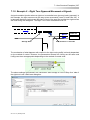
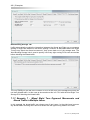
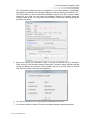
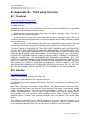
4.22 Network Results View | 237
4.22. Network Results View
The Network Results View displays a range of detailed performance statistics and data for
the Network and Network items such as Junctions, Lanes, and Pedestrian Links. The View
can be opened by choosing ‘Network Results View’ from the Modelling menu.
The figure below shows an example of the Network Results View showing a selection of
data items. Results are always shown for the currently selected Scenario as shown in the
Scenario View or main toolbar.
The Network Results View is divided into three main areas. These are:
Display Settings. This allows settings to be made governing the way the Network
Results View displays the results.
The Results List. This lists each Item for which data can be displayed showing a
range of relevant data columns for each Item. The list is a hierarchal list allowing
which Items are to be displayed and the level of detail to show to be easily controlled.
The following Items can be shown in the list:
o
o
o
o
Network. Aggregate performance statistics for the entire Network.
Junctions. Aggregate Performance statistics for each Junction.
Lanes. Performance statistics for individual signal or give-way
controlled traffic Lanes. Short Lanes are shown grouped with their
associated Long Lane. Lanes can be further broken down to show
Route Layers.
Pedestrian Links. Performance statistics for individual Pedestrian
Links. Pedestrian Links can be further broken down by direction of
movement.
Each item can be expanded and collapsed as appropriate to manage the amount of
information shown. How many and which data columns are displayed are also fully
customisable.
The Network Summary. This includes a summary of the performance of each Stage
Stream and of the Network as a whole.
Ver. 3.2.10 | January 2013