1
75
SET-SHOW
gnuplot 4.4
113
on the usual diagonal, both triangles will be excluded. However if the default setting of altdiagonal
is active, the other diagonal will be chosen for this cell instead, minimizing the size of the hole in the
surface.
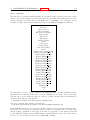
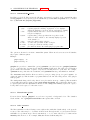
The bentover option controls what happens to another special case, this time in conjunction with the
trianglepattern. For rather crumply surfaces, it can happen that the two triangles a surface cell is
divided into are seen from opposite sides (i.e. the original quadrangle is ’bent over’), as illustrated in
the following ASCII art:
C----B
original quadrangle: A--B
displayed quadrangle:
|\
|
("set view 0,0")
| /|
("set view 75,75" perhaps) | \ |
|/ |
| \ |
C--D
|
\|
A
D
If the diagonal edges of the surface cells aren’t generally made visible by bit 2 of the <bitpattern> there,
the edge CB above wouldn’t be drawn at all, normally, making the resulting display hard to understand.
Therefore, the default option of bentover will turn it visible in this case. If you don’t want that, you
may choose nobentover instead. See also
hidden line removal demo (hidden.dem)
and
complex hidden line demo (singulr.dem).
75.28
Historysize
Note: the command set historysize is only available when gnuplot has been configured with the GNU
readline.
Syntax:
set historysize <int>
unset historysize
When leaving gnuplot, the value of historysize is used for truncating the history to at most that much
lines. The default is 500. unset historysize will disable history truncation and thus allow an infinite
number of lines to be written to the history file.
75.29
Isosamples
The isoline density (grid) for plotting functions as surfaces may be changed by the set isosamples
command.
Syntax:
set isosamples <iso_1> {,<iso_2>}
show isosamples
Each function surface plot will have <iso 1> iso-u lines and <iso 2> iso-v lines. If you only specify
<iso 1>, <iso 2> will be set to the same value as <iso 1>. By default, sampling is set to 10 isolines
per u or v axis. A higher sampling rate will produce more accurate plots, but will take longer. These
parameters have no effect on data file plotting.
An isoline is a curve parameterized by one of the surface parameters while the other surface parameter is
fixed. Isolines provide a simple means to display a surface. By fixing the u parameter of surface s(u,v),
the iso-u lines of the form c(v) = s(u0,v) are produced, and by fixing the v parameter, the iso-v lines of
the form c(u) = s(u,v0) are produced.
When a function surface plot is being done without the removal of hidden lines, set samples controls the number of points sampled along each isoline; see set samples (p. 138) and set hidden3d
(p. 111). The contour algorithm assumes that a function sample occurs at each isoline intersection, so
change in samples as well as isosamples may be desired when changing the resolution of a function
surface/contour.