1
120
gnuplot 4.4
75.36
75
SET-SHOW
Macros
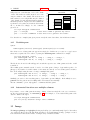
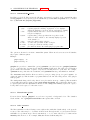
If command line macro substitution is enabled, then tokens in the command line of the form
@<stringvariablename> will be replaced by the text string contained in <stringvariablename>. See
substitution (p. 37).
Syntax:
set macros
75.37
Mapping
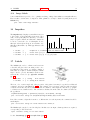
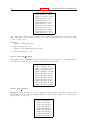
If data are provided to splot in spherical or cylindrical coordinates, the set mapping command should
be used to instruct gnuplot how to interpret them.
Syntax:
set mapping {cartesian | spherical | cylindrical}
A cartesian coordinate system is used by default.
For a spherical coordinate system, the data occupy two or three columns (or using entries). The first
two are interpreted as the azimuthal and polar angles theta and phi (or "longitude" and "latitude"), in
the units specified by set angles. The radius r is taken from the third column if there is one, or is set
to unity if there is no third column. The mapping is:
x = r * cos(theta) * cos(phi)
y = r * sin(theta) * cos(phi)
z = r * sin(phi)
Note that this is a "geographic" spherical system, rather than a "polar" one (that is, phi is measured
from the equator, rather than the pole).
For a cylindrical coordinate system, the data again occupy two or three columns. The first two are
interpreted as theta (in the units specified by set angles) and z. The radius is either taken from the
third column or set to unity, as in the spherical case. The mapping is:
x = r * cos(theta)
y = r * sin(theta)
z = z
The effects of mapping can be duplicated with the using filter on the splot command, but mapping
may be more convenient if many data files are to be processed. However even if mapping is used, using
may still be necessary if the data in the file are not in the required order.
mapping has no effect on plot.
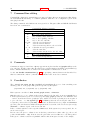
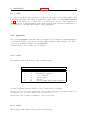
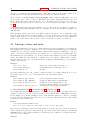
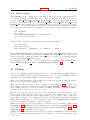
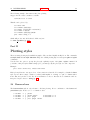
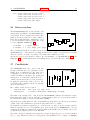
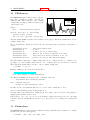
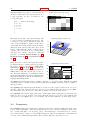
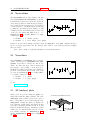
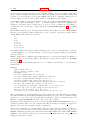
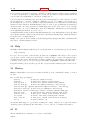
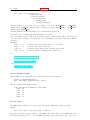
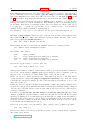
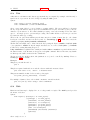
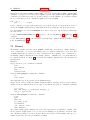
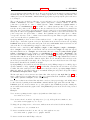
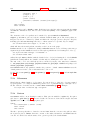
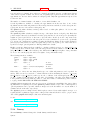
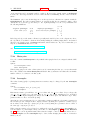
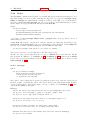
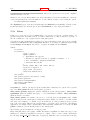
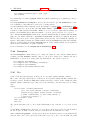
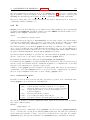
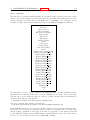
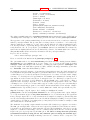
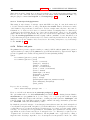
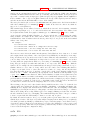
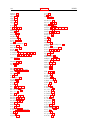
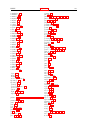
world.dem:
75.38
mapping demos.
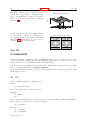
Margin
The computed margins can be overridden by the set margin commands. show margin shows the
current settings.
Syntax:
set bmargin
set lmargin
set rmargin
set tmargin
show margin
{{at
{{at
{{at
{{at
screen}
screen}
screen}
screen}
<margin>}
<margin>}
<margin>}
<margin>}
The default units of <margin> are character heights or widths, as appropriate. A positive value defines
the absolute size of the margin. A negative value (or none) causes gnuplot to revert to the computed
value. For 3D plots, only the left margin can be set using character units.