1
75
SET-SHOW
75.31
gnuplot 4.4
117
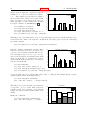
Label
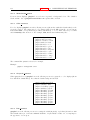
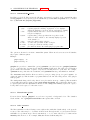
Arbitrary labels can be placed on the plot using the set label command.
Syntax:
set label {<tag>} {"<label text>"} {at <position>}
{left | center | right}
{norotate | rotate {by <degrees>}}
{font "<name>{,<size>}"}
{noenhanced}
{front | back}
{textcolor <colorspec>}
{point <pointstyle> | nopoint}
{offset <offset>}
unset label {<tag>}
show label
The <position> is specified by either x,y or x,y,z, and may be preceded by first, second, graph,
screen, or character to select the coordinate system. See coordinates (p. 20) for details.
The tag is an integer that is used to identify the label. If no <tag> is given, the lowest unused tag
value is assigned automatically. The tag can be used to delete or modify a specific label. To change
any attribute of an existing label, use the set label command with the appropriate tag, and specify the
parts of the label to be changed.
The <label text> can be a string constant, a string variable, or a string- valued expression. See strings
(p. 37), sprintf (p. 26), and gprintf (p. 108).
By default, the text is placed flush left against the point x,y,z. To adjust the way the label is positioned
with respect to the point x,y,z, add the justification parameter, which may be left, right or center,
indicating that the point is to be at the left, right or center of the text. Labels outside the plotted
boundaries are permitted but may interfere with axis labels or other text.
If rotate is given, the label is written vertically (if the terminal can do so, of course). If rotate
by <degrees> is given, conforming terminals will try to write the text at the specified angle; nonconforming terminals will treat this as vertical text.
Font and its size can be chosen explicitly by font "<name>{,<size>}" if the terminal supports font
settings. Otherwise the default font of the terminal will be used.
Normally the enhanced text mode string interpretation, if enabled for the current terminal, is applied
to all text strings including label text. The noenhanced property can be used to exempt a specific
label from the enhanced text mode processing. The can be useful if the label contains underscores, for
example. See enhanced text (p. 21).
If front is given, the label is written on top of the graphed data. If back is given (the default), the label
is written underneath the graphed data. Using front will prevent a label from being obscured by dense
data.
textcolor <colorspec> changes the color of the label text. <colorspec> can be a linetype, an rgb
color, or a palette mapping. See help for colorspec (p. 33) and palette (p. 132). textcolor may be
abbreviated tc.
‘tc
‘tc
‘tc
‘tc
‘tc
‘tc
default‘ resets the text color to its default state.
lt <n>‘ sets the text color to that of line type <n>.
ls <n>‘ sets the text color to that of line style <n>.
palette z‘ selects a palette color corresponding to the label z position.
palette cb <val>‘ selects a color corresponding to <val> on the colorbar.
palette fraction <val>‘, with 0<=val<=1, selects a color corresponding to
the mapping [0:1] to grays/colors of the ‘palette‘.
‘tc rgb "#RRGGBB"‘ selects an arbitrary 24-bit RGB color.
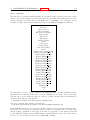
If a <pointstyle> is given, using keywords lt, pt and ps, see style (p. 85), a point with the given style
and color of the given line type is plotted at the label position and the text of the label is displaced