1
130
gnuplot 4.4
75
SET-SHOW
{ implicit | explicit }
{ map }
}
show pm3d
unset pm3d
Color surface is drawn if data or function style is set to pm3d globally or via ’with’ option, or if the
option implicit is on — then the pm3d surface is combined with the line surface mesh. See bottom of
this section for mode details.
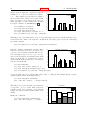
Color surface can be drawn at the base or top (then it is a gray/color planar map) or at z-coordinates of
surface points (gray/color surface). This is defined by the at option with a string of up to 6 combinations
of b, t and s. For instance, at b plots at bottom only, at st plots firstly surface and then top map,
while at bstbst will never by seriously used.
Colored quadrangles are plotted one after another. When plotting surfaces (at s), the later quadrangles
overlap (overdraw) the previous ones. (Gnuplot is not virtual reality tool to calculate intersections of
filled polygon meshes.) You may try to switch between scansforward and scansbackward to force
the first scan of the data to be plotted first or last. The default is scansautomatic where gnuplot
makes a guess about scans order. On the other hand, the depthorder option completely reorders the
quadrangles. The rendering is performed after a depth sorting, which allows to visualize even complicated
surfaces; see pm3d depthorder (p. 131) for more details.
If two subsequent scans do not have same number of points, then it has to be decided whether to
start taking points for quadrangles from the beginning of both scans (flush begin), from their ends
(flush end) or to center them (flush center). Note, that flush (center|end) are incompatible with
scansautomatic: if you specify flush center or flush end and scansautomatic is set, it is silently
switched to scansforward.
If two subsequent scans do not have the same number of points, the option ftriangles specifies whether
color triangles are drawn at the scan tail(s) where there are not enough points in either of the scan. This
can be used to draw a smooth map boundary.
Clipping with respect to x, y coordinates of quadrangles can be done in two ways. clip1in: all 4 points
of each quadrangle must be defined and at least 1 point of the quadrangle must lie in the x and y ranges.
clip4in: all 4 points of each quadrangle must lie in the x and y ranges.
There is a single gray/color value associated to each drawn pm3d quadrangle (no smooth color change
among vertices). The value is calculated from z-coordinates from the surrounding corners according to
corners2color <option>. The options ’mean’ (default), ’geomean’ and ’median’ produce various kinds
of surface color smoothing, while options ’min’ and ’max’ choose minimal or maximal value, respectively.
This may not be desired for pixel images or for maps with sharp and intense peaks, in which case the
options ’c1’, ’c2’, ’c3’ or ’c4’ can be used instead to assign the quadrangle color based on the z-coordinate
of only one corner. Some experimentation may be needed to determine which corner corresponds to ’c1’,
as the orientation depends on the drawing direction. Because the pm3d algorithm does not extend the
colored surface outside the range of the input data points, the ’c<j>’ coloring options will result in pixels
along two edges of the grid not contributing to the color of any quadrangle. For example, applying the
pm3d algorithm to the 4x4 grid of data points in script demo/pm3d.dem (please have a look) produces
only (4-1)x(4-1)=9 colored rectangles.
Another drawing algorithm, which would draw quadrangles around a given node by taking corners from
averaged (x,y)-coordinates of its surrounding 4 nodes while using node’s color, could be implemented in
the future. This is already done for drawing images (2D grids) via image and rgbimage styles.
Notice that ranges of z-values and color-values for surfaces are adjustable independently by set zrange,
set cbrange, as well as set log for z or cb. Maps can be adjusted by the cb-axis only; see also set
view map (p. 149) and set colorbox (p. 99).
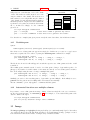
The option hidden3d takes as the argument a linestyle which must be created by set style line ....
(The style need not to be present when setting pm3d, but it must be present when plotting). If set, lines
are drawn using the specified line style, taking into account hidden line removal. This is by far more
efficient than using the command set hidden3d as it doesn’t really calculate hidden line removal, but
just draws the filled polygons in the correct order. So the recommended choice when using pm3d is