1
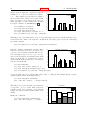
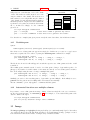
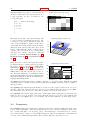
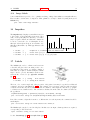
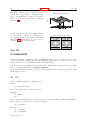
65
PLOT
gnuplot 4.4
81
65.2.16.2 Pseudocolumns Expressions in the using clause of a plot statement can refer to additional bookkeeping values in addition to the actual data values contained in the input file. These are
contained in "pseudocolumns".
column(0)
The sequential order of each point within a data set.
The counter starts at 0 and is reset by two sequential blank
records. The shorthand form $0 is available.
column(-1) This counter starts at 0 and is reset by a single blank line.
This corresponds to the data line in array or grid data.
column(-2) The index number of the current data set within a file that
contains multiple data sets. See ‘index‘.
65.2.16.3 Xticlabels Axis tick labels can be generated via a string function, usually taking a data
column as an argument. The simplest form uses the data column itself as a string. That is, xticlabels(N)
is shorthand for xticlabels(stringcolumn(N)). This example uses the contents of column 3 as x-axis tick
labels.
plot ’datafile’ using <xcol>:<ycol>:xticlabels(3) with <plotstyle>
Axis tick labels may be generated for any of the plot axes: x x2 y y2 z. The ticlabels(<labelcol>)
specifiers must come after all of the data coordinate specifiers in the using portion of the command.
For each data point which has a valid set of X,Y[,Z] coordinates, the string value given to xticlabels()
is added to the list of xtic labels at the same X coordinate as the point it belongs to. xticlabels() may
be shortened to xtic() and so on.
Example:
splot "data" using 2:4:6:xtic(1):ytic(3):ztic(6)
In this example the x and y axis tic labels are taken from different columns than the x and y coordinate
values. The z axis tics, however, are generated from the z coordinate of the corresponding point.
Example:
plot "data" using 1:2:xtic( $3 > 10. ? "A" : "B" )
This example shows the use of a string-valued function to generate x-axis tick labels. Each point in the
data file generates a tick mark on x labeled either "A" or "B" depending on the value in column 3.
65.2.16.4
X2ticlabels
65.2.16.5
Yticlabels
65.2.16.6
Y2ticlabels
65.2.16.7
Zticlabels
65.3
See plot using xticlabels (p. 81).
See plot using xticlabels (p. 81).
See plot using xticlabels (p. 81).
See plot using xticlabels (p. 81).
Errorbars
Error bars are supported for 2D data file plots by reading one to four additional columns (or using
entries); these additional values are used in different ways by the various errorbar styles.
In the default
— either
(x, y,
(x, y,
(x, y,
(x, y,
(x, y,
(x, y,
situation, gnuplot expects to see three, four, or six numbers on each line of the data file
ydelta),
ylow, yhigh),
xdelta),
xlow, xhigh),
xdelta, ydelta), or
xlow, xhigh, ylow, yhigh).