1
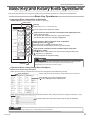
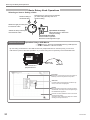
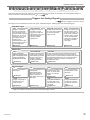
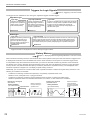
DL9500/DL9700 Series
Digital Oscilloscope
IM 701331-02E
3rd Edition
Thank you for purchasing the DL9500/DL9700 Series Digital Oscilloscope (DL9505L/DL9510L/DL9705L/DL9710L,
hereafter referred to as the DL9500/DL9700).
The purpose of this operation guide is to familiarize the first-time user with the basic operations of the DL9500/
DL9700.
There are two additional user’s manuals for the DL9500/DL9700. One is the DL9500/DL9700 User’s Manual
(IM701331-01E) which explains all the functions of the DL9500/DL9700. The other is the DL9500/DL9700
Communication Interface User’s Manual (IM701331-17E, CD-ROM) which details only the communication
functions. Read these manuals along with this operation guide.
Notes
• The contents of this manual are subject to change without prior notice as a result of continuing improvements
to the instrument’s performance and functions. The figures given in this manual may differ from those that
actually appear on your screen.
• Every effort has been made in the preparation of this manual to ensure the accuracy of its contents. However,
should you have any questions or find any errors, please contact your nearest YOKOGAWA dealer.
• Copying or reproducing all or any part of the contents of this manual without YOKOGAWA’s permission is
strictly prohibited.
Trademarks
• Adobe, Acrobat, and PostScript are trademarks of Adobe Systems Incorporated.
• For purposes of this manual, the TM and ® symbols do not accompany their respective trademark names or
registered trademark names.
• Other company and product names are trademarks or registered trademarks of their respective holders.
Revisions
1st Edition:
2nd Edition:
3rd Edition:
July 2007
June 2008
April 2009
3rd Edition : April 2009 (YK)
All Rights Reserved, Copyright © 2007 Yokogawa Electric Corporation
IM 701331-02E
Contents
Front Panel Parts and Functions...........................................................................3
Parts of the Screen.........................................................................................................6
Basic Key and Rotary Knob Operations...........................................................9
Introduction of the Main Functions....................................................................11
Preparation........................................................................................................................16
Connecting the Power Supply.........................................................................................16
Turning ON/OFF the Power Switch...............................................................................16
Connecting the Probes......................................................................................................17
Connecting the Logic Probes. .........................................................................................18
Observing the Analog Signal Waveforms. .....................................................19
Displaying Waveforms on the Screen...........................................................................19
Changing the Waveform Display Conditions..............................................................21
Changing the Trigger Settings.........................................................................................23
Measuring Waveforms.......................................................................................................25
Zooming in on Waveforms................................................................................................26
Observing Logic Signals...........................................................................................27
Displaying Logic Waveforms on the Screen...............................................................27
Changing the Display Conditions for Logic Signals. ................................................29
Changing the Trigger Settings.........................................................................................32
Measuring Logic Signals...................................................................................................33
Printing and Saving Waveforms...........................................................................34
IM 701331-02E
Front Panel Parts and Functions
Front Panel Parts and Functions
This section describes the names and functions of the keys and knobs on the DL9500/DL9700 front panel. For details on
each item, see the respective chapter or section in the user’s manual indicated by the mark.
Vertical Axis
CH1 to CH4 keys Sections 5.1 to 5.14
Displays a menu used to turn ON/OFF the
display of analog signal input channels and set
the vertical position, coupling, probe type, offset
voltage, bandwidth limit, expansion or reduction
of the vertical axis, linear scaling, and waveform
labels. Press any of these keys before operating
the SCALE knob to select the channel that is
controlled using the SCALE knob. Each CH key
illuminates when the corresponding channel
display is ON.
POSITION Knob Section 5.3
Changes the center position when you change
the voltage range. This knob has a push switch
feature. You can press the knob to switch the
setting resolution. If you press the knob and Fine
illuminates, the setting resolution is set to fine.
M1 to M4 Keys Chapter 9 and 14
Sets waveform computation or sets items
related to the reference waveform. Each M key
illuminates when the corresponding channel
display is ON.
LOGIC Key Sections 5.15 to 5.19
Displays a menu used to set the logic signal display (grouping, displayed order, bus
display, and state display), skew adjustment, threshold level, label, etc. Pressing
this key and then operating the POSITION knob sets the vertical display position of
the logic signal. Pressing this key and then operating the SCALE knob sets the
vertical display size of the logic signal.
SCALE Knob Section 5.7
Sets the vertical scale. Press any of the CH1 to
CH4 and M1 to M4 keys before turning this knob
to select the source waveform. If you change the
setting when waveform acquisition is stopped,
the new setting takes effect when you restart
waveform acquisition.
This knob has a push switch feature. You can
press the knob to switch the setting resolution. If
you press the knob and Fine illuminates, the
setting resolution is set to fine.
Horizontal Axis (Time Axis)
T/DIV knob Section 5.8
Sets the time axis scale. If you change the
setting while waveform acquisition is stopped,
the setting takes effect when you restart
waveform acquisition.
Trigger
POSITION/DELAY Key
Sections 6.2 and 6.3
Displays a menu used to set the trigger delay and
trigger position.
EDGE/STATE Key
Sections 6.6 to 6.9
Displays a menu used to set the edge/state trigger.
Press any of the EDGE/STATE, ENHANCED,
WIDTH, and EVENT INTERVAL keys to select the
trigger type. The key that you press illuminates to
indicate that it is selected.
WIDTH Key
Sections 6.10 to 6.12
Displays a menu used to set the width trigger.
SOURCE Key Chapter 6
Displays a menu used to set the trigger source.
IM 701331-02E
TRIG MODE/HOLD OFF Key
Sections 6.1 and 6.4
Displays a menu used to set the trigger mode
and hold off time.
SHIFT+TRIG MODE/HOLD OFF Key (ACQ
COUNT/ACTION) Sections 7.8 to 7.16
Displays a menu related to the action-on-trigger
and GO/NO-GO functions.
ENHANCED Key Sections 6.13 to 6.19
Displays a menu used to set the TV trigger and
serial bus trigger.
EVENT INTERVAL Key
Sections 6.20
Displays a menu used to set the event trigger.
LEVEL/COUPLING Key Section 6.5
Displays a menu used to set the trigger coupling,
HF rejection, window comparator, etc.
Front Panel Parts and Functions
Waveform Acquisition
ACQ Key Sections 7.1 and 7.2
Displays a menu used to set the waveform
acquisition mode (acquisition mode and high
resolution mode).
START/STOP Key Section 4.7
Starts/Stops waveform acquisition according to
the trigger mode. The key illuminates while
waveform acquisition is in progress.
SAMPLING/LENGTH Key Sections 7.3 to
7.6
Displays a menu used to set the record length,
repetitive sampling, interleave, and interpolation.
Common Operations, Display, Computation, Analysis, and Search
Arrow Keys ( , , , and
Keys)
The left and right arrow keys are used to move numeric
entry digit (cursor). The up and down arrow keys are used
to enter a value.
SET Key
Applies the menu item that you
selected using the rotary shuttle.
RESET
Numeric Keys
Used to enter values, file
names, etc.
SET
M
7
RESET Key
Resets the numeric entry to the
default value.
Rotary Knob
Used to change the settings and
move the cursors.
CURSOR Key
Section 10.1
Displays a menu used to perform
cursor measurements.
u
CURSOR
TELECOM TEST
PARAM
INTENSITY
A
B
C
2
WINDOW 1
FORM
WINDOW 2
ACCUM CLEAR
ACCUM
DISP 2
ZOOM 2
WINDOW1 and WINDOW2 Keys
Sections 10.5 to 10.9
Displays a menu used to set the XY display; FFT
analysis; histogram, trend, and list of waveform
parameters; etc. The key illuminates when the display
is ON.
FORM Key Sections 8.2 to 8.5 and 8.8
Displays a menu related to the screen display.
6
F
DISP 1
ZOOM 1
PARAM Key Sections 10.2 and 10.3
Displays a menu used to perform automated
measurement of waveform parameters and
statistical processing.
SHIFT+PARAM Key (TELECOM TEST)
Section 10.4
Displays the telecom test menu.
BS
PRINT
CLEAR
FILE
p
5
ZOOM
DISPLAY
9
E
0
MENU
m
D
1
ANALYSIS
XY
8
n
4
MEASURE
k
SHIFT Key
Press the key once to illuminate the
key. The function marked in purple
characters above each key is
activated. Pressing the key again
clears the shifted condition.
X
EXP
3
+/MAG
SYSTEM
SHIFT
SETUP
HELP
HISTORY CLEAR
HISTORY
MAG Dial Section 8.1
Turn this dial during zoom
display to specify the
magnification of the target
vertical or horizontal axis.
SETUP Key Sections 4.4 and 4.5
Displays a menu used to initialize
the settings to factory defaults;
perform auto setup, which
automatically sets the
DL9500/DL9700 according to the
input signal; store or recall setting
parameters; and so on.
HELP Key
Turns ON/OFF the help window
that provides description about
the procedure.
HISTORY Key Chapter 11
Displays a menu used to display
and search waveforms using the
history memory function.
SHIFT+HISTORY Key (HISTORY
CLEAR) Section 11.1
Clears the displayed history
waveform.
ZOOM1/ZOOM2 Key
Sections 8.1 and 10.10 to 10.13
Displays a menu related to the waveform zoom display and data
search (search & zoom function).
SHIFT+ZOOM1/ZOOM2 Key (DISP1/DISP2) Section 8.1
Displays a menu related to the zoom waveform arrangement.
INTENSITY Key
Section 7.7
Changes the intensity of the accumulated waveforms.
ACCUM Key
Section 7.7
Displays a menu related to the accumulated waveform
display.
SHIFT+ACCUM Key (ACCUM CLEAR)
Section 7.7
Clears the accumulated waveforms.
IM 701331-02E
Front Panel Parts and Functions
Printing Screen Image and Saving/Loading Data
M
k
7
u
FILE key Sections 13.4 to 13.8 and 13.10 to
13.13
Displays a menu used to save or load various
data from an external storage media such as a
PC card or USB memory and operate files.
9
n
4
5
6
E
F
A
B
C
2
0
BS
PRINT
CLEAR
FILE
PRINT Key Sections 12.2 to 12.4 and 13.9
Prints screen images and saves screen image data.
SHIFT+PRINT Key (MENU) Sections 12.2 to
12.4 and 13.9
Displays a setup menu used to print screen images
to the built-in printer, USB printer, or network printer
as well as a setup menu used to save screen image
data to an external storage media such as a PC
card or USB memory.
p
D
1
MENU
m
8
X
EXP
3
SYSTEM
+/-
SHIFT
Calibration, Ethernet Communications, and Other Operations
SYSTEM Key Sections 3.7, 4.8, 13.14, chapters 15, 17, and 18
Displays a menu related to the date/time, calibration, PC connection method, network, message language, click sound,
self-test, formatting of the internal memory or internal hard disk, USB communication functions, and list display of settings.
Displays also the system information (available options and firmware version).
M
7
u
8
n
4
m
9
6
E
F
A
B
C
0
SNAP Key
Section 8.7
Takes a snapshot and retains the current waveform on
the screen in white.
SHIFT+SNAP Key (SNAP CLEAR) Section 8.7
Clears the snapshot waveforms.
MENU
BS
PRINT
CLEAR
FILE
p
5
D
1
IM 701331-02E
k
2
3
X
EXP
+/-
SYSTEM
SHIFT
CH 2
CH 3
SNAP CLEAR
CH 4
SNAP
Parts of the Screen
Parts of the Screen
This section describes the menus and symbols that appear on the DL9500/DL9700 screen. For details on each item, see the
respective chapter or section in the user’s manual indicated by the
or
mark.
Screen Showing the Waveforms of Normal Analog Signals
Horizontal axis scale (time axis T/div)
Section 5.8
Displayed when you change the
horizontal axis scale (T/div) while data
acquisition is stopped.
The setting is applied when data
acquisition is resumed.
Waveform acquisition status
Stopped
Running
Pre...:
Acquiring pre data
Post...:
Acquiring post data
Waiting for trigger
Acquisition mode
Number of waveform acquisitions
Date/time
Section 3.7
Trigger position mark
Section 6.2
Normal
Envelope
Display record Average
length
Appendix 1
Scale value
Section 5.12
Sample rate
Section 7.1
Appendix 1
Horizontal axis scale
(time axis T/div)
Section 5.8
Label of the
displayed waveform
Section 8.6
Vertical position mark
( ) Section 5.3
Ground level mark
( ) Section 2.3
Setup menu
Trigger level mark
Section 2.4
Time from the trigger
position to the left
and right ends of the
waveform area
Trigger type Sections
2.4, 6.2, 6.6 to 6.20,
Rectangular frame
Enclosed in a rectangular frame
when the vertical axis of the
corresponding channel is being
configured.
Vertical axis settings of
each channel
• Coupling Section 5.4
• Vertical axis scale
(voltage sensitivity V/div)
Section 5.7
• Probe attenuation
Section 5.6
Trigger source,
Trigger slope (polarity)
Section 2.4 and
chapter 6
Input channel
Computation/reference channel
Trigger level
Section 2.4 and
chapter 6
Trigger coupling,
HF rejection,
hysteresis Sections 2.4 and 6.5
IM 701331-02E
Parts of the Screen
Screen Showing the Zoom Waveforms
Section 8.1, “Zooming the Waveform” in the user’s manual
Zoom position of zoom
waveform Z2
Zoom position of zoom
waveform Z1
Display record
length of the
normal waveform
Display record
length of Z1
T/div of the normal waveform
Display record length
of Z2
Normal analog waveform area
T/div of Z2
Scale value of Z1
(top edge)
T/div of Z1
V/div of Z1
Not displayed if the
waveform is not
zoomed vertically.
Scale value of Z1
(bottom edge)
Z1 waveform area
Time between the
left and right
edges of Z1
Z2 waveform area
V/div of Z2
Not displayed if the
waveform is not
zoomed vertically.
Scale value of Z2
(top edge)
Scale value of Z2
(bottom edge)
Time between the
left and right
edges of Z2
Screen Showing the Analysis Results
Section 10.6, “Viewing the Phase Between Measured Waveform on the XY Display)” in the user’s manual
Section 10.7, “Performing FFT Analysis” in the user’s manual
Section 10.8, “Displaying a Histogram, Trend, or List of Automatic Measurement Waveform Parameters” in the user’s
manual
Section 10.9, “Displaying Frequency Distribution for a Specified Area (Accum Histogram)” in the user’s manual
Normal analog waveform area
Vertical axis
scale of
Window 1
Vertical axis
scale of
Window 2
Analysis
parameters
Window 1
(Analysis screen 1)
Horizontal axis scale of
Window 1
IM 701331-02E
Window 2
(Analysis screen 2)
Horizontal axis scale of
Window 2
Parts of the Screen
Screen Showing Logic Signals
Group display order
Section 5.15
Normal analog waveform area
Bus display in
hexadecimal
Section 5.17
Logic signal area
Group display
Sections
5.15 and 5.17
Trigger source mark
This mark is indicated
at the bit set to be the
trigger source.
Bus display in binary
Section 5.17
Bid display (bus display OFF)
Section 5.17
Trigger type
Sections 6.6 to 6.20
Displays “State” for state
display ( section 5.17)
Trigger slope and
polarity
Sections 6.6 to 6.20
IM 701331-02E
Basic Key and Rotary Knob Operations
Basic Key
Key and
and Rotary
RotaryKnob
KnobOperations
Operation
This section describes key and rotary knob operations which are basic operations for setting the DL9500/DL9700.
Basic Key Operations
Operations When a Setup Menu Is Displayed
ZOOM 1 Menu (Menu that appears when ZOOM 1 is pressed)
Setup menu
ESC
ESC key
Clears a setup menu or a setup dialog box.
Turn the rotary knob to change the setting.
A type of menu in which the item is selected from the displayed choices
(ON or OFF in this case)
The selected item switches each time you press the soft key.
The selected item (ON in this example) is highlighted.
A type of menu in which a selection menu is opened for
selecting items (with a mark)
Press the soft key to display the selection menu.
Press a soft key corresponding to the item you want to select.
A type of menu in which the item is selected using the rotary knob
(with and marks)
Press a soft key to select a menu you want to control using the rotary knob
( : selected, : not selected).
Turn the rotary knob to change the setting.
Note
Soft keys
How to display the setup menu marked with purple characters on the front panel
Press the SHIFT key to illuminate the SHIFT key, and then press the key
corresponding to the setup menu marked in purple.
Operations When a Setup Dialog Box Is Displayed
Waveform Parameter Setup Dialog Box
(When the Item soft key is pressed on the setup menu that appears when PARAM is pressed)
Setup dialog box
Use the rotary knob or arrow keys to select the item you want to set.
Press the SET key to select or deselect items.
A mark is displayed for the selected items.
(When these soft keys in the setup menu are pressed while the setup dialog box above is displayed: Area/Calc > Calc)
Press the SET key to open a box used to enter a value or characters.
Note
Press the ESC key to clear a setup menu or a setup dialog box from the screen.
IM 701331-02E
Basic Key and Rotary Knob Operations
Basic Rotary Knob Operations
Selecting an Item or Setting a Value
Resets a setting to
the default value.
RESET
Press this key to open a menu for the item
you select using the rotary knob or to
confirm a setting.
SET
Selects the right (or below) item.
Increases the value.
Selects the left (or above) item.
Decreases the value.
Up and down arrow keys
Selects the above or below item.
Changes a setting.
Left and right arrow keys
Selects the left or right item.
Moves the current digit left or right.
Convenient Feature Operation Using a USB Mouse
Section 4.3, “Operating the DL9500/DL9700 Using a USB Keyboard
or a USB Mouse” in the user’s manual.
By connecting a USB mouse to the USB connector for peripheral devices on the front panel, you can use a
USB mouse to perform the same operations as you would using the front panel keys of the DL9500/DL9700.
DL9500/
DL9700
USB connector for
peripheral devices
USB mouse
Top menu
Right-click on the screen to show the names of
each key on the front panel as a top menu.
Sub menu
For items with a lower hierarchy under the top
menu, a sub menu is displayed.
Pointer
Move the pointer to the item you want to select
and left-click. The setup menu corresponding to
the selected item appears.
Left-click an area outside the menu to show the
previous setup menu.
The setup menu clears if the setup menu that is
showing is the top level menu.
10
IM 701331-02E
Introduction of the Main Functions
Introduction of the Main Functions
This section describes the main functions of the DL9500/DL9700. For details on each item, see the respective chapter or
section in the user’s manual indicated by the
or
mark.
Triggers for Analog Signals
Chapter 6, “Triggers” in the user’s manual
The triggers can be classified into three main types: edge/state triggers, width triggers, and enhanced triggers.
Edge/State trigger
Edge
A trigger is activated on
the rising or falling edge
when the trigger source
passes through a specified
trigger level. You can set
the trigger source* to the
input signal, external
trigger signal, or
commercial power supply
that is supplying power to
the DL9500/DL9700.
Section 6.6
Edge (Qualified)
A trigger is activated on
the edge of a single
trigger source while the
signal status of each input
channel is meeting a
specified condition
(qualification).
Section 6.7
Edge (OR)
A trigger is activated when
any of the edge conditions
is met among multiple
trigger sources.
Section 6.9
State
A trigger is activated when
the signal status of each
input channel meets or no
longer meets a specified
condition (state). A trigger
can also be activated by
checking the condition on
the edge of a specified
clock signal.
Section 6.8
Width trigger
Pulse
A trigger is activated by
determining whether the pulse
width of a single trigger source
is longer or shorter than a
specified determination time.
Section 6.10
Enhanced trigger
TV
A trigger is activated on a
video signal.
Section 6.13
Serial
A trigger is activated on
the data pattern of a
serial bus signal.
Section 6.14
Pulse (Qualified)
A trigger is activated when
a pulse trigger condition is
met while the signal status
of each input channel is
meeting a specified
condition (qualification).
Section 6.11
I2C
A trigger is activated on the
start condition,
address/data pattern,
Non-ACK, general call
address, start byte, or
high-speed mode of an I2C
Bus signal.
Section 6.15
Pulse State
A trigger is activated when the relationship between the
time over which the signal status of each input channel
meets or does not meet a specified condition (state) and the
specified determination time is met. A trigger can also be
activated by checking the condition on the edge of a
specified clock signal.
Section 6.12
CAN
A trigger is activated on the
SOF, error frame, data
frame, or remote frame
pattern of a CAN Bus
signal.
Section 6.16
SPI
A trigger is activated on
the data pattern of a SPI
Bus signal.
LIN
A trigger is activated on
the rising edge of the
break delimiter of a LIN
Bus signal.
Section 6.17
UART
A trigger is activated on
the Stop Bit of all data
frames of an UART Bus
signal.
Section 6.19
Section 6.18
* Trigger source refers to the signal that is used in checking the trigger condition.
IM 701331-02E
11
Introduction of the Main Functions
Triggers for Logic Signals
Chapter 6, “Triggering” in the user’s manual
The triggers can be classified into two main types: edge/state triggers and width triggers.
Edge/State trigger
Logic Edge
Logic Edge (Qualified)
A trigger is activated when
the signal of a specified bit
(trigger source*) changes
to the selected polarity.
Section 6.6
A trigger is activated when a
logic edge trigger condition is
met while the signal status of
each bit is meeting a specified
condition (qualification).
Section 6.7
Logic State
A trigger is activated when the signal status of each bit
meets or no longer meets a specified condition (state).
A trigger can also be activated by checking the
condition at the point of polarity change (edge) of a
specified clock signal.
Section 6.8
Width trigger
Logic Pulse
A trigger is activated by determining
whether the pulse width of the
signal of a specified bit (trigger
source) is longer or shorter than a
specified determination time.
Section 6.10
Logic Pulse State
A trigger is activated when the relationship between the time over which the signal
status of each bit meets or does not meet a specified condition (state) and the
specified determination time is met. A trigger can also be activated by checking
the condition at the point of polarity change (edge) of a specified clock signal.
Section 6.12
* Trigger source refers to the signal that is used in checking the trigger condition.
History Memory
Chapter 11, “Displaying and Searching History Waveforms” in the user’s manual
When waveforms are being measured, the waveform data in the acquisition memory that has been stored on trigger events
is displayed as waveforms on the DL9500/DL9700 screen. When waveforms are acquired on continuous trigger events,
it is impossible to stop the measurement in time when you notice an abnormal waveform (by that time newer waveforms
are already on the screen). Normally, abnormal waveforms in the past cannot be displayed. However, by using the history
memory function, the past waveform data (history waveforms) stored in the acquisition memory can be displayed when
waveform acquisition is stopped. You can display a specific history waveform.
Additionally, you can search for a waveform that meets a specified waveform condition among the history waveforms. The
following six conditions are available.
• Conditions for searching waveforms that passed (or not passed) a specified search zone
Waveform zone, rectangular zone, or polygon waveform
• Conditions for searching waveforms whose measured values are within or outside a specified range.
Waveform parameter values of automated measurement, FFT values, or area values of XY waveforms
Example of a rectangular
zone search
History waveform
(Up to 2000 screens)
A specified zone
Detects waveforms
that pass through a
specified zone.
Example of a waveform
parameter search
Detects waveforms
whose specified
waveform parameter
exceeds a specified
range.
History waveform
(Up to 2000 screens)
P-P
Selected # 0
12
Selected # –25
Selected # 0
Selected # -28
IM 701331-02E
Introduction of the Main Functions
Zooming in on Waveforms
Section 8.1, “Zooming the Waveform” in the user’s manual
The displayed waveform can be expanded along the time or voltage axis. You can zoom in on two locations simultaneously.
This function is useful when the waveform acquisition time is set long and you want to observe a particular section of the
waveform closely. You can also set the zoom position (zoom box position).
Zoom box Z2
Normal waveform
area
Zoom box Z1
Displays zoom waveforms
(Z1 and Z2) of two locations.
Zoom waveform area of Z1
Zoom waveform area of Z2
Accumulated Display
Section 7.7, “Displaying Accumulation” in the user’s manual
The display time of old waveforms can be set longer than the waveform update period, so that newer waveforms appear
overlapped (accumulated) on older waveforms. This feature is convenient when observing waveforms that include noise or
jitter or observing phenomena that occur infrequently. The accumulated waveforms can be saved.
The following two modes are available.
Count
Waveforms are accumulated the specified number of counts. The waveforms are displayed using different colors or
intensities according to the frequency information of the data.
Time
Waveforms are accumulated over the specified time. The waveforms are displayed using different colors or intensities
depending on how recent the data is.
Snapshot
Section 8.7, “Taking and Clearing Snapshots” in the user’s manual
The snapshot function allows you to temporarily hold a waveform that would be cleared when the screen is updated in
update mode or a waveform that would move out of the waveform display area in roll mode. The snapshot waveform is
displayed in white and can be compared against the updated waveform. The snapshot waveform can also be saved or
printed as a screen image.
Press SNAP CLEAR to clear the snapshot waveform.
Snapshot waveform
Displayed in white.
Updated waveform
X-Y Waveform Display
Section 10.6, “Viewing the Phase Between Measured Waveform on the XY Display” in the user’s manual
The level relationship between two signals can be observed by assigning the signal level of a specified waveform on the
X-axis (horizontal axis) and the signal level of another waveform (waveform whose display turned ON) on the Y-axis (vertical
axis). Simultaneous observation of an X-Y waveform and a normal T-Y waveform (waveform using time axis and signal level)
is also possible. Up to two X-Y waveforms can be displayed.
IM 701331-02E
13
Introduction of the Main Functions
Reference Waveform
Chapter 14, “Displaying Reference Waveforms” in the user’s manual
History waveforms of input channels, computed waveforms, or waveforms saved to the internal memory can be displayed as
reference waveforms in M1 to M4. Reference waveforms can be used in waveform computation.
Waveform Computation
Chapter 9, “Computation” in the user’s manual
The following operations are available: addition, subtraction, multiplication, linear scaling, integration, phase shift (display
phase-shifted waveforms), moving average (smoothing), IIR filter, edge count, and rotary count. Up to eight computations can
be assigned.
Cursor Measurement
Section 10.1, “Making Cursor Measurements” in the user’s manual
Cursors can be placed on the displayed waveform, and various types of measured values at the intersecting point of the
cursor and waveform can be displayed. There are six types of cursors: horizontal (H) cursors, vertical (V) cursors, horizontal
& vertical (H&V) cursors, vertical time (VT) cursors, marker cursors, and serial cursor.
Automated Measurement of Waveform Parameters
Section 10.2, “Automated Measurement of Waveform Parameters” in the user’s manual
This feature automatically measures parameters such as the maximum waveform level and frequency. It can measure 30
waveform parameters (including delay between channels) related to the voltage (vertical) axis, time (horizontal) axis, and
waveform area.
• Up to 16 arbitrary parameters can be displayed.
• A total of up to 100000 data values can be stored for all waveforms.
• The measured values of waveform parameters can be used in computations.
Statistical Processing
Section 10.3, “Performing Statistical Processing of the Measured Values of Waveform Parameters” in the user’s manual
Section 10.8, “Displaying a Histogram, Trend, or List of Automatic Measurement Waveform Parameters” in the user’s manual
Statistical processing for the following five items can be performed on three of the items measured through the automated
measurement of waveform parameters.
Maximum value (Max), minimum value (Min), mean value (Mean), standard deviation (σ), and the number of
measured values used in the statistical processing (Cnt).
Measurement range
Parameters and values of the statistical
processing targets
Statistical processing results
Max: Maximum value
Min:
Minimum value
Mean: Mean value
σ:
Standard deviation
Cnt:
Number of measured values used
in the statistical processing
14
IM 701331-02E
Introduction of the Main Functions
The following three statistical processing modes are available.
Normal statistical processing
Measures the selected parameters on all acquired waveforms while acquiring waveforms and
performs statistical processing.
Cyclic statistical processing (measurement and statistical processing per cycle)
Measures the selected parameters on the waveform per cycle from the left end to the right end
of the screen (from the oldest waveform) and performs statistical processing.
Statistical processing of history data
Measures the selected parameters on the history waveform and performs statistical
processing. Measurement and statistical processing are performed from the oldest data.
The measured results can be displayed as a list, trend, or histogram.
Telecom Test
Section 10.4, “Telecom Testing (Mask Test and Eye Pattern Measurement)” in the user’s manual
There are two available tests. The mask test is used to analyze the communication signal. The other test automatically
measures the waveform parameters of an eye pattern.
If you turn the telecom test ON, accumulated display (count mode) is automatically enabled. The mask test counts
the waveforms that pass through a masked area. The mask pattern is created using a free software provided on the
YOKOGAWA Website and loaded into the DL9500/DL9700.
Ethernet Interface
Chapter 15, “Ethernet Communications (Optional)” in the user’s manual
You can use the Ethernet function (/C10 option) to transfer data and control the DL9500/DL9700.
Save/Load data on a network drive
The waveform and setup data can be saved and loaded and screen image data can be saved to an FTP server* on
the network in the same way as with the PC card, internal hard disk (option), and external USB storage device.
* A PC or workstation running the FTP server function.
Print on a network printer
The screen image can be printed on a network printer in the same way as with the built-in printer or USB printer.
Mail transmission
You can send DL9500/DL9700 information via e-mail. You can also send information such as the trigger time in an
e-mail as an action for the action-on-trigger function.
Access the DL9500/DL9700 from a PC or workstation
You can access the internal memory or internal hard disk (option) on the DL9500/DL9700 from a PC or
workstation* on a network.
* A PC or workstation running an FTP client or Microsoft Network function.
Web server
The DL9500/DL9700 can operate as a Web server. By displaying the DL9500/DL9700 Web page, you can carry out
basic operations on the DL9500/DL9700 such as monitor the DL9500/DL9700 screen on the Web page, capture a
screen image, and start/stop measurements.
IM 701331-02E
15
Preparation
Preparation
This section describes preparations for observing waveform signals.
Connecting the Power Supply
Section 3.3, “Connecting the Power” in the user’s manual
To use the DL9500/DL9700 safely, read the warnings given in section 3.3, “Connecting the
Power” in the user’s manual before connecting the power supply.
Rear panel
3-prong outlet
Power cord
(standard accessory)
Rated supply voltage: 100 to 120VAC or 220 to 240 VAC
Rated supply voltage frequency: 50/60 Hz
Allowable supply voltage range: 90 to 132 VAC or 198 to 264 VAC
Allowable power supply frequency range: 48 to 63 Hz
Turning ON/OFF the Power Switch
Section 3.3, “Connecting the Power” in the user’s manual
Check that the power switch on the front panel is OFF before turning ON the main power
switch.
Turn ON the main power switch on the rear panel and then the power switch on the front panel.
Rear panel
Power switch on
the front panel
Main power
switch
16
IM 701331-02E
Preparation
Connecting the Probes
Section 3.4, “Connecting the Probe” in the user’s manual
Section 3.5, “Compensating the Probe (Phase Correction)” in the user’s manual
To use the DL9500/DL9700 safely, read the warnings and cautions given in section 3.4,
“Connecting the Probe” and section 3.5, “Compensating the Probe (Phase Correction)” in
the user’s manual before connecting the probe.
To observe analog signal waveforms, connect a probe to the input terminal on the front panel. To observe logic signals, see
“Connecting the Logic Probes” (next section).
• Connect a probe to the input terminal (CH1) of the DL9500/DL9700.
• Connect the probe tip to the probe compensation signal output terminal on the DL9500/DL9700 front panel.
• Connect the earth wire to the functional earth terminal.
Functional ground
terminal
Probe
Signal output terminal for probe
compensation adjustment
Phase correction
hole
Note
To actually observe waveforms, make sure to perform phase correction (section 3.5) and calibration (section 4.8) of the probe
according to the instructions in the user’s manual. Otherwise, waveforms cannot be observed correctly.
IM 701331-02E
17
Preparation
Connecting the Logic Probes
Section 3.6, “Connecting the Logic Probes” in the user’s manual
To use the DL9500/DL9700 safely, read the warnings and cautions given in section 3.6,
“Connecting the Logic Probes” in the DL9500/DL9700 User’s Manual and those given in
the user’s manual of the logic probe.
To observe logic signals, connect a logic probe to the logic signal input port on the rear panel. To observe analog signal
waveforms, see “Connecting the Probes” (previous section).
•
•
•
•
Turn OFF the power switch of the DL9500/DL9700.
Connect the cable that was provided with the logic probe to the logic probe.
Connect a probe tip, earth lead, pincher tip, or the like to the logic probe.
Connect the other end of the cable that was connected to the logic probe to the logic signal input port (POD A) of the
DL9500/DL9700.
• Turn ON the power switch of the DL9500/DL9700.
• Connect the pincher tip of the earth lead that was connected to the logic probe to the ground potential of the circuit under
measurement.
• Connect the pincher tip of the probe tip that was connected to the logic probe to the circuit under measurement.
To the circuit under
measurement
Probe tip
VID
EO
(XG OUT
A)
TRIG
Pincher tip
IN
USB
TRIG
OUT
GO/N
OGO
A
B
Earth lead
Logic signal input port (POD A)
Cable
18
IM 701331-02E
Observing the Analog Signal Waveforms
Observing the Analog Signal Waveforms
This section describes the procedure to observe analog signal waveforms. For the procedure to observer logic signals, see
page 27.
Carry out the following work before continuing with the subsequent procedure.
Apply the probe compensation signal that the DL9500/DL9700 generates to the CH1 input
terminal in order to observe analog signal waveforms. For the procedure to connect the
probe to the input terminal, see “Connecting the Probes” on page 17 in this operation guide.
Displaying Waveforms on the Screen
This section explains the setup initialization and auto setup that are convenient when displaying typical repetitive waveforms
such as sine and rectangular waves.
Initializing the Settings
Section 4.4, “Initializing Settings” in the user’s manual
We will reset the settings that have been entered using the front panel keys to factory default values.
This operation is not necessary if you are using the DL9500/DL9700 for the first time after purchase. However, we
recommend that you carry out the operation for your learning experience. This initialization operation is useful when you
want to redo the settings from scratch based on the input signal.
SETUP
1 Press SETUP.
2 Press the Initialize soft key.
Initialization is executed.
Press here to set the DL9500/DL9700
back to the condition that existed
immediately before the initialization.
Note
• If you initialize the DL9500/DL9700, all channel displays are turned ON and data acquisition starts.
• The items that cannot be initialized using the Initialize soft key are as follows:
Date/time settings, communication settings, setup data and waveform data stored in the internal memory, and language
settings
• To initialize all the settings excluding the date/time settings and the setup data and waveform data stored in the internal memory,
carry out the procedure below.
Note that this procedure cannot be undone.
[Turn ON the power switch while holding down the RESET key]
IM 701331-02E
19
Observing the Analog Signal Waveforms
Performing Auto Setup
Section 4.5, “Performing Auto Setup” in the user’s manual
Vertical axis (voltage axis), horizontal axis (time axis), trigger, and other settings are automatically configured based on the
input signal.
This feature is useful when you want to quickly display the waveform or when you do not know the setup conditions because
the characteristics of the input signal are unknown.
SETUP
1 Press SETUP.
2 Press the Auto Setup soft key.
Auto setup is executed.
Press here to set the DL9500/DL9700 back
to the condition that existed immediately
before auto setup.
Note
• When auto setup is executed, only the waveforms of the channels in which signals are being applied are displayed.
• Auto setup is possible on the following waveform.
Frequency: Approximately 50 Hz or higher. Absolute value of the input voltage: The maximum value is greater than or equal to 20
mV (1:1). Type: Repetitive waveform (not complicated).
20
IM 701331-02E
Observing the Analog Signal Waveforms
Changing the Waveform Display Conditions
This section explains how to change the settings such as the display format; voltage sensitivity and vertical position (vertical
axis settings); and time axis (horizontal axis setting).
Changing the Voltage Sensitivity from 500 mV/div to 200 mV/div
Section 5.7, “Setting the Scale” in the user’s manual
1 Turn the SCALE knob clockwise to set the voltage sensitivity to 200 mV/div.
The setting that is being changed is displayed
temporarily.
A portion of the form is no longer
displayed, because the voltage
sensitivity has been increased.
Note
If multiple waveforms are displayed, press the
key
so that CH1 can be controlled using the SCALE knob.
Voltage sensitivity of CH1
Lowering the Vertical Position for Viewing the Entire Amplitude of a Waveform
Section 5.3, “Setting the Vertical Position of the Waveform” in the user’s manual
1 Turn the POSITION knob counterclockwise to set the vertical position to –2.00 div.
The setting that is being changed is displayed
temporarily.
The entire amplitude of the waveform can now be seen, because the
vertical position has been reduced.
Note
If multiple waveforms are displayed, press the
key
so that CH1 can be controlled using the POSITION knob.
The ground level mark moves together with the
vertical position mark.
IM 701331-02E
21
Observing the Analog Signal Waveforms
Changing the Time Axis Setting from 200 µs/div to 100 ms/div
Section 5.8, “Setting Time Axis (T/div)” in the user’s manual
Time axis setting refers to setting of the time per division of the grid.
If the time axis setting is increased when the trigger mode is set to Auto or Auto Level, the screen display changes from
update mode in which the waveform display is refreshed at given intervals to roll mode in which the waveforms flow from
right to left on the screen.
Roll mode display is useful when observing signals with a long period or signals with slow changes.
1 Turn the T/DIV knob counterclockwise to set the time axis to 100 ms/div.
The setting that is being changed is displayed
temporarily.
Time axis setting
Displayed so that the waveform flows from right to left.
Roll mode display
Changing the Time Axis Setting from 100 ms/div to 500 µs/div
Section 5.8, “Setting Time Axis (T/div)” in the user’s manual
The screen display switches back from roll mode display to update mode display and shows five periods of the waveform.
1 Turn the T/DIV knob clockwise to set the time axis to 500 ms/div.
The setting that is being changed is displayed
temporarily.
Time axis setting
Update mode display
22
IM 701331-02E
Observing the Analog Signal Waveforms
Changing the Trigger Settings
Trigger setting determines the time position of the acquired signal to be displayed as a waveform.
The main trigger settings are indicated below.
Trigger Type
The triggers can be classified into three main types: edge/state triggers, width triggers, and enhanced triggers. For details, see page 11
in this operation guide.
Trigger Source
Trigger source refers to the signal that is used to check the trigger condition.
Trigger Slope
Trigger slope refers to the movement of the signal from a low level to a high level (rising edge) or from a high level to a low level (falling
edge). If the slope is used as one of the trigger conditions, it is called a trigger slope. Edge refers to the point where the trigger source
slope passes through the trigger level.
Trigger Level
Trigger level refers to a given level at which a trigger is activated when the trigger source passes this level. With simple triggers such
as the edge trigger (see page 11 in this operation guide), a trigger is activated when the trigger source level passes through a specified
trigger level.
Trigger Mode
Trigger mode specifies the conditions (timing or count) for updating the displayed waveform. If auto setup is performed, the trigger mode
is set to Auto. There are five trigger modes. For details, see section 6.1, “Setting the Trigger Mode” in the user’s manual.
Trigger Position
When you start waveform acquisition, a trigger is activated based on a specified trigger condition, and the waveform acquired to the
acquisition memory is displayed. By moving the trigger position on the screen, the ratio of the data before the trigger point (pre data) and
the data after the trigger point (post data) can be changed. The default value is 50.0% (center of the screen).
If the settings are initialized or auto setup is executed, the trigger type is set to edge/state (trigger source: CH1 edge trigger).
The edge trigger activates a trigger on a rising or falling edge of a single input signal.
This section explains how to change the trigger slope, trigger mode, and trigger position while keeping the trigger type at
edge trigger.
Changing the Trigger Slope from Rising to Falling
Section 6.6, “Activating an Edge Trigger” in the user’s manual
1 Press SOURCE.
Trigger level mark
A trigger is activated on
the falling edge of the
waveform.
2 Select
(falling edge).
Note
• Check that the Edge/State key is illuminated.
• The menu that appears when you press the SOURCE key varies depending on the trigger type.
IM 701331-02E
23
Observing the Analog Signal Waveforms
Moving the Trigger Position Left by 2 Divisions
Section 6.2, “Setting the Trigger Position” in the user’s manual
The waveform moves to the left by 2 divisions showing more of the waveform after the trigger occurrence (post-trigger
section).
1 Press POSITION/DELAY.
Trigger point
Pre-trigger
section
Post-trigger section
Trigger position mark
2 Turn the rotary knob counterclockwise to set
the trigger position to 30%.
Changing the Trigger Mode from Auto to Single
Section 6.1, “Setting the Trigger Mode” in the user’s manual
In Single mode, the displayed waveforms are updated only once when a trigger is activated, and acquisition stops.
Single mode is suited for observing single shot signals.
1 Press TRIG MODE/HOLD OFF.
When the waveform acquisition stops, “Running” changes to “Stopped”.
Indicates that this is the first waveform acquisition.
2 Select Single.
24
IM 701331-02E
Observing the Analog Signal Waveforms
Measuring Waveforms
This section explains how to measure the voltage and period of the displayed waveform using the vertical cursors.
Automated measurement of waveform parameters, computation, and other functions are also available for measuring pulse
and other waveforms.
Measuring the Voltage Using the Vertical Cursors
Section 10.1, “Making Cursor Measurements” in the user’s manual
The voltage (vertical axis value or Y-axis value) and time (horizontal axis value or X-axis value) at the cursor position are
displayed in the lower section of the waveform area.
1 Press CURSOR.
CURSOR
T1 cursor
2 Display the selection menu and select Vertical.
T2 cursor
3 Select T1 cursor so that it can be controlled
using the rotary knob.
T1:
T2:
∆T:
The X-axis value at the T1 cursor
The X-axis value at the T2 cursor
The difference between the X-axis values of T1
and T2 cursors
1/∆T: The inverse of the difference between the X-axis
values of T1 and T2 cursors
4 Turn the rotary knob to move the T1 cursor.
5 Likewise, move the T2 cursor.
If you select both T1 cursor and T2 cursor,
the two cursors can be moved simultaneously
using the rotary knob.
Note
Cursor types
Vertical cursors
Horizontal cursors
Vertical & horizontal cursors
VT cursors
Marker cursors
Serial cursor
IM 701331-02E
Measures the X-axis value at the cursor position.
Measures the Y-axis value at the cursor position.
Measures the X- and Y-axes values at the cursor position.
Measures the time from the trigger position to the cursor position and the Y-axis value at the cursor
position of each waveform.
Measures the X- and Y-axes values of the waveform. The marker cursors move on the waveform. M1
(Marker 1) to M4 (Marker 4) can be set on different waveforms.
Displays the Y-axis value at the cursor position with respect to a specified level as 0 or 1. You can set
the bit rate, the number of bits to be displayed, and so on.
25
Observing the Analog Signal Waveforms
Zooming in on Waveforms
This section explains how to expand a section of the displayed waveform along the time (horizontal) axis. Though not
covered in this operation guide, you can also expand the voltage (vertical) axis.
Setting the Time (Horizontal) Zoom Ratio
Section 8.1, “Zooming the Waveform” in the user’s manual
Normal waveforms and zoomed waveforms of two locations can be displayed simultaneously. When zoom waveforms are
displayed, zoom boxes indicating the zoom range and position are displayed in the normal analog waveform area.
DISP 1
ZOOM 1
DISP 2
ZOOM 2
1 Press ZOOM 1 or ZOOM 2.
Normal analog waveform area
The setting that is being changed is displayed
temporarily.
Zoom box Z1
Zoom box Z2
Press ZOOM 1 to set the zoom ratio of Z1. Press
ZOOM 2 to set the zoom ratio of Z2.
2 Select zoom direction H.
3 Turn the MAG knob to set the zoom ratio.
Display area of zoom area Z1
Display area of zoom area Z2
Moving the Zoom Position along the Time (Horizontal) Axis
Section 8.1, “Zooming the Waveform” in the user’s manual
Move the zoom position while viewing the zoom box.
DISP 1
ZOOM 1
DISP 2
ZOOM 2
1 Press ZOOM 1 or ZOOM 2.
Press ZOOM 1 to move the zoom box Z1
position. Press ZOOM 2 to move the zoom box
Z2 position.
Zoom box Z1
Zoom box Z2
2 Set the movement direction of the zoom box
to H.
3 Turn OFF the Z1 and Z2 zoom box link.
4 Turn the rotary knob to move the zoom box.
Note
If you turn ON the Z1 and Z2 zoom box link in step 3,
you can move the two zoom boxes simultaneously.
26
IM 701331-02E
Observing Logic Signals
Observing Logic Signals
This section describes the procedure to observe logic signals. For the procedure to observer analog signal waveforms, see
page 19.
Carry out the following work before continuing with the subsequent procedure.
• To observer a logic signal, prepare a logic signal of approximately 1-V amplitude and 1-kHz
frequency and apply it to the logic signal input port (POD A) of the DL9500/DL9700.
• Use YOKOGAWA’s 701981 or 701980 logic probe to connect to the input port. To match
the input conditions of the logic signal to those used in this operation guide, apply the
logic signal that you prepared to bits 0, 1, 2, and 4 of the logic probe. Bits 0, 1, 2, and 4
correspond to bits A0, A1, A2, and A4 of POD A, respectively.
• For the procedure to connect a logic probe to the input port, see “Connecting the Probes”
on page 18 in this operation guide.
Displaying Logic Waveforms on the Screen
The auto setup function of the DL9500/DL9700 only supports analog signals. Therefore, you must set the trigger source,
trigger type, and threshold level to acquire and display the input logic signals.
First, we will initialize the settings and set the trigger source to bit A0. Then, we will set the trigger type and threshold level on
the next page.
Initializing the Settings
Section 4.4, “Initializing Settings” in the user’s manual
We will reset the settings that have been entered using the front panel keys to factory default values. By factory default, the
trigger source of the logic signal is set to bit A0.
This operation is not necessary if you are using the DL9500/DL9700 for the first time after purchase. However, we
recommend that you carry out the operation for your learning experience. This initialization operation is useful when you
want to redo the settings from scratch based on the input signal.
SETUP
1 Press SETUP.
2 Press the Initialize soft key.
Initialization is executed.
Press here to set the DL9500/DL9700
back to the condition that existed
immediately before the initialization.
Note
• If you initialize the DL9500/DL9700, all channel displays are turned ON and data acquisition starts.
• The items that cannot be initialized using the Initialize soft key are as follows:
Date/time settings, communication settings, setup data and waveform data stored in the internal memory, and language
settings
• To initialize all the settings excluding the date/time settings and the setup data and waveform data stored in the internal memory,
carry out the procedure below.
Note that this procedure cannot be undone.
[Turn ON the power switch while holding down the RESET key]
IM 701331-02E
27
Observing Logic Signals
Setting the Trigger Type to Logic Edge
Section 6.6, “Activating an Edge Trigger” in the user’s manual
Because we are applying an approximately 1-kHz logic signal, we set the trigger type to Logic Edge.
1 Press EDGE/STATE.
2 Select Logic Edge.
If you execute the initialization procedure
explained on the previous page, the trigger
source of the logic signal is set to bit A0. A
logic signal of approximately 1-V amplitude is
applied to bit A0.
Setting the Threshold Level to 0.5 V
Section 5.18, “Setting the Threshold Level” in the user’s manual
Because we applying a logic signal of approximately 1-V amplitude, we set the threshold level to 0.5 V.
1 Press LOGIC. The screen is divided into top and bottom halves, and the logic signal
area is displayed in the bottom half.
3 Display the threshold level setup
menu.
2 Display the next menu.
Trigger point
Trigger position mark
5 Turn the rotary knob clockwise to set the
threshold level to 0.5 V.
The logic signal is acquired allowing you to
view the signal.
Bit name
Normal analog waveform area
Logic signal area
Trigger source mark
Group name
28
4 Select User.
IM 701331-02E
Observing Logic Signals
Changing the Display Conditions for Logic Signals
This section explains how to set the vertical display size and vertical position of the logic signal and how to change the bus
display.
Maximizing the Display Size
Section 5.16, “Setting the Display Size and Vertical Position of Logic Signals” in the user’s manual
1 Turn the SCALE knob clockwise to make the vertical display size the maximum.
You can feel a click sensation when you turn the SCALE knob. Turn the knob by confirming each
click. There are five levels of display size (amplitude size). The maximum display size will be
obtained if you turn the SCALE knob clockwise for two clicks from the display size shown on page
28 of this operation guide.
The vertical display size (amplitude size)
of the logic signals is expanded.
Moving the Vertical Position Upward
Section 5.16, “Setting the Display Size and Vertical Position of Logic Signals” in the user’s manual
1 Turn the POSITION knob clockwise to move the vertical position upward.
You can feel a click sensation when you turn the POSITION knob. Turn the knob by confirming
each click. If you turn the knob three clicks from the maximized display condition of the previous
section, the vertical position moves upward and bits A5 to A7 move off the screen.
Bits A5 to A7 move off the
screen.
IM 701331-02E
29
Observing Logic Signals
Moving the Vertical Position Downward
Section 5.16, “Setting the Display Size and Vertical Position of Logic Signals” in the user’s manual
1 Turn the POSITION knob counterclockwise to move the vertical position downward.
You can feel a click sensation when you turn the POSITION knob. Turn the knob by confirming
each click. If you turn the knob counterclockwise three clicks from the condition in which the
vertical position was moved upward in the previous section, the vertical position moves downward,
and bits A5 to A7 appears on the screen.
Bits A5 to A7 can now be seen.
Changing from Bit Display to Hexadecimal Bus Display
Section 5.17, “Enabling the Bus Display, Displaying the State, Mapping Bits to Groups” in the user’s manual
1 Press LOGIC.
Here, we return to the previous menu from the threshold level setup menu described on
page 28 in this operation guide and set the bus display.
3 Display the bus display setup
menu.
2 Display the previous menu.
30
IM 701331-02E
Observing Logic Signals
We will change the logic signal of Group 1 from bit display to hexadecimal bus display.
Hexadecimal bus
display of Group 1
4 Check that Group 1 is selected.
5 Select ON.
6 Check that Hex is selected.
Note
• A group is a set of logic signals. The bit signals of the logic signal input port can be assigned to a group from the highest to the
lowest digit as necessary. Up to five groups can be created. For details, see section 5.17 in the user’s manual.
• A state display function is available. This function acquires the status of a logic signal on the point of polarity change (edge) of a
specified clock signal. The state is held until the next clock occurs even if the input logic signal changes. For details, see section
5.17 in the user’s manual.
IM 701331-02E
31
Observing Logic Signals
Changing the Trigger Settings
For a description of the main trigger setting items, see page 23 in this operation guide.
Changing the Trigger Polarity to “High to Low”
Section 6.6, “Activating an Edge Trigger” in the user’s manual
This section explains how to change the trigger polarity. For easier viewing of the changes in the acquired signal, we will turn
OFF the bus display that was set in the previous section and then change the polarity.
1 Press LOGIC.
2 Display the selection menu and
select OFF.
3 Press SOURCE.
Trigger source mark
4 Select
(from high to low).
A trigger is activated when
the signal changes from
high to low.
Note
• Check that the Edge/State key is illuminated.
• The menu that appears when you press the SOURCE key varies depending on the trigger type.
32
IM 701331-02E
Observing Logic Signals
Measuring Logic Signals
Logic signals can be measured using VT cursors. This section explains how to use these cursors.
Reading Logical Values Using VT Cursors
Section 10.1, “Making Cursor Measurements” in the user’s manual
The logical values of the logic signals at the cursor position are displayed in the lower section of the waveform area.
CURSOR
1 Press CURSOR.
Trigger position mark
3 Turn the rotary knob to move the VT cursor.
2 Display the selection menu and select VT.
VT cursor
The measured values of the analog waveform.
For details, see section 10.1 in the user’s manual.
T: The time from the trigger
position to the cursor
position
V(LG1): Logical value of logic signal Group 1
V(LG2): Logical value of logic signal Group 2
V(LG3): Logical value of logic signal Group 3
V(LG4): Logical value of logic signal Group 4
Note
Cursor types
In addition to the VT cursors describe above, there are other cursors: vertical cursors, horizontal cursors, horizontal & vertical cursors,
marker cursors, and serial cursor. Horizontal cursors, horizontal & vertical cursors, marker cursors, and serial cursor can only be applied to
analog waveforms. For an overview of the measured information, see page 25 in this operation guide.
IM 701331-02E
33
Printing and Saving Waveforms
Printing/Saving Waveforms
This section explains how to print the displayed waveform on the built-in printer (/B5 option) and save the waveform on a
storage medium. Printing is also possible on a USB printer or a network printer (/C8 or /C10 option).
You can also save data to a flash ATA card (PC card TYPE II) or compact flash (using the PC card TYPE II adapter) using
the built-in PC card interface. The data can also be saved to a network drive (/C8 or /C10 option).
Printing the Screen Image on the Built-in Printer
Section 12.2, “Printing Using the Built-in Printer (Optional)” in the user’s manual
Waveforms displayed on the screen are printed as shown. The printer icon at the lower left of the screen blinks while the
image is being printed.
Before printing, load the roll paper according to the procedure given in section 12.1, “Installing the Roll Paper into
the Built-in Printer (Optional)” in the user’s manual.
PRINT
1 Press PRINT. Printing is executed.
Print example
Note
Pressing SHIFT followed by PRINT displays the PRINT menu.
You can select the print destination (built-in printer, USB printer,
or network printer (option)) and save destination. You do not
have to set them here.
34
PRINT menu
Press the Copy to soft key to
display a selection menu.
IM 701331-02E
Printing and Saving Waveforms
Saving the Screen Image Data to a Storage Medium
Section 13.9, “Saving Screen Image Data” in the user’s manual
The screen image data is saved to the storage medium. The media access icon at the lower left of the screen blinks while
the image is being saved.
MENU
SHIFT
+ PRINT
1 Press SHIFT (the SHIFT key illuminates) and then PRINT.
2 Display the selection menu and select File.
3 Display the selection menu and select the
data format.
4 Display the selection menu and select the
color mode.
5 Open the dialog box and select the
Drive name of the storage medium
Network:
Flash Mem:
HD:
USB Storage:
Storage Card:
Network drive (option)
Internal memory
Internal hard disk (option)
USB storage device
PC card
storage destination medium.
6 Press the Open soft key on the setup
menu that appears simultaneously with the
dialog box to confirm the file path to the
selected storage medium.
IM 701331-02E
ESC
7 Press ESC. The dialog box closes.
PRINT
8 Press PRINT again. The save operation is executed.
35
Printing and Saving Waveforms
Saving the Waveform Data to a Storage Medium
Section 13.5, “Saving/Loading the Measurement Data” in the user’s manual
The waveform data displayed on the screen is saved to a storage medium. When you execute the save operation, the setup
data of the vertical axis, horizontal axis, and trigger of the saved waveform are also saved. The media access icon at the
lower left of the screen blinks while the data is being saved.
FILE
1 Press FILE.
2 Turn the rotary knob to select the save
destination medium.
3 Open the selected storage medium.
Drive name of the storage
medium
(see the previous page)
To save data to a specific folder,
click here to confirm the folder
you selected before opening the
folder.
Press here to return to the higher
level directory.
4 Display the Save menu.
Save menu
5 Set the data type to ACQ Memory.
These settings are not covered in this
operation guide. As necessary, change
the settings by referring to section 13.5 in
the user’s manual.
6 Execute the save operation.
36
IM 701331-02E