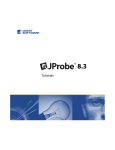
1
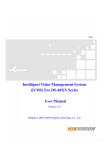
Running a Performance Analysis
Investigating Your Results
251
Encapsulation Types
There are three levels to choose from to collect encapsulated data: Full, Grouped
(default), and None. Each setting provides a different level of abstraction for viewing
method information. Encapsulating data assists you in focusing on hotspots and data
that is important to you.
To begin investigating the encapsulated options, let’s examine a call tree representation
of methods captured in your application. The parent methods and their encapsulated
children method are displayed in a hierarchical view.
Figure 46
Unfiltered Call Tree
During filtering, the call tree is mostly preserved, but there may be some methods that
are not exposed. For example, V3 may have called a method that called another method
that eventually called V5.
Full Option
Tip
The Full option requires a lot of resources during the collection of data impacting the amount
of time it takes to run a session.
Choosing the Full encapsulated option provides the most comprehensive way of
viewing method information. The structure of this call tree is most like the call tree
representation of your application data. The data shows only the first encapsulated
method; all other information about encapsulated methods is removed from the call tree.