1
REGIONAL MARK INFORMATION SYSTEM
USER GUIDE
Pacific States Marine Fisheries Commission
Regional Mark Processing Center
Version 3.1; March 2012
RMIS -- User Guide
MAR 2012
Chapter 1 Data Introduction and Overview .......................................................................... 5
1.1 Document References............................................................................................... 5
1.2 Types (classes) of data ............................................................................................. 6
Release (RL) .............................................................................................................. 6
Catch / Sample (CS) ................................................................................................... 6
Recovery (RC) ............................................................................................................ 6
Catch-&-Effort (CE)..................................................................................................... 7
Location (LC) ............................................................................................................. 7
Description (DD) ........................................................................................................ 7
Chapter 2 RMIS Elements, Definitions, and Setup ................................................................ 8
2.1 RMIS Web Site Elements .......................................................................................... 8
RMIS Home Page & Query Systems .............................................................................. 8
News & Data Status Page .......................................................................................... 10
Other Pages ............................................................................................................. 11
2.2 Definitions ............................................................................................................ 11
2.3 RMIS Usage Setup ................................................................................................. 13
Login ...................................................................................................................... 13
Hardware and Software Requirements......................................................................... 13
Chapter 3 RMIS Standard: Introduction, & Navigation ....................................................... 14
3.1 RSR Navigation...................................................................................................... 15
Chapter 4 RMIS Standard: Query Form Window ................................................................ 16
4.1 Key Fields & Data Restriction ................................................................................... 16
Entering Codes ......................................................................................................... 16
Key Fields ................................................................................................................ 16
Wild-Card Searches .................................................................................................. 17
Geographic Narrowing Menus ..................................................................................... 17
2
RMIS -- User Guide
MAR 2012
Chapter 5 RMIS Standard: Query Results Window ............................................................. 19
Results & Preview section .......................................................................................... 20
Choose Report section............................................................................................... 21
Send To & Options sections........................................................................................ 21
CSV / HTM Data Field Chooser section......................................................................... 22
Customized User List................................................................................................. 23
Chapter 6 RMIS Standard: Report Examples ..................................................................... 23
6.1 Release Reports..................................................................................................... 23
General Release Reports & Downloading ...................................................................... 23
Adclipped-Release Reports ......................................................................................... 29
Related Releases Reports .......................................................................................... 31
6.2 Recovery Reports................................................................................................... 33
Recoveries-by-Tag-Code Reports ................................................................................ 34
Recoveries-by-Release-Hatchery Reports ..................................................................... 47
Recoveries-by-Tag-List Reports .................................................................................. 52
All Recoveries Reports ............................................................................................... 53
6.3 Other Reports........................................................................................................ 54
Catch /Sample Downloading ...................................................................................... 54
Locations Downloading .............................................................................................. 55
Chapter 7 RMIS Analysis: Introduction and Navigation ....................................................... 56
7.1 RAR Navigation...................................................................................................... 58
Chapter 8 RAR Tag-List Maintenance ................................................................................ 59
8.1 Automatic Tag Code Grouping ................................................................................. 59
8.2 Manual Tag Code Grouping ..................................................................................... 59
8.3 More Editing Features ............................................................................................. 60
Adding Tag Code ...................................................................................................... 60
3
RMIS -- User Guide
MAR 2012
Changing Sort Columns ............................................................................................. 60
Excluding Tag Codes ................................................................................................. 60
Looking up Tag-Code Detail ....................................................................................... 60
Emailing RAR Tag-List ............................................................................................... 61
Chapter 9 RAR Combined Fishery Maintenance .................................................................. 61
9.1 Adding Groups to a Combined-Fishery ...................................................................... 62
Step 1 ..................................................................................................................... 62
Step 2 ..................................................................................................................... 62
Repeat .................................................................................................................... 62
Chapter 10 RAR CWT Recovery Reports ............................................................................ 62
Chapter 11 RAR Fishery Recovery Report .......................................................................... 76
Chapter 12 APPENDIX ..................................................................................................... 77
12.1 Explanation of RSR, TA3 Report ............................................................................. 77
12.2 Table of RAR CRAS1 Management-Fisheries............................................................. 78
4
RMIS -- User Guide
MAR 2012
Chapter 1 Data Introduction and Overview
This user guide is intended for users of the Regional Mark Information System (RMIS) web
application operated by the Pacific States Marine Fisheries Commission (PSMFC).
The Pacific States Marine Fisheries Commission hosts the Regional Mark Processing Center
(RMPC). This office maintains RMIS to facilitate exchange of regional tagging and marking data
between release agencies, sampling/recovery agencies, and other data users. The RMPC houses
the regional Coded-Wire Tag (CWT) database.
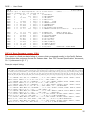
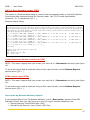
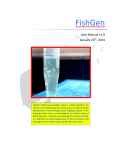
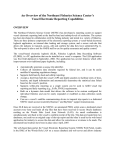
Figure 1: Flowchart showing flow of datasets at the PSMFC Regional Mark Processing Center
The data flow process of the RMPC is shown in Figure 1. The CWT data are submitted to the
RMPC where they are loaded and validated against an extensive set of checks. These checks are
to verify the integrity and accuracy of the data elements. The RMPC also serves as the U.S. site
for exchanging U.S. CWT data with Canada for Pacific Salmon Treaty purposes. Canada also
houses a complete copy of coastwide CWT data sets.
1.1 Document References
Users of the RMIS web site must be familiar with the principal CWT data specification reference
named below. It is very important that users of CWT data understand the information contained
in this document in order to perform conclusive, accurate and responsible analysis of these data.
If you do not have a copy of this document you may download an electronic copy at the
following URL: CWT Data File Definition, Specification, & Validation . In addition, users of RMIS
may wish to consult the principal overview publication of the coast-wide CWT program located at
this URL: Overview of the CWT Program .
5
RMIS -- User Guide
MAR 2012
1.2 Types (classes) of data
All types of data housed at the RMPC are described as follows.
Release (RL)
When a group of fish is released from a hatchery or other release site containing any number of
coded wire tagged fish, the group is associated with a unique tag code. Any pertinent
information from releasing agencies regarding the release group is submitted to the RMPC by the
responsible state, provincial, or federal agencies. There are approximately 50,000 tagged
release groups in the database dating back to 1968.
When groups of fish are released without coded wire tagged fish present, the release group is
called an untagged/unassociated group. The release group is assigned a 12 character alphanumeric identifier. This information is likewise submitted to the RMPC. There are approximately
100,000 untagged release groups in the database dating back to 1952.
Catch / Sample (CS)
Tagged fish are sampled at various commercial, recreational, tribal and escapement fisheries
Pacific Coastwide by sampling agencies. These agencies usually record the sampling area,
number caught, and percent of catch that was sampled and related information. This information
is called Catch/Sample data and is collected by sampling agencies for submission to the RMPC on
a yearly basis by specific reporting agencies. There are currently about 340,000 Catch/Sample
records in the database.
Recovery (RC)
When tags are removed from fish and decoded, the tag is linked to the specific location of catch,
date of catch, fishery, and other related biological data. Where possible, the ratio of the number
of fish sampled to the total catch is multiplied by the total number of tags extracted to form the
Estimated Number of fish. These data are collected by sampling agencies for submission to the
RMPC on a yearly basis along with Catch/Sample data. Individual recovery records correspond to
one observed (decoded) tag.
Each recovery record has an associated ‘Status of Tag’. This status is coded as follows:
‘1’ Tag read OK
‘2’ No tag
‘3’ Tag lost before read
‘4’ Tag not readable
‘7’ Unresolved discrepancy
‘8’ Head not processed
‘9’ Pseudo tag, blank wire
In addition to passing rigorous validation tests, the status ‘1’ recoveries must match by tag code
with a tagged release group. There are currently about 6 million status ‘1’ recovery records in
the database. Recoveries with a status other than ‘1’ are not included in most RMIS reports.
There are currently about 1.5 million non-status ‘1’ recoveries in the database.
6
RMIS -- User Guide
MAR 2012
Catch-&-Effort (CE)
Catch effort is the amount of fish caught by a specified amount of effort. It can also be defined
as the catch of fish, in numbers or in weight, taken by a defined unit of fishing effort. Typically,
effort is a combination of gear type, gear size, and length of time gear is used. Catch per unit of
effort is often used as a measurement of relative abundance for a particular fish. There are
currently about 140,000 Catch & Effort records in the database.
Location (LC)
The geographic locations of release, sample, and specific recovery of fish are also assembled by
specific location reporting agencies. Collectively, these are called Location data and are
submitted to the RMPC along with all other classes of data.
There are five types of locations. Within each type of location, the location record is uniquely
identified coastwide by a 19 character Location Code. That code is associated with a textual
description of the location and a geographical reference to the location. Currently there are
approximately 22,000 geographic locations referenced by the above classes of data (among a
total of about 35,000 location codes maintained in the database).
The five types of locations are described as follows:
1. Recovery Site: Indicates as closely as possible the actual geographic place where a
tagged fish was caught. They are usually specified within larger Catch Areas in the
sampling stratum. This type of location is found only in Recovery data.
2. Catch Area: Corresponds to geographic areas where sampling occurred for a given
fishery. They may encompass several recovery sites. This type of location is found in
Catch/Sample and Catch & Effort data.
3. Hatchery: Specifies the name of the hatchery or rearing facility for non-wild release
groups. This type of location is found only in Release data.
4. Release Site: Specifies the geographic release location of the release group. It may
differ from the hatchery. This type of location is found only in Release data.
5. Stock: Differs from all other locations in that they identify the brood stock or
morphology of a release group rather than a geographic location. Stocks usually
correspond to the name of a stream or if the stock was mixed, a composite of stream
names. This type of location is found only in Release data.
Description (DD)
In addition to the above classes, the CWT database contains Description data (e.g. metadata).
that is intended to help maintain a permanent centralized record of changes made over time to
the data values in the database (i.e. among the 5 data classes). Descriptions are intended to
indicate what data is new or what changes have occurred to the data itself since the last
submission of a given data type. Description data are all publicly available on the following
RMPC web page: RMPC News & Data Status (see § below).
7
RMIS -- User Guide
MAR 2012
Chapter 2 RMIS Elements, Definitions, and Setup
2.1 RMIS Web Site Elements
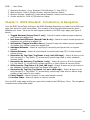
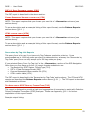
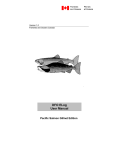
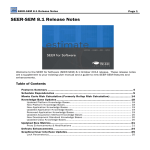
Figure 2: RMPC Home Page: http://www.rmpc.org
RMIS Home Page & Query Systems
RMIS is comprised of three principal Internet based reporting systems for public download of
CWT and related datasets (see Figure 2). They are:
1. RMIS Standard Reporting System (RSR)
2. RMIS Analysis Reporting System (RAR)
3. RMIS Catch-&-Effort Data Reporting System
The RMIS Standard Reporting System is an application that allows the user to build a query,
select, and optionally preview the result set row by row, and then run a formatted report of their
choice using the result set. The report may then be returned to the browser, or sent to their
email address. Data retrieval includes selection by location or by tag code as well as many other
data elements.
8
RMIS -- User Guide
MAR 2012
All classes of data are available in user-customizable raw data download format. In addition,
RMIS Standard Reporting has the following report formats available in either textual summary
(with page headers) or textual detail (one report row per line) levels:
• Release reports by tag code or release id: 5 reports (detail)
• Release reports by adipose clip: 1 report (summary)
• Recovery reports by tag code: 18 reports (summary and detail)
• Recovery reports by tag list: 2 reports (summary and detail)
• Recovery reports by hatchery of release: 7 reports (summary and detail)
• Catch / Sample reports: 1 report (detail/raw)
• Location reports: 1 report (detail/raw).
The RMIS Analysis Reporting System was developed to facilitate the analysis of coastwide
salmon recovery information in terms of actual geographic areas used for management of the
various fisheries. It refers to a version of the CWT database that is summarized by tag code,
“management-fishery” units, and age class of returning fish. RMIS Analysis allows the user to
auto-generate and maintain lists of tag codes based on various criteria—such as morphological
characteristics of the fish releases. RMIS Analysis also provides a means of organizing
(grouping) tag codes and/or management-fisheries by various user-identified criteria and using
the group definitions as units for aggregation in report output. RMIS Analysis Reporting has the
following report formats available:
• CWT- based recovery reports: 9 reports (summary and detail)
• Management-fishery based recovery report: 1 report (summary).
In the following chapters, this document will provide usage instructions for the RMIS Standard
and RMIS Analysis reporting systems (systems 1 & 2 above) as well as provide report
explanations and examples.
There are no formatted reports available of Catch-&-Effort data (only detail/raw reports are
available) so the RMIS Catch-&-Effort Reporting System (system 3 above) will not be
described in this document. Please see the CWT specification document described above or
contact the RMPC for specific information regarding Catch-&-Effort datasets.
9
RMIS -- User Guide
MAR 2012
News & Data Status Page
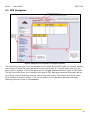
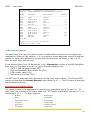
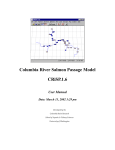
Figure 3: News & Data Status Page
This page of the web site includes (see Figure 3 and Figure 4):
• Status tables of all CWT metadata (‘Descriptions’) selectable by data class and reporting
agency which allow user tracking and review of data update activity.
• Status tables showing all current data processing information from the RMPC including
load date and number of records loaded into the database.
• Scrolling list of recent news developments regarding the RMPC computer system and the
CWT database updates.
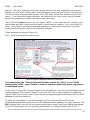
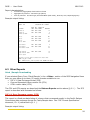
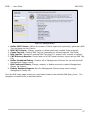
CWT metadata that has been provided by the Reporting Agencies can be obtained from these
charts. For example, under the column ‘Dataset Descriptions’, the ‘Recovery’ chart is illustrated
as follows:
10
RMIS -- User Guide
MAR 2012
Figure 4: Illustration of Data Status table and pop-up window showing metadata
Other Pages
The web site also includes an image gallery illustrating many aspects of the coastwide CWT field
processes as well as a set of numerous CWT related publications available for download.
2.2 Definitions
The following concepts and terms (both general and CWT specific) are used throughout RMIS
and this guide and are described here for reference.
Browser Delivery : An alternate method for delivery of report output. Suitable for small result
sets and reports that run quickly.
CSV Report : A report in text-based comma-separated-value (CSV) format. The first record of a
CSV report contains comma-separated field names. CSV report files can be imported into many
popular personal computer database and spreadsheet programs.
CSV/HTM Data Field Chooser : A window that allows you to choose which data fields to
include in your CSV or HTM report by clicking on PSC Common Names as described in the CWT
Data Format Specification (§ 1.1 ).
11
RMIS -- User Guide
MAR 2012
CWT : The Coded-Wire Tag database. Contains the Release, Recovery, Catch/Sample, and
Location data defined in CWT Data Format Specification (§ 1.1 ).
Database : A collection of related information and their definitions.
Email Delivery : The default method for delivery of report output. Preferable for large result
sets that take a long time to run and/or that produce large amounts of output.
Geographic Narrowing Menus: A series of menus (applicable to certain fields) which allow for
identifying RMIS Regions, RMIS Basins, or specific Location Codes by successively narrowing
down your choices and finally choosing the value(s) for placement into the field.
HTM Report : A report in Hyper-Text Markup Language (HTML) format. HTM reports can be
displayed as easily-viewable tables in a Web browser.
Key Field : A field on an RMIS Query Form that corresponds to an indexed column on the RMIS
data table in the CWT database. Every query must have at least one key field filled in.
Pop-up Window : A window that opens in your Web browser when you click on a link or a
button on the RMIS Web site. Pop-up windows are displayed above the main RMIS window and
they must be closed in order to return to the underlying window. Two uses of pop-up windows in
RMIS are to display help messages and to display forms that allow the user to click on
checkboxes to select data-codes when using a Query Form.
Preview Window : A separate browser window in which you can preview the result set
returned by your query prior to running a report.
Query Form : A Query Form is a set of parameters that identifies what data you want reported.
Queries serve to restrict the amount of data retrieved from the database when a report is run.
RAR Navigation Menu: The list of all available Query Forms and Report output formats in the
RMIS Analysis Reporting (RAR) system. This menu appears on the left-hand side of all RAR
Query Forms.
RMIS : The Web site that is used to create queries and run reports using data contained in the
CWT and CE databases.
RMPC : Regional Mark Processing Center, The PSMFC office that provides for the planning,
organization, direction and control of the centralized CWT data repository at the direction of the
Pacific Salmon Commission.
RSR Navigation Menu: The list of all available Query Forms in the RMIS Standard Reporting
(RSR) system (see Figure 6). This menu appears on the left-hand side of all RSR Query Forms.
Tag List : A tag list is a list of up to 1,000 tag codes. Tag lists are used in the Recoveries by Tag
List Query Form, which is optimized for quick retrieval of recovery data from large tag lists.
Wild Card Searches : Searching for character string patterns within fields of character data.
The most useful example of this is searching by location name when you don't know the exact
spelling of the name (see Figure 8).
12
RMIS -- User Guide
MAR 2012
2.3 RMIS Usage Setup
Login
The 3 RMIS reporting systems can all be accessed from the RMIS website home page (see Figure
2 above) by clicking on the desired reporting system. If RMIS Standard is chosen, the login
screen will appear as shown here (Figure 5).
Figure 5: RSR Login Screen
Returning Users:
New Users:
To login, enter your email address and click on the Login button.
The first time you login you'll need to verify that you want to create a new
account. At this point please enter in the following information:
1.
2.
3.
4.
Email Address (re-type)
Name
Organization
Phone Number
On subsequent logins your email address will be recognized as a returning
user.
RMIS logins are based on browser sessions. After you click the Login button you'll have full
access to all of the RMIS Reporting systems until you either logout or close your browser.
Hardware and Software Requirements
RMIS should function on a variety of systems and web browsers, including the following:
13
RMIS -- User Guide
1.
2.
3.
4.
MAR 2012
Operating Systems: Linux, Windows (2000/Windows-7), Mac (OS X);
Web browsers: Firefox, Google Chrome, Internet Explorer, Opera;
Browser settings: JavaScript is required and session cookies must be enabled;
Screen resolution: 1024 by 768 pixels or higher.
Chapter 3 RMIS Standard: Introduction, & Navigation
From the RMIS Home Page clicking on the RMIS Standard Reporting icon leads to the RSR Login
page (see above for login instructions). The contents of this page are determined by which
database you chose. Here are the start pages available on the RSR Login page (see Figure 5
above):
1. Tagged Releases (Record Code T only) : Search & report release groups containing
only coded-wire tagged fish
2. Non-Associated Releases (Record Code N only) : Search & report release groups not
containing any coded-wire tagged fish
3. All Releases (Tagged and Non-Assoc) : Search & report all release groups regardless
of whether they contain coded-wire tagged fish
4. Adclipped Releases : Search & report while comparing ad-clipped with un-clipped
releases
5. Related Releases : Search & report based on double-index tag (DIT) & other related
release groups
6. Recoveries by Tag Code (Tag Status 1 only, limit 180 tags) : Search & report on all
fully-decoded (i.e. Tag Status ‘1’) recoveries by specific tag codes or other release &
recovery fields
7. Recoveries by Hatchery (Tag Status 1 only) : Search & report on all fully-decoded
(i.e. Tag Status ‘1’) recoveries by release hatchery or other release & recovery fields
8. All Recoveries (Tag Status 1-9, limit 180 tags) : Search & report on all recoveries in
the database (including those with Tag Status other than ‘1’)
9. Recoveries by Tag List (Tag Status 1-9, up to 1000 tags) : Search & report on all
fully-decoded (i.e. Tag Status ‘1’) recoveries by specific tag codes and you have a large
number of tag codes for your search
10.Catch/Sample : Search & report on raw catch/sample records
11.Location Codes : Search & report on location records
From the RSR Login page clicking on Login button leads to the RSR Query Form. The navigation
of these forms is described below.
14
RMIS -- User Guide
MAR 2012
3.1 RSR Navigation
Figure 6: RSR Query Form illustration of navigation elements
The contents of the query form are determined by which type of CWT data you choose, but the
query forms all have the same general structure (see Figure 6). The left-hand column of the
query Form is a menu of links that allow you to navigate between different types of CWT data.
The top line of the query form identifies the type of CWT data being queried. Beneath that are
up to three rows of fields that you can use to build your query. The bottom line of the query
form contains a Retrieve button. Click on the button to run the query and see how many
matching records it finds in the database.
15
RMIS -- User Guide
MAR 2012
Chapter 4 RMIS Standard: Query Form Window
4.1 Key Fields & Data Restriction
Figure 7: RSR Query Form illustration of field & criteria elements
Entering Codes
Each field in a query form consists of a name and a box. You can click on the name which will
display a pop-up window for help in filling in the box, or you can type the desired criteria
(values) directly into the box. In general you can type as many values as you want into each
box, but each value must be on a separate line (Figure 7).
Key Fields
Some query forms (such as Recoveries by Tag Code shown in Figure 7) have ‘key’ fields. This
means that the data table has indexes on these fields and in order to select data there must be
at least one value entered in at least one of the key fields.
16
RMIS -- User Guide
MAR 2012
Wild-Card Searches
Figure 8: RSR Query Form illustration of wild-card pattern matching
Data rows may be found when searching by location name when you don't know the exact
spelling of the name. This is done using the pattern-matching character: ‘%’. For example,
within the Tagged Releases query form, CWT release groups that begin with the string ‘TRASK’
may be selected by entering the string TRASK% into the field ‘Hatchery Location Name’ (see
Figure 8). This locates data from both ‘TRASK R HATCHERY’ and ‘TRASK R PONDS’ facilities.
This query retrieves about 243 CWT rows from the database. Pattern-matches can sometimes
be used both before and after the search string. For example, ‘%COLUMBIA R%’ entered into
the field Release Location Name will match any rows of data where the Release Location
explicitly indicates the Columbia River.
Geographic Narrowing Menus
Some query forms in the RSR system allow geographic data selection using a series of menus
within a pop-up window. The user can simply type in the field values if known, or can use the
geographic narrowing menus by clicking on the field header. The fields listed below have this
capability -- allowing the user to choose from hydrologically defined domains, regions, and
basins to fill in the desired criteria value(s):
• Releases query forms: Release Location RMIS Region, Release Location RMIS Basin,
Release Location Name, Release Location Code, Hatchery Location Name, Hatchery
Location Code, Stock Location Name, Stock Location Code
• Locations query form: RMIS Region, RMIS Basin
Geographic criteria values are then placed into the query form by narrowing down your choices
through one or more of the following geographic divisions in the greater Pacific region:
17
RMIS -- User Guide
•
•
•
•
MAR 2012
RMIS Domain: (see Figure 9: RSR Locations lookup step 1: choose domain)
RMIS Region: (see Figure 10: RSR Locations lookup step 2: choose region)
RMIS Basin: (see Figure 11: RSR Locations lookup step 3: choose basins)
Location Code/Name: (see Figure 12: RSR Locations lookup step 4: choose locations)
Figure 9: RSR Locations lookup step 1: choose domain
Figure 10: RSR Locations lookup step 2: choose region
Figure 11: RSR Locations lookup step 3: choose basins
18
RMIS -- User Guide
Figure 12: RSR Locations lookup step 4: choose locations
MAR 2012
Figure 13: RSR Locations lookup result
The above figures (Figure 9 to Figure 13) show how to select releases from specific hatcheries
/facilities by using the geographic narrowing menus. Note that the location name(s) could also
be typed into the box exactly as seen or could be found by pattern-matching (see Figure 8);
however, these methods are subject to typing errors, etc. and are therefore somewhat less
reliable than using the geographic narrowing menus. In the above example scenario, after
placing the 2 values into the Hatchery Location Name field, the data can be selected by clicking
the ‘Retrieve’ button (see Figure 6).
These geographic divisions (RMIS Domain / RMIS Region / RMIS Basin) are detailed in
documents and maps found on the following RMPC web page: RMIS Map Documents.
Note that the geographic narrowing menus are also available on Recoveries and Catch/Sample
query forms; however, fully inclusive data selection cannot be assured on these query forms
using these menus since some Recovery Site locations do not have values for RMIS Region and
RMIS Basin codes. This is the case because RMIS Domain, RMIS Region, and RMIS Basin codes
are only formally defined for Release Site, Hatchery/Facility, and Stock locations.
Chapter 5 RMIS Standard: Query Results Window
After clicking ‘Retrieve’ the RSR system will attempt to retrieve the rows from the database and
go to the Query Results window. There could be some conditions in which the RSR system
cannot select the data rows and go to the Query Results window. These conditions include:
• ..Warning. Your <queryform> query didn't retrieve any rows. Please go back to the
Query form and change your query.
• ..Warning. Your <queryform> query must include a value for at least one key column.
Please go back to the Query form and change your query.
• ..Warning. Your <queryform> query retrieved too many rows (<# rows>). Please go
back to the Query form and change your query.
19
RMIS -- User Guide
MAR 2012
If rows are found for the query and the result is reportable, then the RSR system will open the
Query Results window -- a new window with the elements shown in Figure 14. The sections of
this window are described below.
Figure 14: RSR Query Result window illustration
Results & Preview section
The Query Results window begins by showing how many data rows were found based on the
specific criteria entered on the query form. You may go directly to the ‘Choose Report’ section
(see below) or you may wish to preview the data first. The Preview button opens a new
window which displays rows of data in sets of 20 rows at a time so you can inspect the data
retrieved by your query prior to running a report. The preview window is shown in Figure 15.
20
RMIS -- User Guide
MAR 2012
Figure 15: RSR Row Preview table illustration
If the data in the Preview table is not what you expected, click the Back button to return to the
Query Form and change your query.
When you are satisfied that the data in the Preview table looks correct, close the preview
window and choose your desired report format and delivery method, then click the Run button.
These elements are shown in Figure 14.
Choose Report section
The pop-up menu in this form-section allows you to choose the output format for your report.
Some reports have a row-limit specified. (I.e. the available reports shown here are determined
in part by the number of rows selected). For example, if you are running a Recoveries-byTagcode report and the number of rows selected is extremely large (e.g. more than 100,000
rows) then certain reports (such as TS3) may not appear as an option because they have a very
long page format and produce numerous lines for each row found. However, the raw data listing
reports (CSV, HTM, etc.) are nearly always available. If you choose Comma-Separated Values
(CSV) or HTML table (HTM) format, you will need to go down to the next section (see below) and
choose at least one output column before running the report.
These elements are shown in Figure 14.
Send To & Options sections
Send To: These two radio buttons allow you to choose the delivery method for your report.
Email is checked by default, which means the report will be delivered as an FTP link sent to you
by email. Due to limitations in the browser and server software, Send To: Browser is only
appropriate for short reports. For reports in which you expect large amounts of data (e.g. more
than about 5000 rows), it is better to check the Email button option.
21
RMIS -- User Guide
MAR 2012
Options: The CR-LF checkbox uses both carriage return & line feed characters as the record
delimiter for CSV & PSC reports rather than the default record delimiter which is line feed only.
The End of report checkbox adds the text of the SQL select clause after the last record in the
report. If you check the Params checkbox, the system will not run a report, but will instead
display only parameter and SQL information about the query.
Then, click on the Run button to run your report. NOTE: If you chose Send To: Browser, your
web browser will have to wait until the report is done running; however, if you chose Send To:
Email, you will get a confirmation message and then you can continue working in your web
browser without having to wait for the report to complete.
These elements are shown in Figure 14.
CSV / HTM Data Field Chooser section
Figure 16: RSR CSV/HTM Data Field Chooser illustration
You must choose the "Comma-Separated Values custom file (CSV)" or the "HTML
custom table (HTM)" report format in order to use these data field names to generate
a customized report.
Click on one or more PSC Common Names in the left-hand box. You may click and drag to select
multiple adjacent PSC Common Names, or you may Ctrl-click to select multiple non-adjacent
Names. Then click on the > button which will add corresponding data field names from the CWT
database to the right-hand box.
To select all of the Names in the left-hand box, click on the >> button and all of the
corresponding data field names from the CWT database will be added to the right-hand box. The
PSC> button works just like the >> button except that it selects only those Names that appear
in the PSC Specification for the currently selected table (i.e. Names prefixed with "[PSC]").
22
RMIS -- User Guide
MAR 2012
If you make a mistake by choosing the wrong data fields, you can correct the mistake by clicking
on the Clear button which will clear out the right-hand box so you can re-do the field selection.
These elements are shown in Figure 16.
Customized User List
If you have built a customized list of Data Fields in the ‘Data Fields chosen’ box and would like to
use the list later, you may select the list from this box and paste it into your own (local)
document. Save the document for later use. Then when running a report later on, you may use
this customized list of Data Fields by clicking on the User List button. After clicking on User
List, follow the instructions to validate the list for getting the list inserted back into the ‘Data
Fields chosen’ box. This procedure is illustrated as Scenario 1 and Scenario 2 in Figure 16
above.
Then, after you have chosen all your data fields run your report by clicking the Run button (see
Figure 14 or Figure 16).
Chapter 6 RMIS Standard: Report Examples
RMIS Reports can be run from the Query Results Window after rows of data have been selected
(see Figure 14). The set of available reports is determined by the Query Form initially chosen
for selecting data (see Figure 6).
6.1 Release Reports
General Release Reports & Downloading
If you selected one of these three Query Forms in the --Releases-- section of the RSR
Navigation Menu:
• Tagged Releases
• Non-Assoc. Releases
• All Releases
then you may have up to nine (9) report formats available to run:
• RMPC Release book, side A (RBA)
• RMPC Release book, side B (RBB)
• PSC 4.1 Data Exchange format (PRL)
• Comma-Separated Values custom file (CSV)
• HTML custom table (HTM)
• Tag List (RTL) for copy/paste to new query
• Releases with Zero Rec. By Tag Code (RZ1)
• Releases with Zero Rec. By Hatchery (RZ2)
• CWT & Total Released By Year (RTR).
These reports are described and illustrated as follows:
23
RMIS -- User Guide
MAR 2012
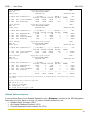
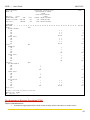
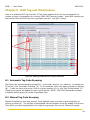
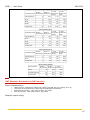
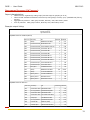
RMPC RELEASE BOOK, SIDE A (RBA)
This report lists the most commonly used columns from the Releases data file (including
numbers of fish released). Report characteristics:
•
•
•
tabular format
does not break down or aggregate data results
sorts by column: Tag Code or Release Id.
Example output listing:
PAGE 1A
Tag Code or.
Release ID..
042222
042244
042255
044422
051122
052222
052233
052244
052255
054422
Tag
Typ
0
0
0
0
0
0
0
0
0
0
Run. Spec BdYr Rel.
Agy
Spri Chin 1981 ADFG
Coho 1981 ADFG
Spri Chin 1982 SSRA
Fall Coho 1993 ADFG
Fall Chin 1981 FWS
Fall Chin 1989 FWS
Wint Sthd 1989 FWS
Spri Chin 1989 FWS
Coho 1988 FWS
Fall Chin 1999 FWS
Hatchery Location... Release Location.... First.
Release
DEER MOUNTAIN
KETCHIKAN CR 101-47 830516
SNETTISHAM
INDIAN LK 111-33
830826
WHITMAN LAKE
NEETS BAY 101-90
840601
MARX CREEK
MARX CR 101-15
950316
QUINAULT NFH -COOK C COOK CR
21.0429 830503
ABERNATHY SCDC HATCH ABERNATHY CR 25.0297 900329
EAGLE CR NFH
EAGLE CR (CLACKAMAS) 900425
WARM SPRINGS NFH
WARM SPRINGS R
900926
QUILCENE NFH
BIG QUILCENE 17.0012 900503
SPRING CR NFH
SPRING CR
29.0159 000420
Last..
Release
830516
830826
840601
950529
830503
900518
900425
910417
900503
000420
064422
071122
072211
072222
072233
072244
072255
073322
074422
082211
12
0
0
0
0
0
0
0
9
0
Fall
Spri
Spri
Spri
Late
Fall
MERCED R FISH FACIL
CEDC YOUNGS BAY NET
COLE RIVERS HATCHERY
MCKENZIE HATCHERY
FALL CR HATCHERY
ELK R HATCHERY
SANDY HATCHERY
BONNEVILLE HATCHERY
TRASK R HATCHERY
H-Quinsam River H
010508
960229
801212
810316
801025
801025
810501
850513
870416
830421
Chin
Chin
Chin
Chin
Chin
Chin
Coho
Chin
Coho
Fall Chin
2000
1994
1979
1979
1979
1979
1979
1984
1985
1982
CDFG
ODFW
ODFW
ODFW
ODFW
ODFW
ODFW
ODFW
ODFW
CDFO
MERCED R FISH FACIL
YOUNGS R & BAY
ROGUE R 4
MCKENZIE R 1
FALL CR (ALSEA R)
ELK R
CEDAR CR #2 (SANDY R
TANNER CR (BNVILLE)
TRASK R
R-Campbell Est
010508
960229
801211
810316
801025
801025
810501
850513
870416
8304
14:52:15 11/08/2011
CWT.... Loss
Non-CWT
Mrk Cnt Rate
Mrk Cnt
8,341 0.022
188
7,164 0.219
11,836
20,063 0.012
50,593
686 0.0186
13
27,545 0.033
27,705
22,241 0.0838
863,661
21,027 0.0659
1,483
49,883 0.03
1,542
26,109 0.01
140,117
66,303 0.1282 2,084,195
24,722
51,737
29,811
36,005
25,214
26,173
27,742
79,162
27,118
11,666
0.019
0.019
0.009
0.072
0.012
0.014
0.025
0.039
0.018
0.0201
479
81,780
65,861
2,793
306
372
158,162
146,974
150,180
239
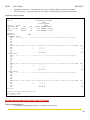
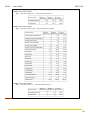
RMPC RELEASE BOOK, SIDE B (RBB)
This report lists some additional columns from the Releases data file that are not included in the
RBA report. Report characteristics:
•
•
•
tabular format
does not break down or aggregate data results
sorts by column: Tag Code or Release Id.
Example output listing:
24
RMIS -- User Guide
PAGE 1B
Tag Code or.
Release ID..
042222
042244
042255
044422
051122
052222
052233
052244
052255
054422
Tag
Typ
0
0
0
0
0
0
0
0
0
0
064422
071122
072211
072222
072233
072244
072255
073322
074422
082211
12
0 W
0
0
0
0
0
0 W
9 W
0
MAR 2012
Ct. T.L. Weight Length Rear Rel.. Rel.
Mhd Days (gm) (mm) Type Stage Type
107 17.70
H
Smolt
6
85 H
Unkn E
45 47.60
H
Unkn P
0
H
Smolt B
34 64.86
H
Smolt K
W
36 6.06
H
Finlg E
W
108 41.46
H
Smolt E
B
173 32.89
H
Smolt B
W
42 20.45
H
Smolt P
B
32 6.71
95 H
Finlg K
54
34
170
160
103
30
172
20
68
5
6.74
41.69
58.68
47.59
38.67
40.86
23.62
7.48
40.03
3.60
83 H
H
H
H
H
H
H
H
H
H
Finlg
Smolt
Unkn
Unkn
Unkn
Unkn
Unkn
Unkn
Unkn
Smolt
E
B
P
E
P
P
P
E
P
E
St. CoInt ord
01
01
01
N 01
N 07
N 07
N 07
N 07
N 07
N 07
N
N
08
05
05
05
05
05
05
05
05
03
15:33:43 11/08/2011
Stock Location...... Comments...................................
KETCHIKAN CR
SNETTISHAM+SPEEL
LPW (UNUK R)
MARX CR 101-15
COOK CR
21.0429
ABERNATHY CR 25.0297
CLACKAMAS R EARLY
WARM SPRINGS R
BIG QUILCENE 17.0012 QUIL000061
ABERNATHY CR 25.0297 SC 62 Columbia River
Spring Creek NFH
MERCED RIVER
MERCED R. SURVIVAL TEST.
SANTIAM R S FK
NET PEN STUDY FROM MCKENZIE
COLE RIVERS HATCHERY
MCKENZIE HATCHERY
FALL CR (ALSEA R)
ELK R (ELK R HT)
SANDY R (SANDY HT)
TANNER CR (BNVILLE)
TRASK R (TRASK HT)
S-Quinsam R
ESTUARY STUDY - ESTUARY RELEASE
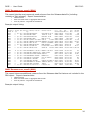
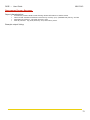
PSC 4.1 DATA EXCHANGE FORMAT (PRL)
This report is a fixed raw data listing of columns that correspond exactly to the Pacific Salmon
Commission data exchange format for Release data. See "PSC Format Specification" document,
Ch. 2 (referenced in §1.1 ).
Example output listing:
record_code,format_version,submission_date,reporting_agency,release_agency,coordinator,tag_code_or_release_id,tag_type,first_sequ
ential_number,last_sequential_number,related_group_type,related_group_id,species,run,brood_year,first_release_date,last_release_d
ate,release_location_code,hatchery_location_code,stock_location_code,release_stage,rearing_type,study_type,release_strategy,avg_w
eight,avg_length,study_integrity,cwt_1st_mark,cwt_1st_mark_count,cwt_2nd_mark,cwt_2nd_mark_count,non_cwt_1st_mark,non_cwt_1st_mar
k_count,non_cwt_2nd_mark,non_cwt_2nd_mark_count,counting_method,tag_loss_rate,tag_loss_days,tag_loss_sample_size,tag_reused,comme
nts
"N","4.1","20020328","NIFC","SUQ","14","!14199800107",,,,,,"5","3","1997","19980512","19980512","3F10510 150298 R","3F10510
150298 H","3F10510 150298 S","F","H","P","FR","1.22","0","N",,,,,"0000","615952",,,"B",,,,,
"N","4.1","20020328","NIFC","SUQ","14","!14199800106",,,,,,"5","3","1997","19980429","19980429","3F10510 150298AR","3F10510
150298 H","3F10510 150298 S","F","H","P","FR",".52","0","N",,,,,"0000","131343",,,"B",,,,,
"N","4.1","20040126","NIFC","SUQ","14","!14200300016",,,,,,"5","3","2002","20030313","20030327","3F10510 150298 R","3F10510
150298 H","3F10510 150298 S","E","H",,"VO",".38",,"N",,,,,"0000","490900",,,"B",,,,,"EGG BOX RELEASE"
"N","4.1","20081106","WDFW","WDFW","04","!04710025808",,,,,,"2","3","1970","19710422","19710422","3F42001 260002 R","3F42001
270017 H","3F42001 270017 S","G","H",,,"1.18",,,,,,,"0000","285000",,,"B",,,,,
"N","4.1","20081106","WDFW","WDFW","04","!04990017473",,,,,,"2","3","1998","19990719","19990719","3F553 27 QMB559 R","3F42001
270017 H","3F42001 270002 S","G","H",,,"5.66",,,,,,,"0000","97800",,,,,,,,"SURPLUS COHO."
"T","4.1","20110617","WDFW","WDFW","04","635694","12",,,,,"1","3","2010","20110601","20110609","3F42001 260002 R",,"3F42001
260002 S","S","M","P",,"5.84","78",,"0000","82047",,,,,,,,,,,,"Bo. Mix rel. by COWLITZ SALMON HATCH"
"T","4.1","20110617","WDFW","WDFW","04","635576","13",,,,,"2","7","2009","20110427","20110502","3F42001 260002 R",,"3F42001
260002 S","S","W",,,"29.52","136",,"0000","823183",,,"0000","4549",,,,,,,,"Bo. W rel. by COWLITZ SALMON HATCH"
"T","4.1","20110617","WDFW","WDFW","04","635389","13",,,,,"2","7","2009","20110427","20110502","3F42001 260002 R",,"3F42001
260002 S","S","W","P",,"29.84","138",,"0000","251270",,,,,,,,,,,,"Bo. W rel. by COWLITZ SALMON HATCH"
25
RMIS -- User Guide
MAR 2012
COMMA-SEPARATED VALUES CUSTOM FILE (CSV)
NOTE: This report requires that you choose your own list of --Releases—columns (see Figure
16).
This report is simply a raw data listing of columns that you can customize by arranging in any
order desired. It is generally intended for import into a spreadsheet program for further
manipulation. Report characteristics:
•
•
does not break down or aggregate data results
has no particular sort order.
Example output listing:
tag_code_or_release_id,reporting_agency,tag_type,species,brood_year,first_release_date,rearing_type,release_strategy,release_loca
tion_name,cwt_1st_mark,cwt_1st_mark_count,cwt_2nd_mark,cwt_2nd_mark_count,comments
"!05NT9020","ODFW",,"3","2007","20070602","H","FR","ROWLAND CR (COQUILLE R S",,,,,"FRY RELEASE VO 1190"
"!05NT9062","ODFW",,"3","2006","20060611","H","FR","ROWLAND CR (COQUILLE R S",,,,,"FRY RELEASE VO1173 COQUILLE HS"
"635176","WDFW","13","2","2008","20100428","W",,"COWLITZ R
26.0002","5000","936291",,,
"635286","WDFW","12","1","2009","20100610","M",,"COWLITZ R
26.0002","0000","197510",,,
"634979","WDFW","12","2","2007","20090402","W",,"COWLITZ R @ MAYFIELD","0000","11362",,,"COHO WILDSTOCK"
"634983","WDFW","12","2","2007","20090402","W",,"COWLITZ R @ MAYFIELD","0000","11398",,,"COHO WILDSTOCK"
"634984","WDFW","12","2","2007","20090630","W",,"COWLITZ R @ MAYFIELD","0000","4243",,,"COHO WILDSTOCK"
"!04970009259","WDFW",,"8","1996","19970509","H",,"HORSESHOE LK (COWL)",,,,,"THESE WERE EXTRA CUTTHROAT"
"!04970009261","WDFW",,"8","1996","19970529","H",,"HORSESHOE LK (COWL)",,,,,"THESE WERE EXTRA CUTTHROAT"
"!04070045591","WDFW",,"8","2006","20070415","H",,"COWLITZ R
26.0002",,,,,
"!04060042811","WDFW",,"8","2006","20060831","H",,"COWEEMAN LK (COWL)",,,,,
"!04980014495","WDFW",,"8","1998","19981020","H",,"LK MERWIN (COWL)",,,,,"EXCESS TO PROGRAM."
"!04980014513","WDFW",,"8","1998","19981026","H",,"ROWLAND LK (KLIC)",,,,,"EXTRA 98 BROOD."
HTML CUSTOM TABLE (HTM)
NOTE: This report requires that you choose your own list of --Releases—columns (see Figure
16).
This report is simply a raw data listing of columns that you can customize by arranging in any
order desired. The columns are placed into an HTML formatted table for viewing in an Internet
browser. It is generally intended only for viewing in an Internet browser. Report
characteristics:
•
•
does not break down or aggregate data results
has no particular sort order.
Example output listing:
26
RMIS -- User Guide
MAR 2012
TAG LIST (RTL) FOR COPY/PASTE TO NEW QUERY
This report simply generates a list of tag codes that can be copied to the clipboard and pasted
into the tag code field on a Release or Recovery Query Form. It is generally used to select
Recoveries when only certain Release criteria are known and a tag code list has not yet been
obtained for insert into a Recoveries by Tag Code (see Figure 7 above) or Recoveries by Tag-List
query form.
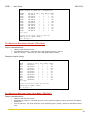
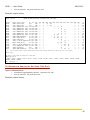
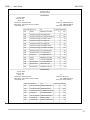
RELEASES WITH ZERO REC. BY TAG CODE (RZ1)
This report lists release groups based on the query entered which have zero recoveries (i.e.
groups for which no recoveries have occurred). It is applicable to the Tagged Releases query
form. Report characteristics:
•
•
does not break down or aggregate data results
sorts by column: Tag Code.
Example output listing:
27
RMIS -- User Guide
MAR 2012
14:23:36 12/05/2011
REPORT: RZ1
Tag Code
024339*1
041340
042422
065101
065102
B40003
B40004*2
B40600
B40700
B40701
B41509
End of report
Rel.
Agcy
CDFO
ADFG
ADFG
CDFG
CDFG
ADFG
ADFG
NSRA
ADFG
ADFG
ADFG
Regional Mark Information System
RELEASES WITH ZERO RECOVERIES
BY TAG CODE
Hatchery
Location Name
SNETTISHAM
JERRY MYERS
WARM SPRINGS HATCHERY
WARM SPRINGS HATCHERY
TRAIL LAKES
TRAIL LAKES
MEDVEJIE CIF
TRAIL LAKES
TRAIL LAKES
BIG LAKE
Spec 1st
Rel.
Coho 1986
Coho 1987
Coho 1986
Coho 1985
Coho 1985
Coho 1985
Coho 1985
Coho 1986
Coho 1985
Coho 1985
Coho 1985
Last
Rel.
1986
1988
1986
1985
1985
1985
1985
1986
1985
1985
1985
PAGE 1
Release
Location Name
R-Sheslay R
TWIN LKS 111-40
TAIYA INLET 115-34
WARM SPRINGS HATCHERY
WARM SPRINGS HATCHERY
SIX MILE CR 247-60
SIX MILE CR 247-60
FINGER LK 109-10
TERN LK 244-30
QUARTZ CR 244-30
WASILLA LK 247-50
The query criteria used to produce this report was:
WHERE record_code = 'T'
AND species = '2'
AND brood_year = 1984
RELEASES WITH ZERO REC. BY HATCHERY (RZ2)
This report lists release groups based on the query entered which have zero recoveries (i.e.
groups for which no recoveries have occurred). It is similar to the RZ1 report (described above)
except that it is sorts by different columns. Report characteristics:
•
•
does not break down or aggregate data results
sorts by columns: Release Agency, Hatchery Location Name.
Example output listing:
14:34:08 12/05/2011
REPORT: RZ2
Rel. Hatchery
Agcy Location Name
ADFG BIG LAKE
ADFG JERRY MYERS
ADFG SNETTISHAM
ADFG TRAIL LAKES
ADFG TRAIL LAKES
ADFG TRAIL LAKES
ADFG TRAIL LAKES
CDFG WARM SPRINGS HATCHERY
CDFG WARM SPRINGS HATCHERY
CDFO
NSRA MEDVEJIE CIF
End of report
Regional Mark Information System
RELEASES WITH ZERO RECOVERIES
BY HATCHERY
Spec 1st
Rel.
Coho 1985
Coho 1986
Coho 1987
Coho 1985
Coho 1985
Coho 1985
Coho 1985
Coho 1985
Coho 1985
Coho 1986
Coho 1986
Last
Rel.
1985
1986
1988
1985
1985
1985
1985
1985
1985
1986
1986
Release
Location Name
WASILLA LK 247-50
TAIYA INLET 115-34
TWIN LKS 111-40
TERN LK 244-30
SIX MILE CR 247-60
SIX MILE CR 247-60
QUARTZ CR 244-30
WARM SPRINGS HATCHERY
WARM SPRINGS HATCHERY
R-Sheslay R
FINGER LK 109-10
PAGE 1
Tag Code
B41509
042422
041340
B40700
B40003
B40004*2
B40701
065102
065101
024339*1
B40600
The query criteria used to produce this report was:
WHERE record_code = 'T'
AND species = '2'
AND brood_year = 1984
28
RMIS -- User Guide
MAR 2012
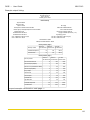
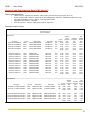
CWT & TOTAL RELEASED BY YEAR (RTR)
This report provides an aggregate summary in two columns showing total CWT-only fish
released, and all fish released. It also provides a subtotal for each Release Year and Species.
Report characteristics:
•
•
aggregates by columns: Release Year, Species
sorts by columns: Species, Release Year, State/Province.
Example output listing:
14:38:36 12/05/2011
REPORT: RTR
Species Name
-----------Coho
Coho
Coho
Regional Mark Information System
CWT & TOTAL RELEASED BY YEAR
Coho
State CWT Released Total Released
----- ------------ -------------NA
109091
553625
OR
48758
505400
WA
898349
2110151
------------ -------------2003 subtotal
1056198
3169176
Coho
Coho
2004
2004
Coho
2004 subtotal
Coho
PAGE 1
Release Year
-----------2003
2003
2003
OR
WA
2003
2003
2003
Steelhead
2003 subtotal
Steelhead
Steelhead
Steelhead
2004
2004
2004
Steelhead
2004 subtotal
Steelhead TOTAL
557016
2511111
-------------3068127
============ ==============
2049006
6237303
TOTAL
Steelhead
Steelhead
Steelhead
46629
946179
-----------992808
CA
ID
WA
159207
184042
207761
-----------551010
166580
1990668
381906
-------------2539154
CA
ID
WA
121789
214619
196719
-----------533127
127265
1957510
409882
-------------2494657
============ ==============
1084137
5033811
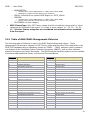
Adclipped-Release Reports
If you selected Query Form Adclipped Releases in the --Releases-- section of the RSR
Navigation Menu then you may have up to three (3) report formats available to run:
• Ad-clipped Releases Summary (AS1)
• Comma-Separated Values custom file (CSV)
• HTML custom table (HTM).
The CSV and HTM reports are described in the section above. The AS1 report is described and
illustrated as follows:
29
RMIS -- User Guide
MAR 2012
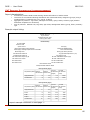
AD-CLIPPED RELEASES SUMMARY (AS1)
This report provides an aggregate summary of ad-clipped and unclipped releases in 6 columns
including:
•
•
•
•
•
•
CWT-tagged & Ad-clipped
CWT-tagged & Unclipped
Non-CWT-tagged & Ad-clipped
Non-CWT-tagged & Unclipped
Non-CWT-tagged & Unknown clip status
Totals column.
It also provides columnar subtotals and a grand total. Report characteristics:
•
•
aggregates by columns: Species, Brood Year, State/Province, Release Year, RMIS Region, RMIS Basin,
Hatchery/Facility
sorts by columns: Species, Brood Year, Release Year.
Example output listing:
30
RMIS -- User Guide
15:22:51 12/05/2011
REPORT: AS1
SPECIES: Chinook
MAR 2012
Regional Mark Information System
AD-CLIPPED RELEASES SUMMARY
BROOD YEAR: 2007
PAGE 1
RELEASE YEAR: 2008
S/P REGION BASIN HATCHERY/FACILITY
WA
WA
CECR
CECR
WIND
WIND
----- CWT TAGGED ----- ------------ NON-CWT ------------AD-CLIPPED UNCLIPPED AD-CLIPPED UNCLIPPED
UNKNOWN
LTL WHITE SALMON NFH
199665
199740
1603155
0
0
SPRING CR NFH
445962
445588
14002310
5410
0
15:22:51 12/05/2011
REPORT: AS1
SPECIES: Chinook
Regional Mark Information System
AD-CLIPPED RELEASES SUMMARY
BROOD YEAR: 2007
CECR
CECR
CECR
CECR
DESC
WIND
WIND
WIND
RELEASE YEAR: 2009
----- CWT TAGGED ----- ------------ NON-CWT ------------AD-CLIPPED UNCLIPPED AD-CLIPPED UNCLIPPED
UNKNOWN
WARM SPRINGS NFH
577289
0
3598
0
0
CARSON NFH
71613
0
1144585
0
0
LTL WHITE SALMON NFH
71221
0
519542
0
0
WILLARD NFH
75394
0
349175
0
0
15:22:51 12/05/2011
REPORT: AS1
SPECIES: Chinook
Regional Mark Information System
AD-CLIPPED RELEASES SUMMARY
BROOD YEAR: 2008
S/P REGION BASIN HATCHERY/FACILITY
WA
WA
CECR
CECR
WIND
WIND
Regional Mark Information System
AD-CLIPPED RELEASES SUMMARY
BROOD YEAR: 2008
TOTAL
580887
1216198
590763
424569
PAGE 3
RELEASE YEAR: 2009
----- CWT TAGGED ----- ------------ NON-CWT ------------AD-CLIPPED UNCLIPPED AD-CLIPPED UNCLIPPED
UNKNOWN
LTL WHITE SALMON NFH
511501
197857
5828541
1938
0
SPRING CR NFH
359893
439989
10513169
94
0
15:22:51 12/05/2011
REPORT: AS1
SPECIES: Chinook
2002560
14899270
PAGE 2
S/P REGION BASIN HATCHERY/FACILITY
OR
WA
WA
WA
TOTAL
TOTAL
6539837
11313145
PAGE 4
RELEASE YEAR: 2010
S/P REGION BASIN HATCHERY/FACILITY
OR
WA
WA
WA
CECR
CECR
CECR
CECR
Report Totals
DESC
WIND
WIND
WIND
----- CWT TAGGED ----- ------------ NON-CWT ------------TOTAL
AD-CLIPPED UNCLIPPED AD-CLIPPED UNCLIPPED
UNKNOWN
WARM SPRINGS NFH
699847
0
5394
0
0
705241
CARSON NFH
74183
0
1204309
0
0
1278492
LTL WHITE SALMON NFH
72614
0
512189
0
0
584803
WILLARD NFH
74970
0
350571
0
0
425541
---------- ---------- ---------- ---------- ---------- ---------3234152
1283174
36036538
7442
0
40561306
Note: Numbers of adipose-clipped fish may be inaccurate due to incomplete data collection and/or partial marking.
End of report
The query criteria used to produce this report was:
WHERE species IN ('1','3')
AND brood_year IN (2007,2008)
AND release_agency = 'FWS'
AND release_location_rmis_region = 'CECR'
Related Releases Reports
If you selected Query Form Related Releases in the --Releases-- section of the RSR Navigation
Menu then you may have up to four (4) report formats available to run:
• Related Group Summary (RS1)
• Ad-clipped Releases Summary (AS1)
• Comma-Separated Values custom file (CSV)
31
RMIS -- User Guide
•
MAR 2012
HTML custom table (HTM).
The CSV, HTM, and AS1 reports are described in the sections above. The RS1 report is
described and illustrated as follows:
RELATED-GROUP RELEASES SUMMARY (RS1)
This report provides a tabular chart with information for all members of a given related group of
fish (i.e. releases sharing the same Related Group Id). The columns shown include:
•
•
•
•
CWT 1-st Mark
CWT 2-nd Mark
Ad-clipped
Unclipped.
It also provides a totals row as well as the ratio of unclipped to clipped fish to be used in DIT
(Double-Index Tag) group analysis. Report characteristics:
•
•
aggregates by column: Related Group Id
sorts by columns: Species, Hatchery/Facility, Brood Year, Related Group Id.
Example output listing:
32
RMIS -- User Guide
16:25:14 12/05/2011
REPORT: RS1
MAR 2012
Regional Mark Information System
RELATED GROUP RELEASES SUMMARY
RELATED GROUP: 072011Smolt
TYPE:DIT
HATCHERY: LTL WHITE SALMON NFH
SPECIES: Chinook
BR YEAR: 2010
PAGE 1
RUN:
AGENCY: FWS
RELATED_GROUP RELEASE_GRP
RL_YEAR
CWT_1ST_MK CWT_2ND_MK TT_ADCLIPPED TT_UNADCLIPPED
-------------- --------------------------- ---------- ------------ -------------072011Smolt
055069
2011
0000
0
98724
072011Smolt
054599
2011
5000
0000
96925
2403
072011Smolt
055070
2011
0000
0
99070
072011Smolt
055232
2011
5000
0000
96360
2199
------------------------------------------------------------------------------------------------072011Smolt
TOTALS and RATIO..................................
193285
202396
1.047
---------------------------------------------------------------------------------------------------------RELATED GROUP: 072011April
TYPE:DIT
HATCHERY: SPRING CR NFH
SPECIES: Chinook
BR YEAR: 2010
RUN: Fall
AGENCY: FWS
RELATED_GROUP RELEASE_GRP
RL_YEAR
CWT_1ST_MK CWT_2ND_MK TT_ADCLIPPED TT_UNADCLIPPED
-------------- --------------------------- ---------- ------------ -------------072011April
055405
2011
5000
203259
0
072011April
055406
2011
0000
0
202650
------------------------------------------------------------------------------------------------072011April
TOTALS and RATIO..................................
203259
202650
0.997
---------------------------------------------------------------------------------------------------------RELATED GROUP: 072011May
TYPE:DIT
HATCHERY: SPRING CR NFH
SPECIES: Chinook
BR YEAR: 2010
RUN: Fall
AGENCY: FWS
RELATED_GROUP RELEASE_GRP
RL_YEAR
CWT_1ST_MK CWT_2ND_MK TT_ADCLIPPED TT_UNADCLIPPED
-------------- --------------------------- ---------- ------------ -------------072011May
055365
2011
5000
199576
0
072011May
055398
2011
0000
0
199410
------------------------------------------------------------------------------------------------072011May
TOTALS and RATIO....................................
199576
199410
0.999
---------------------------------------------------------------------------------------------------------Notes:
1) This report is sorted by: 1) Species; 2) Hatchery; 3) Brood Year; 4) Related Group Id.
2) Related Group Ratio: Ratio = Total{CWT&UnAdclipped} / Total{CWT&Adclipped}
3) Numbers of ad-clipped fish may be inaccurate due to incomplete data collection &/or partial marking.
End of report
The query criteria used to produce this report was:
WHERE related_group_type IN ('D','O')
AND species = '1'
AND reporting_agency = 'FWS'
AND brood_year IN (2010,2011)
AND release_location_state = 'WA'
6.2 Recovery Reports
NOTE: If there is a very large number of recovery data rows (generally greater than about
150,000) selected by the query (see Figure 14) then some RMIS recovery reports may not
appear in the list of available reports. Some report formats are very long and have an upper
rowlimit for availability because the format is very large and could result in too much data to
send to a browser session for output. In this case, to obtain all data rows desired for your
33
RMIS -- User Guide
MAR 2012
output you can divide your query into multiple queries. For example, you could run one query
for Recovery Years 1976 to 1985, then run another query for Recovery Years 1986 to 1995, etc.
Recoveries-by-Tag-Code Reports
If you selected Query Form By Tag Code in the --Recoveries-- section of the RSR Navigation
Menu, then you may have up to twenty (20) report formats available to run:
• Tag Detail by Recovery Year, Fishery (TD1-Rec)
• Tag Detail by Run Year, Fishery (TD1-Run)
• Tag Detail by Recovery Year, Site Name (TD2-Rec)
• Tag Detail by Run Year, Site Name (TD2-Run)
• Tag Detail by Recovery Month, Site Name (TD3)
• Tag Detail by Recovery Year, Site Name (TD4-Rec)
• Tag Detail by Run Year, Site Name (TD4-Run)
• Tag Detail by Site, Statistical Week (TD5)
• Tag Raw Zero Filled (TR1)
• Tag Summary by Recovery Year, Fishery (TS1-Rec)
• Tag Summary by Run Year, Fishery (TS1-Run)
• Tag Summary by Month, Site Name (TS2)
• Tag Summary by Fortnt, Site Name (TS3)
• Tag Summary by Statwk, Site Name (TS4)
• Tag Estimation Analysis by Rec Year (TA1-Rec)
• Tag Estimation Analysis by Run Year (TA1-Run)
• Species Analysis; Smolt/Adult Ratio (SA1)
• PSC 4.1 Data Exchange format (PRC)
• Comma-Separated Values custom file (CSV)
• HTML custom table (HTM).
NOTE: regarding result values:
totals:
•
•
•
•
Most RSR Recovery reports give these numeric aggregate
OBS’D
: This is simply the number of observed fish recovered (rows in the Recoveries data table)
for the given aggregated criteria;
EST’D
: This is the total number of estimated recoveries (Estimated Number) for the given
aggregated criteria. It is rounded during summation to the nearest integer value;
MEAS’D
: This is the number of fish among those observed that were measured to determine the
average length;
AVG MM : This is the average length for the given aggregated criteria.
These reports are described and illustrated as follows:
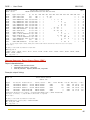
TAG DETAIL BY RECOVERY YEAR, FISHERY (TD1-REC)
Report characteristics:
•
•
•
tabular, fixed-field line format
aggregates by columns: Tag Code, Recovery Year, Reporting Agency, Fishery
sorts by columns: Tag Code, Recovery Year, Reporting Agency, Fishery.
Example output listing:
34
RMIS -- User Guide
MAR 2012
FORMAT: TAG DETAIL BY FISHERY (TD1) -- BY RECOVERY YEAR
TAGCODE
093640
093640
093640
093640
093640
093640
093640
093640
635824
635824
635824
End of report
YEAR
2004
2004
2004
2005
2005
2005
2005
2006
1997
1997
1998
AGCY
ADFG
ODFW
ODFW
ODFW
ODFW
ODFW
ODFW
ODFW
ODFW
WDFW
WDFW
FC OBS'D
25
1
46
2
52
1
44
1
46
1
50
5
52
3
50
3
44
3
50
4
50
4
EST'D MEAS'D AVG MM
0
1
578
2
2
597
1
1
620
4
1
690
1
1
584
5
4
580
4
3
665
3
3
703
6
1
770
4
4
688
4
4
733
The query criteria used to produce this report was:
WHERE tag_code IN ('093640','635824')
AND tag_status = '1'
TAG DETAIL BY RUN YEAR, FISHERY (TD1-RUN)
Report characteristics:
•
•
•
tabular, fixed-field line format
aggregates by columns: Tag Code, Run Year, Reporting Agency, Fishery
sorts by columns: Tag Code, Run Year, Reporting Agency, Fishery.
Example output listing:
FORMAT: TAG DETAIL BY FISHERY (TD1) -- BY RUN YEAR
TAGCODE
093640
093640
093640
093640
093640
093640
093640
635824
635824
635824
End of report
YEAR
2004
2004
2004
2004
2005
2005
2005
1997
1997
1998
AGCY
ADFG
ODFW
ODFW
ODFW
ODFW
ODFW
ODFW
ODFW
WDFW
WDFW
FC OBS'D
25
1
46
3
50
5
52
1
44
1
50
3
52
3
44
3
50
7
50
1
EST'D MEAS'D AVG MM
0
1
578
3
3
593
5
4
580
1
1
620
4
1
690
3
3
703
4
3
665
6
1
770
7
7
696
1
1
810
The query criteria used to produce this report was:
WHERE tag_code IN ('093640','635824')
AND tag_status = '1'
TAG DETAIL BY RECOVERY YEAR, SITE NAME (TD2-REC)
Report characteristics:
•
•
•
tabular, fixed-field line format
aggregates by columns: Tag Code, Recovery Year, Reporting Agency, Fishery, Recovery Site Name,
Brood Year
sorts by columns: Tag Code, Recovery Year, Reporting Agency, Fishery, Recovery Site Name, Brood
Year.
35
RMIS -- User Guide
MAR 2012
Example output listing:
FORMAT: TAG DETAIL BY RECOVERY SITE NAME (TD2) -- BY RECOVERY YEAR
TAGCODE
093640
093640
093640
093640
093640
093640
093640
093640
093640
093640
635824
635824
635824
635824
End of report
BRDYEAR
2002
2002
2002
2002
2002
2002
2002
2002
2002
2002
1994
1994
1994
1994
RECYEAR
2004
2004
2004
2004
2005
2005
2005
2005
2005
2006
1997
1997
1997
1998
AGCY
ADFG
ODFW
ODFW
ODFW
ODFW
ODFW
ODFW
ODFW
ODFW
ODFW
ODFW
ODFW
WDFW
WDFW
FC
25
46
46
52
44
46
50
50
52
50
44
44
50
50
SITE NAME
AK M 1 SW SASO
UMATILLA R SPORT SEC
UMATILLA R SPORT SEC
THREE MILE DAM (UMAT
COL R WA SEC 4
UMATILLA R SPORT SEC
CTUIR BROOD PONDS
MINTHORN PD (UMATILL
THREE MILE DAM (UMAT
MINTHORN PD (UMATILL
COL R OR SPORT SEC 8
COL R OR SPORT SEC 9
SKAMANIA HATCHERY
SKAMANIA HATCHERY
SITE CODE
1M1SWSASO
5F33428 R2801
5F33428 R2802
5F33427 H27
5F33203 R104
5F33428 R2801
5F33421 H21
5F33414 H14
5F33427 H27
5F33414 H14
5F33203 R208
5F33203 R209
3F42001 280200
3F42001 280200
27
27
24
12
27
22
22
24
22
12
12
H
H
OBS'D
1
1
1
1
1
1
3
2
3
3
1
2
4
4
EST'D MEAS'D AVG MM
0
1
578
1
1
584
1
1
610
1
1
620
4
1
690
1
1
584
3
2
595
2
2
566
4
3
665
3
3
703
6
4
4
1
4
4
770
688
733
The query criteria used to produce this report was:
WHERE tag_code IN ('093640','635824')
AND tag_status = '1'
TAG DETAIL BY RUN YEAR, SITE NAME (TD2-RUN)
Report characteristics:
•
•
•
tabular, fixed-field line format
aggregates by columns: Tag Code, Run Year, Reporting Agency, Fishery, Recovery Site Name, Brood
Year
sorts by columns: Tag Code, Run Year, Reporting Agency, Fishery, Recovery Site Name, Brood Year.
Example output listing:
FORMAT: TAG DETAIL BY RECOVERY SITE NAME (TD2) -- BY RUN YEAR
TAGCODE
093640
093640
093640
093640
093640
093640
093640
093640
093640
635824
635824
635824
635824
End of report
BRDYEAR
2002
2002
2002
2002
2002
2002
2002
2002
2002
1994
1994
1994
1994
RUNYEAR
2004
2004
2004
2004
2004
2004
2005
2005
2005
1997
1997
1997
1998
AGCY
ADFG
ODFW
ODFW
ODFW
ODFW
ODFW
ODFW
ODFW
ODFW
ODFW
ODFW
WDFW
WDFW
FC
25
46
46
50
50
52
44
50
52
44
44
50
50
SITE NAME
AK M 1 SW SASO
UMATILLA R SPORT SEC
UMATILLA R SPORT SEC
CTUIR BROOD PONDS
MINTHORN PD (UMATILL
THREE MILE DAM (UMAT
COL R WA SEC 4
MINTHORN PD (UMATILL
THREE MILE DAM (UMAT
COL R OR SPORT SEC 8
COL R OR SPORT SEC 9
SKAMANIA HATCHERY
SKAMANIA HATCHERY
SITE CODE
1M1SWSASO
5F33428 R2801
5F33428 R2802
5F33421 H21
5F33414 H14
5F33427 H27
5F33203 R104
5F33414 H14
5F33427 H27
5F33203 R208
5F33203 R209
3F42001 280200
3F42001 280200
27
27
22
22
24
12
22
24
12
12
H
H
OBS'D
1
2
1
3
2
1
1
3
3
1
2
7
1
EST'D MEAS'D AVG MM
0
1
578
2
2
584
1
1
610
3
2
595
2
2
566
1
1
620
4
1
690
3
3
703
4
3
665
6
7
1
1
7
1
770
696
810
The query criteria used to produce this report was:
WHERE tag_code IN ('093640','635824')
AND tag status = '1
36
RMIS -- User Guide
MAR 2012
TAG DETAIL BY RECOVERY MONTH, SITE NAME (TD3)
Report characteristics:
•
•
•
tabular, fixed-field line format
aggregates by columns: Tag Code, Recovery Year, Reporting Agency, Fishery, Recovery Site Name,
Recovery Month
sorts by columns: Tag Code, Recovery Year, Reporting Agency, Fishery, Recovery Site Name, Recovery
Month.
Example output listing:
FORMAT: TAG DETAIL BY RECOVERY SITE/CAL. MONTH (TD3)
TAGCODE
093640
093640
093640
093640
093640
093640
093640
093640
093640
093640
093640
093640
093640
093640
093640
635824
635824
635824
635824
635824
635824
End of report
YEAR
2004
2004
2004
2004
2005
2005
2005
2005
2005
2005
2005
2005
2006
2006
2006
1997
1997
1997
1998
1998
1998
AGCY
ADFG
ODFW
ODFW
ODFW
ODFW
ODFW
ODFW
ODFW
ODFW
ODFW
ODFW
ODFW
ODFW
ODFW
ODFW
ODFW
ODFW
WDFW
WDFW
WDFW
WDFW
FC
25
46
46
52
44
46
50
50
50
52
52
52
50
50
50
44
44
50
50
50
50
SITE NAME
AK M 1 SW SASO
UMATILLA R SPORT SEC
UMATILLA R SPORT SEC
THREE MILE DAM (UMAT
COL R WA SEC 4
UMATILLA R SPORT SEC
CTUIR BROOD PONDS
MINTHORN PD (UMATILL
MINTHORN PD (UMATILL
THREE MILE DAM (UMAT
THREE MILE DAM (UMAT
THREE MILE DAM (UMAT
MINTHORN PD (UMATILL
MINTHORN PD (UMATILL
MINTHORN PD (UMATILL
COL R OR SPORT SEC 8
COL R OR SPORT SEC 9
SKAMANIA HATCHERY
SKAMANIA HATCHERY
SKAMANIA HATCHERY
SKAMANIA HATCHERY
SITE CODE
1M1SWSASO
5F33428 R2801
5F33428 R2802
5F33427 H27
5F33203 R104
5F33428 R2801
5F33421 H21
5F33414 H14
5F33414 H14
5F33427 H27
5F33427 H27
5F33427 H27
5F33414 H14
5F33414 H14
5F33414 H14
5F33203 R208
5F33203 R209
3F42001 280200
3F42001 280200
3F42001 280200
3F42001 280200
27
27
24
12
27
22
22
22
24
24
24
22
22
22
12
12
H
H
H
H
MO OBS'D
08
1
12
1
10
1
12
1
08
1
03
1
03
3
04
1
05
1
09
1
10
1
11
1
03
1
04
1
05
1
06
1
06
2
12
4
01
1
02
2
12
1
EST'D MEAS'D AVG MM
0
1
578
1
1
584
1
1
610
1
1
620
4
1
690
1
1
584
3
2
595
1
1
606
1
1
525
1
1
610
1
1
735
1
1
650
1
1
670
1
1
734
1
1
704
6
4
1
2
1
1
4
1
2
1
770
688
680
720
810
The query criteria used to produce this report was:
WHERE tag_code IN ('093640','635824')
AND tag_status = '1'
TAG DETAIL BY RECOVERY YEAR, SITE NAME (TD4-REC)
Report characteristics:
•
•
•
tabular, fixed-field line format
aggregates by columns: Tag Code, Recovery Year, Reporting Agency, Fishery, Recovery Site Name
sorts by columns: Tag Code, Recovery Year, Reporting Agency, Fishery, Recovery Site Name.
Example output listing:
37
RMIS -- User Guide
MAR 2012
FORMAT: TAG DETAIL BY SITE SHORT NAME (TD4) -- BY RECOVERY YEAR
TAGCODE
093640
093640
093640
093640
093640
093640
093640
093640
093640
093640
635824
635824
635824
635824
End of report
YEAR
2004
2004
2004
2004
2005
2005
2005
2005
2005
2006
1997
1997
1997
1998
AGCY
ADFG
ODFW
ODFW
ODFW
ODFW
ODFW
ODFW
ODFW
ODFW
ODFW
ODFW
ODFW
WDFW
WDFW
FC
25
46
46
52
44
46
50
50
52
50
44
44
50
50
SITE NAME
OBS'D
AK M 1 SW SASO
1
UMATILLA R SPORT SEC
1
UMATILLA R SPORT SEC
1
THREE MILE DAM (UMAT
1
COL R WA SEC 4
1
UMATILLA R SPORT SEC
1
CTUIR BROOD PONDS
3
MINTHORN PD (UMATILL
2
THREE MILE DAM (UMAT
3
MINTHORN PD (UMATILL
3
COL R OR SPORT SEC 8
1
COL R OR SPORT SEC 9
2
SKAMANIA HATCHERY
4
SKAMANIA HATCHERY
4
EST'D MEAS'D AVG MM
0
1
578
1
1
584
1
1
610
1
1
620
4
1
690
1
1
584
3
2
595
2
2
566
4
3
665
3
3
703
6
4
4
1
4
4
770
688
733
The query criteria used to produce this report was:
WHERE tag_code IN ('093640','635824')
AND tag status = '1'
TAG DETAIL BY RUN YEAR, SITE NAME (TD4-RUN)
Report characteristics:
•
•
•
tabular, fixed-field line format
aggregates by columns: Tag Code, Run Year, Reporting Agency, Fishery, Recovery Site Name
sorts by columns: Tag Code, Run Year, Reporting Agency, Fishery, Recovery Site Name.
Example output listing:
FORMAT: TAG DETAIL BY SITE SHORT NAME (TD4) -- BY RUN YEAR
TAGCODE
093640
093640
093640
093640
093640
093640
093640
093640
093640
635824
635824
635824
635824
End of report
YEAR
2004
2004
2004
2004
2004
2004
2005
2005
2005
1997
1997
1997
1998
AGCY
ADFG
ODFW
ODFW
ODFW
ODFW
ODFW
ODFW
ODFW
ODFW
ODFW
ODFW
WDFW
WDFW
FC
25
46
46
50
50
52
44
50
52
44
44
50
50
SITE NAME
OBS'D
AK M 1 SW SASO
1
UMATILLA R SPORT SEC
2
UMATILLA R SPORT SEC
1
CTUIR BROOD PONDS
3
MINTHORN PD (UMATILL
2
THREE MILE DAM (UMAT
1
COL R WA SEC 4
1
MINTHORN PD (UMATILL
3
THREE MILE DAM (UMAT
3
COL R OR SPORT SEC 8
1
COL R OR SPORT SEC 9
2
SKAMANIA HATCHERY
7
SKAMANIA HATCHERY
1
EST'D MEAS'D AVG MM
0
1
578
2
2
584
1
1
610
3
2
595
2
2
566
1
1
620
4
1
690
3
3
703
4
3
665
6
7
1
1
7
1
770
696
810
The query criteria used to produce this report was:
WHERE tag_code IN ('093640','635824')
AND tag_status = '1'
TAG DETAIL BY SITE, STATISTICAL WEEK (TD5)
Report characteristics:
38
RMIS -- User Guide
•
•
•
MAR 2012
tabular, fixed-field line format
aggregates by columns: Tag Code, Recovery Year, Reporting Agency, Fishery, Recovery Site Name,
Recovery Week
sorts by columns: Tag Code, Recovery Year, Reporting Agency, Fishery, Recovery Site Name, Recovery
Week.
Example output listing:
FORMAT: TAG DETAIL BY SITE SHORT NAME/STAT. WEEK (TD5)
TAGCODE
YEAR
093640
2004
093640
2004
093640
2004
093640
2004
093640
2005
093640
2005
093640
2005
093640
2005
093640
2005
093640
2005
093640
2005
093640
2005
093640
2006
093640
2006
093640
2006
635824
1997
635824
1997
635824
1997
635824
1997
635824
1997
635824
1997
635824
1998
635824
1998
635824
1998
End of report
AGCY
ADFG
ODFW
ODFW
ODFW
ODFW
ODFW
ODFW
ODFW
ODFW
ODFW
ODFW
ODFW
ODFW
ODFW
ODFW
ODFW
ODFW
WDFW
WDFW
WDFW
WDFW
WDFW
WDFW
WDFW
FC
25
46
46
52
44
46
50
50
50
52
52
52
50
50
50
44
44
50
50
50
50
50
50
50
SITE NAME
AK M 1 SW SASO
UMATILLA R SPORT SEC
UMATILLA R SPORT SEC
THREE MILE DAM (UMAT
COL R WA SEC 4
UMATILLA R SPORT SEC
CTUIR BROOD PONDS
MINTHORN PD (UMATILL
MINTHORN PD (UMATILL
THREE MILE DAM (UMAT
THREE MILE DAM (UMAT
THREE MILE DAM (UMAT
MINTHORN PD (UMATILL
MINTHORN PD (UMATILL
MINTHORN PD (UMATILL
COL R OR SPORT SEC 8
COL R OR SPORT SEC 9
SKAMANIA HATCHERY
SKAMANIA HATCHERY
SKAMANIA HATCHERY
SKAMANIA HATCHERY
SKAMANIA HATCHERY
SKAMANIA HATCHERY
SKAMANIA HATCHERY
WK OBS'D EST'D MEAS'D AVG MM
33
1
0
1
578
1
1
1
1
584
44
1
1
1
610
51
1
1
1
620
32
1
4
1
690
10
1
1
1
584
12
3
3
2
595
16
1
1
1
606
19
1
1
1
525
38
1
1
1
610
43
1
1
1
735
45
1
1
1
650
14
1
1
1
670
16
1
1
1
734
19
1
1
1
704
25
1
25
2
6
1
770
49
1
1
1
710
50
1
1
1
700
52
1
1
1
660
53
1
1
1
680
2
1
1
1
680
6
2
2
2
720
52
1
1
1
810
The query criteria used to produce this report was:
WHERE tag_code IN ('093640','635824')
AND tag_status = '1'
TAG RAW ZERO FILLED (TR1)
Report characteristics:
•
•
•
tabular, fixed-field line, zero-filled format
does not break down or aggregate data results
sorts by columns: Tag Code, Reporting Agency, Fishery, Recovery Date.
Example output listing:
39
RMIS -- User Guide
212255
Coho
212255
Coho
212255
Coho
212255
Coho
212255
Coho
232244
Chin
232244
Chin
232244
Chin
End of report
MAR 2012
86
86
86
86
86
86
86
86
890715
890805
891009
890723
890716
900815
910814
910522
CDFO
CDFO
QDNR
WDFW
WDFW
FWS
FWS
WDFW
10
10
22
40
42
50
50
46
2MS02024
2MS01027
3F21703
3M32202
3M32202
3F42001
3F42001
3F42001
000
069
210016 R
450474 H
450474 H
450474 R
6.43
5.56
2.08
0.00
0.00
1.00
1.00
3.13
600
652
0
0
0
760
930
0
The query criteria used to produce this report was:
WHERE tag_code IN ('232244','212255')
AND tag_status = '1'
TAG SUMMARY BY RECOVERY YEAR, FISHERY (TS1-REC)
Report characteristics:
•
•
•
summarized, aggregated master-detail format showing release information in header section
aggregates by columns: Tag Code, Recovery Year, Reporting Agency
sorts by columns: Tag Code, Recovery Year, Fishery, Reporting Agency.
Example output listing:
11:42:38 12/21/2011
REPORT: TS1-Rec
Regional Mark Information System
ANNUAL RECOVERIES BY REC YEAR
TAGCODE:
090137
RELEASE AGENCY: ODFW
2008 Summer
Steelhead #CWT:
RELEASED: 4/29/2009
LOSS RATE:
LENGTH:
#NON-CWT:
18472
.109
36037
STUDY TYPE: P
HATCHERY: UMATILLA HATCHERY
SITE: BOSTON CANYON CR (UM
STOCK: UMATILLA R
YEAR FISHERY - Recovery Agency ................. OBS'D
2010 Columbia River Sport
Fish Trap (freshwater)
PAGE 1
- ODFW
- ODFW
EST'D MEAS'D AVG MM
1
5
5
5
1
5
570
570
6
10
6
570
3
3
3
585
2011 TOTALS:
3
3
3
585
TOTALS FOR TAGCODE 090137
End of report
9
13
9
575
2010 TOTALS:
2011 Fish Trap (freshwater)
- ODFW
The query criteria used to produce this report was:
WHERE tag_code = '090137'
AND tag_status = '1'
TAG SUMMARY BY RUN YEAR, FISHERY (TS1-RUN)
Report characteristics:
•
•
•
summarized, aggregated master-detail format showing release information in header section
aggregates by columns: Tag Code, Run Year, Reporting Agency
sorts by columns: Tag Code, Run Year, Fishery, Reporting Agency.
Example output listing:
40
RMIS -- User Guide
11:42:54 12/21/2011
REPORT: TS1-Run
MAR 2012
Regional Mark Information System
ANNUAL RECOVERIES BY RUN YEAR
TAGCODE:
090137
RELEASE AGENCY: ODFW
2008 Summer
Steelhead #CWT:
RELEASED: 4/29/2009
LOSS RATE:
LENGTH:
#NON-CWT:
18472
.109
36037
STUDY TYPE: P
HATCHERY: UMATILLA HATCHERY
SITE: BOSTON CANYON CR (UM
STOCK: UMATILLA R
YEAR FISHERY - Recovery Agency ................. OBS'D
2010 Columbia River Sport
Fish Trap (freshwater)
PAGE 1
- ODFW
- ODFW
EST'D MEAS'D AVG MM
1
8
5
8
1
8
570
575
2010 TOTALS:
9
13
9
575
TOTALS FOR TAGCODE 090137
End of report
9
13
9
575
The query criteria used to produce this report was:
WHERE tag_code = '090137'
AND tag status = '1'
TAG SUMMARY BY MONTH, SITE NAME (TS2)
Report characteristics:
•
•
•
summarized, aggregated master-detail format showing release information in header section
aggregates by columns: Tag Code, Recovery Year, Reporting Agency, Recovery Site Name
sorts by columns: Tag Code, Recovery Year, Fishery, Reporting Agency, Recovery Site Name.
Example output listing:
41
RMIS -- User Guide
MAR 2012
14:34:21 12/21/2011
REPORT: TS2
Regional Mark Information System
2010 RECOVERIES OF TAGCODE
062589
BY CALENDAR MONTH
2008 Hybrid
Chinook
LENGTH:
RELEASE AGENCY: CDFG
#CWT:
13010
HATCHERY: FEATHER R HATCHERY
RELEASED: 10/31/2009
LOSS RATE:
.025
SITE: TIBURON NET PENS
STUDY TYPE: E
#NON-CWT:
668
STOCK: FEATHER R HATCHERY
FISHERY AREA....... DATA
Hatchery
FEATHER R HATCHERY OBS
EST
#LM
MM
FISHERY TOTALS: OBS
EST
#LM
MM
Hatchery
COLEMAN NFH
OBS
EST
#LM
MM
FISHERY TOTALS: OBS
EST
#LM
MM
Ocean Sport
FORT ROSS-PIGEON PT OBS
EST
#LM
MM
FISHERY TOTALS: OBS
EST
#LM
MM
TOTALS FOR 2010
OBS
EST
#LM
MM
End of report
JAN
FEB MAR
- CDFG
APR
MAY
JUN
JUL
AUG
NOV
PAGE 1
SEP
OCT
DEC
UNK TOTAL
1
1
1
541
1
1
1
541
7
7
7
546
7
7
7
546
8
8
8
545
8
8
8
545
3
3
3
556
3
3
3
556
3
3
3
556
3
3
3
556
10
10
10
549
1
5
1
592
1
5
1
592
12
16
12
552
- FWS
- CDFG
1
5
1
592
1
5
1
592
1
5
1
592
1
1
1
541
The query criteria used to produce this report was:
WHERE tag_code = '062589'
AND tag_status = '1'
TAG SUMMARY BY FORTNT, SITE NAME (TS3)
Report characteristics:
•
•
•
summarized, aggregated master-detail format showing release information in header section
aggregates by columns: Tag Code, Recovery Year, Reporting Agency, Recovery Site Name
sorts by columns: Tag Code, Recovery Year, Fishery, Reporting Agency, Recovery Site Name.
Example output listing:
42
RMIS -- User Guide
MAR 2012
14:37:47 12/21/2011
REPORT: TS3
2008 Hybrid
Chinook
RELEASE AGENCY: CDFG
#CWT:
RELEASED: 10/31/2009
LOSS RATE:
STUDY TYPE: E
#NON-CWT:
FISHERY/AREA
WEEK NUMBER: 2 4 6
Hatchery
FEATHER R HATCHERY
OBS
EST
#LM
MM
FISHERY TOTALS:
OBS
EST
#LM
MM
Hatchery
COLEMAN NFH
OBS
EST
#LM
MM
FISHERY TOTALS:
OBS
EST
#LM
MM
Ocean Sport
FORT ROSS-PIGEON PT
OBS
EST
#LM
MM
FISHERY TOTALS:
OBS
EST
#LM
MM
TOTALS FOR 2010
OBS
EST
#LM
MM
End of report
13010
.025
668
Regional Mark Information System
2010 RECOVERIES OF TAGCODE
062589
BY STATISTICAL FORTNIGHT
LENGTH:
HATCHERY: FEATHER R HATCHERY
SITE: TIBURON NET PENS
STOCK: FEATHER R HATCHERY
PAGE 1
8 10 12 14 16 18 20 22 24 26 28 30 32 34 36 38 40 42 44 46 48 50 52 54
- CDFG
UNK TOTAL
2 6
2 6
2 6
556 542
8
8
8
545
2 6
2 6
2 6
556 542
8
8
8
545
3
3
3
556
3
3
3
556
3
3
3
556
3
3
3
556
- FWS
- CDFG
1
5
1
592
1
5
1
592
1
5
1
592
1
5
1
592
1
5
1
592
2
9
2 9
2 9
556 546
12
16
12
552
The query criteria used to produce this report was:
WHERE tag_code = '062589'
AND tag_status = '1'
TAG SUMMARY BY STATWK, SITE NAME (TS4)
Report characteristics:
•
summarized, aggregated master-detail format showing release information in header section
43
RMIS -- User Guide
•
•
MAR 2012
aggregates by columns: Tag Code, Recovery Year, Reporting Agency, Recovery Site Name
sorts by columns: Tag Code, Recovery Year, Fishery, Reporting Agency, Recovery Site Name.
Example output listing:
14:56:05 12/21/2011
REPORT: TS4
2008 Spring
Chinook
RELEASE AGENCY: WDFW
#CWT:
RELEASED: 4/10/2010
LOSS RATE:
STUDY TYPE:
#NON-CWT:
48447
.02
1153
Regional Mark Information System
2010 RECOVERIES OF TAGCODE
210849
BY STATISTICAL WEEK
LENGTH:
HATCHERY: DUNGENESS HATCHERY
SITE: DUNGENESS R 18.0018
STOCK: DUNGENESS R 18.0018
FISHERY/AREA
Spawning Ground
- WDFW
DUNGENESS R 18.0018
WEEK 1 2 3 4 5 6 7 8 9 10 11 12 13 14
OBS
EST
#LM
MM
WEEK 28 29 30 31 32 33 34 35 36 37 38 39 40 41
OBS
1
2 1 1
EST
3
6 3 3
#LM
2 1 1
MM
355 370 360
FISHERY TOTALS:
WEEK 1 2 3 4 5 6 7 8 9 10 11 12 13 14
OBS
EST
#LM
MM
WEEK 28 29 30 31 32 33 34 35 36 37 38 39 40 41
OBS
1
2 1 1
EST
3
6 3 3
#LM
2 1 1
MM
355 370 360
TOTALS FOR 2010
WEEK 1 2 3 4 5 6 7 8 9 10 11 12 13 14
OBS
EST
#LM
MM
WEEK 28 29 30 31 32 33 34 35 36 37 38 39 40 41
OBS
1
2 1 1
EST
3
6 3 3
#LM
2 1 1
MM
355 370 360
End of report
PAGE 1
15 16 17 18 19 20 21 22 23 24 25 26 27
42 43 44 45 46 47 48 49 50 51 52 53 54 UNK
TOTAL
5
14
4
360
15 16 17 18 19 20 21 22 23 24 25 26 27
42 43 44 45 46 47 48 49 50 51 52 53 54 UNK
TOTAL
5
14
4
360
15 16 17 18 19 20 21 22 23 24 25 26 27
42 43 44 45 46 47 48 49 50 51 52 53 54 UNK
TOTAL
5
14
4
360
The query criteria used to produce this report was:
WHERE tag_code = '210849'
AND tag_status = '1'
TAG ESTIMATION ANALYSIS BY REC YEAR (TA1-REC)
Report characteristics:
•
summarized, aggregated by columns: Tag Code, Recovery Year
44
RMIS -- User Guide
•
MAR 2012
sorts by columns: Tag Code, Recovery Year.
Example output listing:
15:41:07 12/21/2011
REPORT: TA1-Rec
Regional Mark Information System
TAGCODE ESTIMATION ANALYSIS BY RECOVERY YEAR (2001-2008)
Tagcode
Tagged Hatchery Name
Sp Run BrYr 1999 2000 2001 2002 2003
050190
24096 EAGLE CR NFH
Coho
1999 **
**
20 436
050191
22577 EAGLE CR NFH
Coho
1999 **
**
2 831
050195
23799 DWORSHAK NAT. HATCH Stee Summ 2001 **
**
1
2
050199
22517 DWORSHAK NAT. HATCH Stee Summ 2001 **
**
1
050264
21966 DWORSHAK NAT. HATCH Stee Summ 2003 **
**
050265
21331 DWORSHAK NAT. HATCH Stee Summ 2002 **
**
050266
22430 DWORSHAK NAT. HATCH Stee Summ 2002 **
**
050489
55845 DWORSHAK NAT. HATCH Chin Spri 2000 **
**
32
050575
29885 WARM SPRINGS NFH
Chin Spri 2000 **
**
7
71
050777
68627 SPRING CR NFH
Chin Fall 2001 **
**
49
050799
65864 KOOSKIA NAT
Chin Spri 2001 **
**
051170
38022 LTL WHITE SALMON NFH Chin Spri 2002 **
**
051171
144186 SPRING CR NFH
Chin Hybr 2002 **
**
051181
73062 LTL WHITE SALMON NFH Chin Spri 2002 **
**
051184
67174 DWORSHAK NAT. HATCH Chin Spri 2002 **
**
051468
42649 WILLARD NFH
Coho
2002 **
**
051477
22990 WARM SPRINGS NFH
Chin Spri 2002 **
**
**: In this 12-year report format, these year columns either have no recoveries or
End of report
2004 2005 2006 2007 2008 2009 2010
**
**
**
**
11
29
**
**
4
41
**
**
8
59
**
**
31
23
**
**
9
21
14
**
**
224
4
**
**
177
2
**
**
404 103
5
**
**
4
30
**
**
4
22
5
**
**
81 360
38
**
**
1
7 299
68
**
**
8 112
31
7 **
**
34
**
**
8 129
15
**
**
were left out of this query.
PAGE 1
TT
456
833
43
46
67
54
44
261
256
561
34
31
479
374
159
34
152
The query criteria used to produce this report was:
WHERE tag_code IN
('050575','050777','050799','051170','051171','051181','051184','051468','051477','050190','050191','050195','050199','050264',
'050265','050266','050489')
AND tag status = '1'
TAG ESTIMATION ANALYSIS BY RUN YEAR (TA1-RUN)
Report characteristics:
•
•
summarized, aggregated by columns: Tag Code, Run Year
sorts by columns: Tag Code, Run Year.
Example output listing:
45
RMIS -- User Guide
15:41:24 12/21/2011
REPORT: TA1-Run
MAR 2012
Regional Mark Information System
TAGCODE ESTIMATION ANALYSIS BY RUN YEAR (2001-2008)
Tagcode
Tagged Hatchery Name
Sp Run BrYr 1999 2000 2001 2002 2003
050190
24096 EAGLE CR NFH
Coho
1999 **
**
20 436
050191
22577 EAGLE CR NFH
Coho
1999 **
**
2 831
050195
23799 DWORSHAK NAT. HATCH Stee Summ 2001 **
**
1
2
050199
22517 DWORSHAK NAT. HATCH Stee Summ 2001 **
**
1
050264
21966 DWORSHAK NAT. HATCH Stee Summ 2003 **
**
050265
21331 DWORSHAK NAT. HATCH Stee Summ 2002 **
**
050266
22430 DWORSHAK NAT. HATCH Stee Summ 2002 **
**
050489
55845 DWORSHAK NAT. HATCH Chin Spri 2000 **
**
32
050575
29885 WARM SPRINGS NFH
Chin Spri 2000 **
**
7
71
050777
68627 SPRING CR NFH
Chin Fall 2001 **
**
49
050799
65864 KOOSKIA NAT
Chin Spri 2001 **
**
051170
38022 LTL WHITE SALMON NFH Chin Spri 2002 **
**
051171
144186 SPRING CR NFH
Chin Hybr 2002 **
**
051181
73062 LTL WHITE SALMON NFH Chin Spri 2002 **
**
051184
67174 DWORSHAK NAT. HATCH Chin Spri 2002 **
**
051468
42649 WILLARD NFH
Coho
2002 **
**
051477
22990 WARM SPRINGS NFH
Chin Spri 2002 **
**
**: In this 12-year report format, these year columns either have no recoveries or
End of report
PAGE 1
2004 2005 2006 2007 2008 2009 2010
**
**
**
**
11
29
**
**
4
41
**
**
7
60
**
**
32
22
**
**
9
21
14
**
**
224
4
**
**
177
2
**
**
404 103
5
**
**
4
30
**
**
4
22
5
**
**
81 360
38
**
**
1
7 299
68
**
**
8 112
37
1 **
**
34
**
**
8 129
15
**
**
were left out of this query.
TT
456
833
43
46
67
54
44
261
256
561
34
31
479
374
159
34
152
The query criteria used to produce this report was:
WHERE tag_code IN
('050575','050777','050799','051170','051171','051181','051184','051468','051477','050190','050191','050195','050199','050264',
'050265','050266','050489')
AND tag_status = '1'
SPECIES ANALYSIS; SMOLT/ADULT RATIO (SA1)
Report characteristics:
•
•
•
tabular, fixed-field line format
aggregates by column: Tag Code
sorts by columns: Species, Brood Year, Tag Code.
Example output listing:
09:55:42 12/30/2011
REPORT: SA1
Regional Mark Information System
SPECIES SURVIVAL ANALYSIS
SPECIES: Coho
PAGE 1
Tagcode
BrYr Date Rel Release Location.... Hatchery Location... #CWT.... LossRt #Non-CWT. Total Rel #Obs. #Est.... % Surv
631084
2000 20020415 NASELLE R
24.0543 NASELLE HATCHERY
23986
267
24253
246 936.73 3.91
631085
2000 20020415 NASELLE R
24.0543 NASELLE HATCHERY
24429
197
24626
274 1087.94
4.45
631086
2000 20020415 NASELLE R
24.0543 NASELLE HATCHERY
24790
454
25244
242 904.81 3.65
631195
2000 200204
NAHCOTTA NET PENS
NASELLE HATCHERY
20829
0
20829
131 447.61
2.15
631196
2000 200204
NAHCOTTA NET PENS
NASELLE HATCHERY
20059
0
20059
120 411.67 2.05
Release Group Percent Survival: (%.Surv) = (Total{Estimated.Number})(100) / (Number.Released.CWT)
This report is sorted by: 1) Species Name; 2) Brood Year; 3) Tag Code.
End of report
The query criteria used to produce this report was:
WHERE UPPER(hatchery_location_name) = 'NASELLE HATCHERY'
AND brood_year = 2000
AND tag_status = '1'
46
RMIS -- User Guide
MAR 2012
PSC 4.1 DATA EXCHANGE FORMAT (PRC)
This report is a fixed raw data listing of columns that correspond exactly to the Pacific Salmon
Commission data exchange format for Recovery data. See "PSC Format Specification"
document, Ch. 3 (referenced in §1.1 ).
Example output listing:
record_code,format_version,submission_date,reporting_agency,sampling_agency,recovery_id,species,run_year,recovery_date,recovery_d
ate_type,period_type,period,fishery,gear,adclip_selective_fishery,estimation_level,recovery_location_code,sampling_site,recorded_
mark,sex,weight,weight_code,weight_type,length,length_code,length_type,detection_method,tag_status,tag_code,tag_type,sequential_n
umber,sequential_column_number,sequential_row_number,catch_sample_id,sample_type,sampled_maturity,sampled_run,sampled_length_rang
e,sampled_sex,sampled_mark,estimated_number
"R","4.1","20111227","NMFS","NMFS","1995091145","1","1995","19950122","R","1","01","88","74","N",,"7M
N","HSEA","5000","F",
".6","1","1","290","0","1","V","1","312311","0",,,,,"3","4",,,,,
"R","4.1","20111227","NMFS","NMFS","1995091144","1","1995","19950122","R","1","01","88","74","N",,"7M
N","HSEA","5000","F",
"1.6","1","1","460","0","1","V","1","043919","0",,,,,"3","4",,,,,
"R","4.1","20111227","NMFS","NMFS","1995091129","1","1995","19950122","R","1","01","88","74","N",,"7M
N","HSEA","5000","F",
"2.9","1","1","580","0","1","V","1","043929","0",,,,,"3","4",,,,,
"R","4.1","20111227","NMFS","NMFS","1995091130","1","1995","19950125","R","1","01","88","74","N",,"7M
N","HSEA","5000","M",
"2.4","1","1","540","0","1","V","1","044033","0",,,,,"3","4",,,,,
End of report
The query criteria used to produce this report was:
WHERE tag_status = '1'
AND recovery_date_year = 1995
AND fishery = '88'
COMMA-SEPARATED VALUES CUSTOM FILE (CSV)
NOTE: This report requires that you choose your own list of --Recoveries—columns (see Figure
16).
To see a description and an example listing of this report format, see the Release Reports
section above (§ 6.1 ).
HTML CUSTOM TABLE (HTM)
NOTE: This report requires that you choose your own list of --Recoveries—columns (see Figure
16).
To see a description and an example listing of this report format, see the Release Reports
section above (§ 6.1 ).
Recoveries-by-Release-Hatchery Reports
If you selected Query Form ‘By Release Hatchery’ in the --Recoveries-- section of the RSR
Navigation Menu, then you may have up to nine (9) report formats available to run:
• Species Analysis; Smolt/Adult Ratio (SA1)
• Annual Rec by Recovery Year, Fishery (HS1-Rec)
47
RMIS -- User Guide
•
•
•
•
•
•
•
MAR 2012
Annual Rec by Run Year, Fishery (HS1-Run)
Estimated Recoveries by Calendar Month (HS2)
Annual Recoveries by Recovery Year (HS4)
Recovery Estimation Analysis by Year (HA2)
PSC 4.1 Data Exchange format (PRC)
Comma-Separated Values custom file (CSV)
HTML custom table (HTM).
The SA1, PRC, CSV, and HTM reports are described in the above section. The other reports are
described and illustrated as follows:
ANNUAL REC BY RECOVERY YEAR, FISHERY (HS1-REC)
Report characteristics:
•
•
•
summarized, aggregated master-detail format showing release information in header section
aggregates by columns: Recovery Year, Reporting Agency
sorts by columns: Hatchery Location Name, Stock Location Name, Species, Run, Recovery Year, Fishery,
Reporting Agency.
Example output listing:
10:23:54 12/30/2011
REPORT: HS1-Rec
Regional Mark Information System
PAGE 1
ANNUAL RECOVERIES BY REC YEAR
HATCHERY: OAK SPRINGS HATCHERY SPECIES: Steelhead
STOCK: UMATILLA R
RUN: Summ
YEAR FISHERY - Recovery Agency ................. OBS'D
1991 Columbia River Gillnet
Columbia River Sport
Fish Trap (freshwater)
Freshwater Sport
Hatchery
Hatchery
-
ODFW
ODFW
ODFW
ODFW
FWS
ODFW
1991 TOTALS:
1992 Columbia River Gillnet
Columbia River Sport
Fish Trap (freshwater)
Freshwater Sport
Freshwater Sport
Hatchery
-
ODFW
ODFW
ODFW
ODFW
WDFW
ODFW
1992 TOTALS:
End of report
EST'D MEAS'D AVG MM
14
3
73
9
1
88
30
32
74
3
1
88
14
2
73
9
1
88
587
575
641
593
750
616
188
228
187
623
39
3
48
7
7
73
98
14
69
15
86
82
39
2
48
7
7
73
634
600
610
582
700
633
177
363
176
627
The query criteria used to produce this report was:
WHERE UPPER(hatchery_location_name) = 'OAK SPRINGS HATCHERY'
AND recovery_date_year IN (1991,1992)
AND tag_status = '1'
ANNUAL REC BY RUN YEAR, FISHERY (HS1-RUN)
Report characteristics:
•
summarized, aggregated master-detail format showing release information in header section
48
RMIS -- User Guide
•
•
MAR 2012
aggregates by columns: Run Year, Reporting Agency
sorts by columns: Hatchery Location Name, Stock Location Name, Species, Run, Run Year, Fishery,
Reporting Agency.
Example output listing:
10:24:17 12/30/2011
REPORT: HS1-Run
Regional Mark Information System
PAGE 1
ANNUAL RECOVERIES BY RUN YEAR
HATCHERY: OAK SPRINGS HATCHERY SPECIES: Steelhead
STOCK: UMATILLA R
RUN: Summ
YEAR FISHERY - Recovery Agency ................. OBS'D
1990 Fish Trap (freshwater)
- ODFW
1990 TOTALS:
1991 Columbia River Gillnet
Columbia River Sport
Fish Trap (freshwater)
Freshwater Sport
Hatchery
Hatchery
-
ODFW
ODFW
ODFW
ODFW
FWS
ODFW
1991 TOTALS:
1992 Columbia River Gillnet
Columbia River Sport
Fish Trap (freshwater)
Freshwater Sport
Freshwater Sport
Hatchery
1992 TOTALS:
End of report
-
ODFW
ODFW
ODFW
ODFW
WDFW
ODFW
EST'D MEAS'D AVG MM
28
28
28
716
28
28
28
716
14
3
84
9
1
88
30
32
86
3
1
88
14
2
84
9
1
88
587
575
603
593
750
616
199
240
198
608
39
3
9
7
7
73
98
14
29
15
86
82
39
2
9
7
7
73
634
600
599
582
700
633
138
323
137
631
The query criteria used to produce this report was:
WHERE UPPER(hatchery_location_name) = 'OAK SPRINGS HATCHERY'
AND recovery_date_year IN (1991,1992)
AND tag_status = '1'
ESTIMATED RECOVERIES BY CALENDAR MONTH (HS2)
Report characteristics:
•
•
•
summarized, aggregated master-detail format showing release information in header section
aggregates by columns: Recovery Year, Reporting Agency, Recovery Site Name
sorts by columns: Hatchery Location Name, Stock Location Name, Species, Run, Recovery Year, Fishery,
Reporting Agency, Recovery Site Name.
Example output listing:
49
RMIS -- User Guide
MAR 2012
11:26:25 12/30/2011
Regional Mark Information System
PAGE 1
REPORT: HS2
1986 ESTIMATED RECOVERIES (CALENDAR MONTH)
HATCHERY: H-Deer Bay Seapen
SPECIES: Chum
STOCK: S-Pallant Cr
RUN: Fall
FISHERY/AREA....... JAN FEB MAR APR MAY JUN JUL AUG SEP OCT NOV DEC UNK TOTAL
------------------------------------------------------------------------------1986
------------------------------------------------------------------------------Commercial Seine
- ADFG
AK M 1 SW SASO
4
4
FISHERY TOTALS:
4
4
Hatchery
- CDFO
H-PALLANT CR
165 165
FISHERY TOTALS:
165 165
Mixed Net and Seine
- CDFO
NN
02E-000
9 43
51
NN
02E-120
6
6
NN
02E-186
5
5
NN
02E-187
3
3
FISHERY TOTALS:
18 48
66
TOTALS FOR 1986
4 18 48
165 235
------------------------------------------------------------------------------1987
------------------------------------------------------------------------------Commercial Seine
- ADFG
AK M 1 SW SASO
4
4
FISHERY TOTALS:
4
4
Mixed Net and Seine
- CDFO
NN
02E-000
6 148
154
NN
02E-120
102 23
125
FISHERY TOTALS:
108 171
279
Ocean Gillnet (non-treaty)
- ADFG
AK M 1 SE 101-11
2
2
FISHERY TOTALS:
2
2
Spawning Ground
- CDFO
R-PALLANT CR
316 316
FISHERY TOTALS:
316 316
TOTALS FOR 1987
2 4 108 171
316 601
End of report
The query criteria used to produce this report was:
WHERE UPPER(hatchery_location_name) = 'H-DEER BAY SEAPEN'
AND recovery_date_year IN (1986,1987)
AND species = '5'
AND tag status = '1'
ANNUAL RECOVERIES BY RECOVERY YEAR (HS4)
Report characteristics:
•
•
•
summarized, aggregated master-detail format showing release information in header section
aggregates by columns: Tag Code, Recovery Year, Reporting Agency
sorts by columns: Hatchery Location Name, Stock Location Name, Species, Run, Tag Code, Recovery
Year, Fishery, Reporting Agency.
Example output listing:
50
RMIS -- User Guide
MAR 2012
11:42:43 12/30/2011
REPORT: HS4
Regional Mark Information System
ANNUAL RECOVERIES BY RECOVERY YEAR
HATCHERY: TUOLUMNE R FISH FAC.
STOCK: TUOLUMNE RIVER
YEAR FISHERY - Recovery Agency ................. OBS'D
TAG CODE 0601110203
1992 Treaty Troll
- WDFW
1
PAGE 1
SPECIES: Chinook
RUN: Fall
EST'D MEAS'D AVG MM
1
1
640
1
1
1
640
1
1
1
640
1
17
1
740
1
17
1
740
GRAND TOTALS:
1
17
End of report
The query criteria used to produce this report was:
WHERE UPPER(hatchery_location_name) = 'TUOLUMNE R FISH FAC.'
AND tag_status = '1
1
740
TOTALS FOR YEAR:
GRAND TOTALS:
TAG CODE 0601110204
1992 Ocean Troll (non-treaty)
- ODFW
TOTALS FOR YEAR:
RECOVERY ESTIMATION ANALYSIS BY YEAR (HA2)
Report characteristics:
•
•
•
tabular, fixed-field line format
aggregates by columns: Brood Year
sorts by columns: Hatchery Location Name, Stock Location Name, Species, Run, Brood Year.
Example output listing:
13:32:58 12/30/2011
REPORT: HA2
Regional Mark Information System
RECOVERY ESTIMATION ANALYSIS BY RECOVERY YEAR (2001-2010)
HATCHERY: ELWHA HATCHERY
PAGE 1
Stock Name
Sp Run BrYr 1999 2000 2001 2002 2003 2004 2005 2006 2007 2008 2009 2010
ELWHA R
18.0272
Chin Fall 2002 **
**
1
9
18
ELWHA R
18.0272
Chin Fall 2003 **
**
15
75
2
ELWHA R
18.0272
Chin Fall 2004 **
**
1
35
28
7
ELWHA R
18.0272
Chin Fall 2005 **
**
1
27
82
26
ELWHA R
18.0272
Chin Fall 2006 **
**
5
37
ELWHA R
18.0272
Chin Fall 2008 **
**
2
ELWHA R
18.0272
Coho Fall 2005 **
**
17
44
ELWHA R
18.0272
Coho Fall 2007 **
**
371 366
ELWHA R
18.0272
Coho Wint 2000 **
**
81 812
25
ELWHA R
18.0272
Coho Wint 2001 **
**
238 1512
1
ELWHA R
18.0272
Coho Wint 2002 **
**
432 1243
85
ELWHA R
18.0272
Coho Wint 2003 **
**
112 265
ELWHA R
18.0272
Coho Wint 2004 **
**
31
99
LOWER ELWHA 18.0274
Coho Fall 1997 **
**
2
LOWER ELWHA 18.0274
Coho Fall 1998 **
** 3140
53
LOWER ELWHA 18.0274
Coho Fall 1999 **
**
478 1894 144
LOWER ELWHA 18.0274
Coho Fall 2006 **
**
24 233
**: In this 12-year report format, these year columns either have no recoveries or were left out of this query.
End of report
The query criteria used to produce this report was:
WHERE UPPER(hatchery_location_name) IN ('ELWHA HATCHERY','LOWER ELWHA HATCHERY')
AND recovery_date_year IN (2001,2002,2003,2004,2005,2006,2007,2008,2009,2010)
AND tag status = '1'
TT
28
92
71
136
41
2
62
738
919
1752
1760
377
130
2
3193
2516
257
51
RMIS -- User Guide
MAR 2012
PSC 4.1 DATA EXCHANGE FORMAT (PRC)
The PRC report is described in the above section.
COMMA-SEPARATED VALUES CUSTOM FILE (CSV)
NOTE: This report requires that you choose your own list of --Recoveries—columns (see
section above).
To see a description and an example listing of this report format, see the Release Reports
section above (§ 6.1 ).
HTML CUSTOM TABLE (HTM)
NOTE: This report requires that you choose your own list of --Recoveries—columns (see
section above).
To see a description and an example listing of this report format, see the Release Reports
section above (§ 6.1 ).
Recoveries-by-Tag-List Reports
This query form is for use if you have only Tag Codes as a selection criterion. It can
accommodate up to 1000 tag codes per query for data selection; whereas, the ‘Recoveries by
Tag-Code’ query form can only accept up to 180 tag codes per query.
If you selected Query Form ‘by-Tag-List’ in the --Recoveries-- section of the RSR Navigation
Menu then you may have up to four (4) report formats available to run:
• Tag Analysis by SFEC Region, FisheryType (TA3)
• PSC 4.1 Data Exchange format (PRC)
• Comma-Separated Values custom file (CSV)
• HTML custom table (HTM).
The PRC report is described in the ‘Recoveries-by-Tag-Code’ section above. The CSV and HTM
reports are described the Release Reports section above (§ 6.1 ). The TA3 report is described
and illustrated as follows:
TAG ANALYSIS BY SFEC REGION, FISHERYTYPE (TA3)
This report is designed to provide a high-level aggregation of recoveries to assist with Selective
Fishery Evaluation Committee (SFEC) analyses. Please see Appendix, §12.1 for further
explanation of this report format.
Example output listing:
52
RMIS -- User Guide
MAR 2012
14:16:38 12/30/2011
Regional Mark Information System
REPORT: TA3
TAGCODE OBSERVED ANALYSIS BY SFEC-REGION, SFEC-FISHERYTYPE
TAG_CODE
-----------212212
212212
212212
212212
212212
-----------212229
212229
212229
212229
212229
212229
212229
End of report
SFEC_REGION
----------------------Alaska
BC Marine South
BC Marine South
Washington
Washington
----------------------Alaska
BC Marine North
BC Marine North
BC Marine South
BC Marine South
Washington
Washington
SFEC_FISHERYTYPE
----------------------Commercial
Commercial
Sport
Commercial
Sport
----------------------Commercial
Commercial
Sport
Commercial
Sport
Commercial
Sport
OBSERVED
------------1
8
14
72
24
------------4
5
1
258
30
166
1
The query criteria used to produce this report was:
WHERE tag_code IN ('212212','212229')
All Recoveries Reports
This query form is for use if you want to query for all possible recoveries for your tag groups –
regardless of ‘Status of Tag’ indicator. I.e. if you want to include data rows in which no tag was
present, or there was a discrepancy of some kind (see discussion on ‘Status of Tag’ in § 1.2 )
then this query form must be used.
If you selected Query Form ‘All Recoveries’ in the --Recoveries-- section of the RSR Navigation
Menu then you may have up to four (4) report formats available to run:
• PSC 4.1 Data Exchange format (PRC)
• Comma-Separated Values custom file (CSV)
• HTML custom table (HTM)
• Recoveries by Fin Mark (FM1).
The PRC report is described in the ‘Recoveries-by-Tag-Code’ section above. The CSV and HTM
reports are described the Release Reports section above (§ 6.1 ). The FM1 report is described
and illustrated as follows:
RECOVERIES BY FIN MARK (FM1)
This report is based on an aggregation of recoveries by generalized type of fin mark (i.e. ‘Fin
Mark Type’) and is based on the ‘Marks’ table (see "PSC Format Specification" document, Ch. 11,
referenced in §1.1 ). Fin Mark types are:
•
No Adclip
•
Right Pectoral
•
Adclip
•
Left Maxillary
•
Adipose Clip Unknown
•
Right Maxillary
•
Left Ventral
•
Visual Implant
•
Right Ventral
•
Elastomer Injection
•
Left Pectoral
•
Freeze Brand
53
RMIS -- User Guide
MAR 2012
Report characteristics:
•
•
•
summarized, aggregated, fixed-field line format
aggregates by columns: Fin Mark Type (above)
sorts by columns: Fin Mark Type, Recorded Mark (Mark Code), Recovery Year, Reporting Agency.
Example output listing:
10:57:57 01/05/2012
REPORT: FM1
FIN MARK
No Adclip
No Adclip
No Adclip TOTAL
Regional Mark Information System
RECOVERIES BY FIN MARK
MARK
CODE
0000
0001
REC.
YEAR
2000
2000
PAGE 1
REPORTING
AGENCY
OBSERVED
ODFW
13
ODFW
2
15
Adclip
Adclip
Adclip
Adclip TOTAL
5000 2000 ODFW
5001 2000 ODFW
5002 2000 ODFW
681
61
12
754
Left Ventral
Left Ventral
Left Ventral TOTAL
0001 2000 ODFW
5001 2000 ODFW
2
61
63
Right Ventral
Right Ventral TOTAL
End of report
5002 2000 ODFW
12
12
The query criteria used to produce this report was:
WHERE run_year = 2000
AND UPPER(recovery_location_name) LIKE 'BONNEVILLE POOL%'
6.3 Other Reports
Catch /Sample Downloading
If you selected Query Form ‘Catch/Sample’ in the --Other-- section of the RSR Navigation Menu
then you may have up to three (3) report formats available to run:
• PSC 4.1 Data Exchange format (PCS)
• Comma-Separated Values custom file (CSV)
• HTML custom table (HTM).
The CSV and HTM reports are described the Release Reports section above (§ 6.1 ). The PCS
report is described and illustrated as follows:
PSC 4.1 DATA EXCHANGE FORMAT (PCS)
This report is a fixed raw data listing of columns that correspond exactly to the Pacific Salmon
Commission data exchange format for Catch/Sample data. See "PSC Format Specification"
document, Ch. 4 (referenced in §1.1 ).
Example output listing:
54
RMIS -- User Guide
MAR 2012
record_code,format_version,submission_date,reporting_agency,sampling_agency,catch_sample_id,species,catch_year,period_type,period
,first_period,last_period,fishery,adclip_selective_fishery,estimation_level,catch_location_code,detection_method,sample_type,samp
led_maturity,sampled_run,sampled_length_range,sampled_sex,sampled_mark,number_caught,escapement_estimation_method,number_sampled,
number_estimated,number_recovered_decoded,number_recovered_no_cwts,number_recovered_lost_cwts,number_recovered_unreadable,number_
recovered_unresolved,number_recovered_not_processed,number_recovered_pseudotags,mr_1st_partition_size,mr_1st_sample_size,mr_1st_s
ample_known_ad_status,mr_1st_sample_obs_adclips,mr_2nd_partition_size,mr_2nd_sample_size,mr_2nd_sample_known_ad_status,mr_2nd_sam
ple_obs_adclips,mark_rate,awareness_factor,sport_mark_incidence_sampl_size,sport_mark_inc_sample_obs_adclips
"S","4.1","20081014","WDFW","WDFW","1119671","5","1999","6","41",,,"22",,"5","3M21902 G","V","1",,,,,,"68",,"0",,"0","0","0",
"0","0","0","0","0","0",,,,,,,,,,
"S","4.1","20081014","WDFW","WDFW","1119672","5","1999","6","42",,,"22",,"5","3M21902 G","V","1",,,,,,"1050",,"0",,"0","0","0",
"0","0","0","0","0","0",,,,,,,,,,
End of report
The query criteria used to produce this report was:
WHERE species = '5'
AND catch_year = 1999
AND UPPER(catch_location_code) LIKE '3M21902%'
Locations Downloading
If you selected Query Form ‘Locations’ in the --Other-- section of the RSR Navigation Menu then
you may have up to three (3) report formats available to run:
• PSC 4.1 Data Exchange format (PLC)
• Comma-Separated Values custom file (CSV)
• HTML custom table (HTM).
The CSV and HTM reports are described the Release Reports section above (§ 6.1 ). The PLC
report is described and illustrated as follows:
PSC 4.1 DATA EXCHANGE FORMAT (PLC)
This report is a fixed raw data listing of columns that correspond exactly to the Pacific Salmon
Commission data exchange format for Location data. See "PSC Format Specification" document,
Ch. 6 (referenced in §1.1 ).
Example output listing:
record_code,format_version,submission_date,reporting_agency,location_code,location_type,name,latitude,longitude,psc_basin,psc_reg
ion,epa_reach,description
"L","4.1","20111220","WDFW","3F10805 196005 H","3","OLSON RESORT
(19)",,,"LYHO","JUAN",,"OLSON RESORT"
"L","4.1","20111220","WDFW","3F10805 1973422E","3","CLALLAM BAY ES/HS",,,"LYHO","JUAN",,"CLALLAM BAY HIGH & ELEMENTARY (SEKIU)"
"L","4.1","20111220","WDFW","3F10804 190235 H","3","SAIL R NETARTS BOXES",,,"LYHO","JUAN",,"SAIL RIVER STREAMSIDE NETARTS BOX"
"L","4.1","20111220","WDFW","3F10805 190148 H","3","HOKO FALLS HATCHERY",,,"LYHO","JUAN",,"HOKO FALLS HATCHERY (MAKAH TRIBE)
[FORMERLY HOKO HATCHERY]"
"L","4.1","20111220","WDFW","3M10705 888001 H","3","CLALLAM BAY NET PENS",,,"LYHO","JUAN",,"CLALLAM BAY NET PENS"
End of report
The query criteria used to produce this report was:
WHERE location_type = '3'
AND rmis_basin = 'LYHO'
55
RMIS -- User Guide
MAR 2012
Chapter 7 RMIS Analysis: Introduction and Navigation
The RMIS Analysis Reporting (RAR) system is based on the former “CWT Retrieval and Analysis
System” (CRAS) developed by the Northwest Indian Fisheries Commission (NWIFC) in 1995.
The reporting system is based on a summarized table of CWT recoveries maintained at the RMPC
(updated twice per week). This table is aggregated by Tag Code, age cohort index,
Management-Fishery, and Recovery Date Year.
RAR also has a number of additional distinguishing features including:
• Allows analyzing recoveries based on Management-Fishery – which is a coast-wide
alternative fishery designation to the standard PSC ‘Fishery’ code. (The PSC ‘Fishery’ code
is stored in the CWT database and reported through the RMIS Standard Reporting (RSR)
system). See Appendix, §12.2 for a list of Management-Fisheries in RAR;
• Allows the ability to aggregate recoveries in multiple ways in a single report by using
grouped criteria (i.e. sets of Tag Codes or Management-Fisheries). For example, Tag
Codes can be grouped by Brood Year, Hatchery/Facility, Release Site, etc. and viewed in
this way in the recovery distribution reports;
• Allows viewing and analyzing recoveries based on age cohort;
• Allows viewing and analyzing recoveries as a distribution (by percentage) across
Management-Fisheries or across Recovery Years.
There are two main types of analysis reporting in RAR:
1. CWT Recoveries;
2. Management-Fishery Recoveries.
Both of these require that you first specify the conditions you want to use to return a list of
recoveries. Reports are then generated from these lists.
From the RMIS Home Page clicking on the RMIS Analysis Reporting icon leads to the RAR Login
page (see § 2.3 above for login instructions). The contents of this page are determined by
which database you chose. Here are the start pages available on the RAR Login page:
56
RMIS -- User Guide
MAR 2012
Figure 17: RAR Login Screen
1. Define CWT Criteria: Define and create a Criteria object and (optionally) generate a RAR
Tag-List based on the Criteria;
2. Edit CWT Criteria: Change, rename, or delete previously created Criteria objects;
3. Create Tag List: Create a RAR Tag-List (manually) by entering specific Tag Codes;
4. Edit Tag List: Manage all existing RAR Tag-Lists (I.e. inspect, edit, rename, or delete);
5. CWT Recovery Reports: Choose and run a CWT-based recovery report using a RAR TagList;
6. Define Combined Fishery: Create a list of Management-Fisheries for use with the RAR
Management-Fishery report;
7. Edit Combined Fishery: Change, rename, or delete previously created ManagementFishery list objects;
8. Fishery Recovery Reports: Run the Management-Fishery based report using a
Management-Fishery list.
From the RAR Login page clicking on Login button leads to the selected RAR Query Form. The
navigation of these forms is described below.
57
RMIS -- User Guide
MAR 2012
7.1 RAR Navigation
Figure 18: RAR Query Form illustration of navigation elements
The RAR query forms are used to do analysis based on Tag Codes (CWT) or based on
Management-Fisheries (see Figure 18, left-side navigation column above).
For CWT Analysis (see Figure 18):
• First, define your criteria by choosing species, run type, rearing type, release stage, brood
year, release year and/or hatchery;
• Process your criteria list by selecting the Save and Generate Tag List button;
• A list of tags will automatically be generated.
You can edit this list a number of ways: adding tag codes, removing tag codes, temporarily
excluding tag codes, or grouping tag codes to analyze their combined recoveries (see below).
You can also hand-enter tag codes in a tag code list if you already know the ones you want,
avoiding the steps above (see ‘Create Tag List’ form).
Your personal Criteria and RAR Tag-Lists are automatically saved for later recall.
58
RMIS -- User Guide
MAR 2012
Chapter 8 RAR Tag-List Maintenance
Here is an example RAR Tag-List with 15 Tag Code releases which can be manipulated in a
number of ways in preparation for running a RAR CWT Recovery report. Some RAR reports give
best results when the RAR Tag-List is grouped (see §8.1 and §8.2 below).
Figure 19: RAR Tag-List Maintenance example illustration
8.1 Automatic Tag Code Grouping
Tag Codes can be automatically grouped by: brood year, species, run, hatchery, or release site.
To do this, click ‘Automatic Grouping’ (A). In this example, they have been grouped by hatchery
(B). To edit the name of a group, click on a group number (B), or click ‘Edit Group Names’ (C).
These group names will appear in some report results. NOTE: RAR CWT Maintenance always
includes a default group (0) called ‘Ungrouped Tags’.
8.2 Manual Tag Code Grouping
Manual Grouping is a two-step process. First, highlight rows you want to group together by
clicking on them (D). The number of highlighted rows will appear in the top header of the form.
Then, after you have highlighted all the rows to be grouped, click on the ‘Manual Grouping’
59
RMIS -- User Guide
MAR 2012
button (E) to choose a group. This will go to a Tag Group Maintenance form showing the
highlighted Tag Codes and having the new group to be added listed at the bottom. There, enter
a name for the new group (ex: ‘Klickitat R Sites’) in the box, then click ‘Save’. You will be
returned to the form shown above (Figure 19). In this example, a new, 4th group will be created
to identify Release Sites which include the Klickitat River.
8.3 More Editing Features
Adding Tag Code
You can manually add a Tag Code to this list by clicking on ‘Add Tag Code’ (F). This will go to a
form to enter the new Tag Code and assign it to one of the groups.
Changing Sort Columns
The RAR Tag-List Maintenance form can have sort order changed by clicking on the column
header (G). The sort order shown is by Tag Code.
Excluding Tag Codes
Specific Tag Codes can be excluded (temporarily) from the RAR Tag-List to compare recovery
results without them. For example, in the illustration above (H), releases from ‘BLIND SL (LWR
COL R)’ have been excluded from being run in the report. They can be re-included later.
Looking up Tag-Code Detail
Figure 20: RAR Tag Code Detail showing recovery table
Figure 21: RAR Tag Code Detail showing map
The release and recovery detail of a Tag Code can be viewed by clicking on the ‘?’ button (Figure
19, I). This feature has the ability to display a table of the Tag Code’s release & recovery
information (Figure 20), as well as generate a dynamic map of releases and recoveries for the
Tag Code (if available) Using a GoogleMaps application (Figure 21). Note that these maps
show only points where lat/long coordinates are available for the Tag Code. Some
recovery sites do not have lat/longs and cannot be shown.
60
RMIS -- User Guide
MAR 2012
Emailing RAR Tag-List
You can obtain a simple list of these Tag Codes sent by email by clicking on ‘Email Tag List’
button (Figure 19, J). This allows easy copy & paste of this RAR Tag-List for use in other
applications (such as RMIS Standard Reporting).
Chapter 9 RAR Combined Fishery Maintenance
Figure 22: RAR Combined-Fishery Maintenance example illustration
On the Combined Fishery Maintenance forms (Figure 22), enter a Name (A) and Description (B)
for your new ‘Combined-Fishery’ object. Then click 'Create Combined Fishery' button (C). The
table shown above will appear. At that point, you can do the two-step sequence below.
61
RMIS -- User Guide
MAR 2012
9.1 Adding Groups to a Combined-Fishery
Step 1
Choose your first group of Management-Fisheries by clicking on them as seen in the example
above (D). Then click on the 'Manual Grouping' button in the upper left (E).
Step 2
You will then go to a form to enter a name for the group of items (shown lower-right). Per
instructions on the form, click on the lowest radiobutton (G), type in a Group Name (H), and
click 'Save' (I). Then you will be returned to the table at left with Group '1' items identified (F).
Repeat
Repeat steps 1 & 2 to create multiple groups of Management-Fisheries. Each item will have a
Group number (F) as shown. Note: Group '0' is always categorized as the default group:
'Ungrouped Fisheries'.
Chapter 10 RAR CWT Recovery Reports
You can generate a number of CWT recovery reports using a range of fishery recovery locations.
RMIS Analysis CWT Reports are as follows:
• CWT Summary
• CWT Recovery Distribution (all fisheries)
• CWT Recovery Distribution (combined fisheries)
• CWT Recovery Distribution (CWT groups)
• CWT Recovery Distribution (CWT groups and combined fisheries)
• Freshwater Fishery Recovery
• Freshwater Recovery (CWT groups)
• Survival and Contribution Rate (CWT groups)
• Contribution Rate (combined fisheries).
RAR CWT Recovery reports are run from a RAR Tag-List object (described in Ch. 8). Some
reports optionally can include, or require; a RAR Combined-Fishery object as well (a list of
Management- Fisheries – described in Ch. 9).
These reports are described and illustrated as follows:
CWT SUMMARY
Report characteristics:
•
•
•
•
summarized, master-detail format showing release information in header section
recovery data (by general recovery location) and estimated recoveries by age
aggregates by columns: Location State/Province, age cohort
sorts by columns: Release Year, Tag Code.
Example output listing:
62
RMIS -- User Guide
MAR 2012
CWT Summary
Run Date: 2012-03-14
Tag List: Chinook1
Sorted by: year of release
Release Summary
Tag Code: 630884
Brood Year: 2000
Species: Chinook
Run: Spring
Hatchery Name: NORTH TOUTLE HATCHRY
Release Site: GREEN R 26.0323
Release Agency: Washington Department of Fish and Wildlife
Stock: COWLITZ R 26.0002
Release Stage: Smolt
Rearing Type: Hatchery reared fish
First Release Date: 2002-05-26
Tag Type: Standard Alphanumeric (1 mm)
Last Release Date: 2002-05-30
Avg. Weight (g): 50.39
CWT 1st Mark Name: Adipose clip (Ad)
Non CWT 1st Mark Name: Adipose clip (Ad)
CWT 1st Mark Count: 105,616
Non CWT 1st Mark Count: 970
CWT 2nd Mark Name:
Non CWT 2nd Mark Name:
CWT 2nd Mark Count:
Non CWT 2nd Mark Count:
Total # Released: 106,586
# Adclips Associated w/Release: 106,586
Recovery Summary (All Ages)
Recovery Location
Number of
Number of
% of Total
Obs. Recoveries Est. Recoveries Est. Recoveries
Alaska
4
14.9
1%
British Columbia
48
157.2
15%
Washington
46
124.6
12%
Oregon
28
82.4
8%
0
0.0
0%
231
601.3
56%
45
90.0
8%
409
1074.2
100%
California
Escapement
Other
Total Recoveries
Estimated Minimum Survival Rate 0.01017
Estimated Recoveries by Age
Recovery Age Total Total % Fishery Fishery % Freshwater Escapement Freshwater %
2
18.0
2%
0.0
0%
18.0
3%
3
210.2
20%
103.2
22%
107.0
18%
4
671.9
63%
331.2
70%
340.7
57%
5
160.6
15%
33.9
7%
126.7
21%
6
13.5
1%
4.6
1%
8.9
1%
CWT RECOVERY DISTRIBUTION (ALL FISHERIES)
Report characteristics:
•
•
•
•
summarized, master-detail format showing release information in header section
recoveries are summarized showing distribution into management fishery
aggregates by columns: age cohort, Management-Fishery, fishery summary type (whether freshwater
escapement or otherwise)
sorts by columns: Release Year, Tag Code, age cohort, fishery summary type.
63
RMIS -- User Guide
MAR 2012
Example output listing:
CWT Recovery Dist (all fisheries)
Run Date: 2012-03-14
Tag List: Chinook1
Sorted by: year of release
Release Summary
Tag Code: 630884
Brood Year: 2000
Species: Chinook
Run: Spring
Hatchery Name: NORTH TOUTLE HATCHRY
Release Site: GREEN R 26.0323
Release Agency: Washington Department of Fish and Wildlife
Stock: COWLITZ R 26.0002
Release Stage: Smolt
Rearing Type: Hatchery reared fish
First Release Date: 2002-05-26
Tag Type: Standard Alphanumeric (1 mm)
Last Release Date: 2002-05-30
Avg. Weight (g): 50.39
CWT 1st Mark Name: Adipose clip (Ad)
Non CWT 1st Mark Name: Adipose clip (Ad)
CWT 1st Mark Count: 105,616
Non CWT 1st Mark Count: 970
Total # Released: 106,586
# Adclips Associated w/Release: 106,586
Recovery Summary (Age 2)
Recovery Location
Number of
Number of
% of Total
Obs. Recoveries Est. Recoveries Est. Recoveries
Freshwater Escapement
18
18.0
100.0%
Total Recoveries
18
18.0
100.0%
Recovery Summary (Age 3)
Recovery Location
Number of
Number of
% of Total
Obs. Recoveries Est. Recoveries Est. Recoveries
SW Vancouver Island Troll
10
29.2
13.9%
WA Area 2 Sport (Westport)
7
19.8
9.4%
WA Area 1 Troll (Columbia River Mouth)
1
8.0
3.8%
WA Area 1 Sport (Illwaco)
4
7.4
3.5%
Buoy 10 Sport
1
2.8
1.3%
Tillamook Troll
2
3.4
1.6%
Tillamook Sport
2
5.8
2.8%
Freshwater Net
13
23.0
10.9%
High Seas Catch
4
3.8
1.8%
Freshwater Escapement
107
107.0
50.9%
Total Recoveries
151
210.2
100.0%
<report example continued on next page..>
64
RMIS -- User Guide
MAR 2012
Recovery Summary (Age 4)
Recovery Location
Number of
Number of
% of Total
Obs. Recoveries Est. Recoveries Est. Recoveries
Southeast Alaska Troll
4
14.9
2.2%
North British Columbia Troll
2
4.6
0.7%
NW Vancouver Island Troll
16
48.2
7.2%
SW Vancouver Island Troll
8
24.7
3.7%
Southern British Columbia Troll
3
0.0
0.0%
West Coast Vancouver Island Sport
4
31.9
4.7%
WA Areas 4 and 4B Troll (Cape Flattery) 15
37.0
5.5%
WA Area 4 Sport (Neah Bay)
2
3.9
0.6%
WA Area 3 Troll (Quileute)
1
2.0
0.3%
WA Area 2 Troll (Grays Harbor)
6
19.6
2.9%
WA Area 2 Sport (Westport)
2
5.2
0.8%
WA Area 1 Troll (Columbia River Mouth) 4
12.0
1.8%
WA Area 1 Sport (Illwaco)
2
5.6
0.8%
Newport Troll
19
57.2
8.5%
Newport Sport
2
3.8
0.6%
Coos Bay Troll
3
12.2
1.8%
Freshwater Sport
5
21.6
3.2%
Freshwater Net
17
26.8
4.0%
High Seas Catch
3
0.0
0.0%
Freshwater Escapement
69
340.7
50.7%
Total Recoveries
187
671.9
100.0%
Recovery Summary (Age 5)
Recovery Location
Number of
Number of
% of Total
North British Columbia Troll
2
3.8
2.4%
NW Vancouver Island Troll
2
10.2
6.4%
WA Areas 4 and 4B Troll (Cape Flattery)
1
1.3
0.8%
Freshwater Sport
2
8.4
5.2%
Freshwater Net
8
10.2
6.4%
Freshwater Escapement
31
126.7
78.9%
Total Recoveries
46
160.6
100.0%
Recovery Summary (Age 6)
Recovery Location
Number of
Number of
% of Total
SW Vancouver Island Troll
1
4.6
Freshwater Escapement
6
8.9
34.1%
65.9%
Total Recoveries
7
13.5
100.0%
Recovery Summary (All Ages)
Recovery Location
Number of
Number of
% of Total
Fishery
178
472.9
Freshwater Escapement
231
601.3
44.0%
56.0%
Total Recoveries
409
1074.2
100.0%
65
RMIS -- User Guide
MAR 2012
CWT RECOVERY DISTRIBUTION (COMBINED FISHERIES)
Report characteristics:
•
•
•
•
summarized, master-detail format showing release information in header section
recoveries are summarized showing distribution into customized fishery categories (groups) using a
combined-fishery (created by the user, see Ch. 9 above)
aggregates by columns: age cohort, Management-Fishery group, fishery summary type (whether
freshwater escapement or otherwise)
sorts by columns: Release Year, Tag Code, age cohort, Management-Fishery group, fishery summary
type.
Example output listing:
CWT Recovery Dist (combined fishery)
Run Date: 2012-03-14
Tag List: Chinook1
Combined Fishery: Gear Types 1
Sorted by: year of release
Release Summary
Tag Code: 630884
Brood Year: 2000
Species: Chinook
Run: Spring
Hatchery Name: NORTH TOUTLE HATCHRY
Release Site: GREEN R 26.0323
Release Agency: Washington Department of Fish and Wildlife
Stock: COWLITZ R 26.0002
Release Stage: Smolt
Rearing Type: Hatchery reared fish
First Release Date: 2002-05-26
Tag Type: Standard Alphanumeric (1 mm)
Last Release Date: 2002-05-30
Avg. Weight (g): 50.39
CWT 1st Mark Name: Adipose clip (Ad)
Non CWT 1st Mark Name: Adipose clip (Ad)
CWT 1st Mark Count: 105,616
Non CWT 1st Mark Count: 970
CWT 2nd Mark Name:
Non CWT 2nd Mark Name:
CWT 2nd Mark Count:
Non CWT 2nd Mark Count:
Total # Released: 106,586
# Adclips Associated w/Release: 106,586
Recovery Summary (Age 2)
Grouped Fishery Name
% of Total
% of Total
Number of
Number of
Est. Recoveries Est. Recoveries
Obs. Recoveries Est. Recoveries
(All Ages)
for Age
Ungrouped Fisheries
18
18.0
1.7%
100.0%
Total Recoveries
18
18.0
1.7%
100.0%
Recovery Summary (Age 3)
Grouped Fishery Name
Ungrouped Fisheries
% of Total
% of Total
Number of
Number of
Est. Recoveries Est. Recoveries
Obs. Recoveries Est. Recoveries
(All Ages)
for Age
111
110.8
10.3%
52.7%
All-Troll
13
40.6
3.8%
19.3%
All-Net
13
23.0
2.1%
10.9%
All-Sport
Total Recoveries
14
35.8
3.3%
17.0%
151
210.2
19.6%
100.0%
<report example continued on next page..>
66
RMIS -- User Guide
MAR 2012
Recovery Summary (Age 4)
Grouped Fishery Name
% of Total
% of Total
Number of
Number of
Est. Recoveries Est. Recoveries
Obs. Recoveries Est. Recoveries
(All Ages)
for Age
Ungrouped Fisheries
72
340.7
31.7%
50.7%
All-Troll
81
232.4
21.6%
34.6%
All-Net
17
26.8
2.5%
4.0%
All-Sport
17
72.0
6.7%
10.7%
187
671.9
62.5%
100.0%
Total Recoveries
Recovery Summary (Age 5)
Grouped Fishery Name
% of Total
% of Total
Number of
Number of
Est. Recoveries Est. Recoveries
Obs. Recoveries Est. Recoveries
(All Ages)
for Age
Ungrouped Fisheries
31
126.7
11.8%
78.9%
All-Troll
5
15.3
1.4%
9.5%
All-Net
8
10.2
0.9%
6.4%
All-Sport
2
8.4
0.8%
5.2%
46
160.6
15.0%
100.0%
Total Recoveries
Recovery Summary (Age 6)
Grouped Fishery Name
% of Total
% of Total
Number of
Number of
Est. Recoveries Est. Recoveries
Obs. Recoveries Est. Recoveries
(All Ages)
for Age
Ungrouped Fisheries
6
8.9
0.8%
All-Troll
Total Recoveries
65.9%
1
4.6
0.4%
34.1%
7
13.5
1.3%
100.0%
Recovery Summary (All Ages)
Recovery Location
Number of
Number of
% of Total
Obs. Recoveries Est. Recoveries Est. Recoveries
Fishery
178
472.9
44.0%
Freshwater Escapement
231
601.3
56.0%
Total Recoveries
409
1074.2
100.0%
CWT RECOVERY DISTRIBUTION (CWT GROUPS)
Report characteristics:
•
•
•
•
tabular format, organized by CWT group number (see RAR Tag-List grouping in Ch. 8)
recoveries are summarized by CWT groups and Management-Fisheries
aggregates by columns: CWT group number, age cohort
sorts by columns: CWT group number, age cohort.
Example output listing:
67
RMIS -- User Guide
MAR 2012
CWT Recovery Dist (groups)
Run Date: 2012-03-14
Tag List: Bonneville production 1
Group Name: Hatchery: BONNEVILLE HATCHERY
Age: 2 Total # of Est. Recoveries: 213.2
Total # of Est. Fishery Recoveries: 3.0
Number of
Number of
% of Total
Obs. Recoveries Est. Recoveries Est. Recoveries
Recovery Location
WA Area 1 Sport (Illwaco)
1
3.0
1.4%
Freshwater Escapement
208
210.2
98.6%
Total Recoveries
209
213.2
100.0%
Group Name: Hatchery: BONNEVILLE HATCHERY
Age: 3 Total # of Est. Recoveries: 1,976.6
Total # of Est. Fishery Recoveries: 641.6
Recovery Location
Number of
Number of
% of Total
Obs. Recoveries Est. Recoveries Est. Recoveries
WA Areas 4 and 4B Troll (Cape Flattery)
3
8.0
0.4%
WA Area 4 Sport (Neah Bay)
1
3.9
0.2%
WA Area 3 Troll (Quileute)
1
1.4
0.1%
WA Area 2 Troll (Grays Harbor)
1
1.8
0.1%
12
28.1
1.4%
8
37.0
1.9%
WA Area 1 Sport (Illwaco)
94
197.7
10.0%
Buoy 10 Sport
32
95.7
4.8%
Tillamook Troll
2
4.0
0.2%
Tillamook Sport
15
40.9
2.1%
Newport Troll
1
0.0
0.0%
Newport Sport
17
57.2
2.9%
Coos Bay Troll
4
15.1
0.8%
Coos Bay Sport
29
80.5
4.1%
Brookings Sport
6
19.4
1.0%
Eureka Sport
2
9.2
0.5%
WA Area 2 Sport (Westport)
WA Area 1 Troll (Columbia River Mouth)
Freshwater Sport
2
6.9
0.3%
16
34.8
1.8%
Freshwater Escapement
1,337
1,335.0
67.5%
Total Recoveries
1,583
1,976.6
100.0%
Freshwater Net
<report example continued on next page..>
68
RMIS -- User Guide
MAR 2012
Group Name: Hatchery: SANDY HATCHERY
Age: 2 Total # of Est. Recoveries: 184.1
Total # of Est. Fishery Recoveries: 0.0
Number of
Number of
% of Total
Obs. Recoveries Est. Recoveries Est. Recoveries
Recovery Location
Freshwater Escapement
157
184.1
100.0%
Total Recoveries
157
184.1
100.0%
Group Name: Hatchery: SANDY HATCHERY
Age: 3 Total # of Est. Recoveries: 2,336.6
Total # of Est. Fishery Recoveries: 630.4
Number of
Number of
% of Total
Obs. Recoveries Est. Recoveries Est. Recoveries
Recovery Location
West Coast Vancouver Island Sport
1
14.9
0.6%
WA Areas 4 and 4B Troll (Cape Flattery)
2
4.4
0.2%
WA Area 3 Sport (La Push)
1
1.6
0.1%
WA Area 2 Troll (Grays Harbor)
1
1.3
0.1%
13
28.1
1.2%
5
19.8
0.8%
103
209.5
9.0%
Buoy 10 Sport
29
84.1
3.6%
Tillamook Sport
WA Area 2 Sport (Westport)
WA Area 1 Troll (Columbia River Mouth)
WA Area 1 Sport (Illwaco)
12
29.9
1.3%
Newport Troll
1
2.1
0.1%
Newport Sport
18
57.1
2.4%
Coos Bay Troll
6
22.7
1.0%
Coos Bay Sport
14
41.7
1.8%
Brookings Sport
1
5.7
0.2%
WA Area 5 Sport
1
4.2
0.2%
Freshwater Sport
8
34.2
1.5%
37
66.4
2.8%
1,541
1,706.2
73.0%
Freshwater Net
Freshwater Escapement
Oregon General-Sport
Total Recoveries
Group Name: Hatchery: SANDY HATCHERY
Age: 4 Total # of Est. Recoveries: 1.0
2
2.7
0.1%
1,796
2,336.6
100.0%
Total # of Est. Fishery Recoveries: 0.0
Recovery Location
Number of
Number of
% of Total
Obs. Recoveries Est. Recoveries Est. Recoveries
Freshwater Escapement
1
1.0
100.0%
Total Recoveries
1
1.0
100.0%
69
RMIS -- User Guide
MAR 2012
CWT RECOVERY DISTRIBUTION (CWT GROUPS AND COMBINED FISHERIES)
Report characteristics:
•
•
•
•
tabular format, organized by CWT group number (see RAR Tag-List grouping in Ch. 8)
recoveries are summarized by CWT groups and show a distribution into customized fishery categories
(groups) using a combined-fishery (also created by the user, see Ch. 9)
aggregates by columns: CWT group number, age cohort, Management-Fishery group
sorts by columns: CWT group number, age cohort, Management-Fishery group.
Example output listing:
70
RMIS -- User Guide
MAR 2012
CWT Recoveries (groups/combined fishery)
Run Date: 2012-03-15
Tag List: Bonneville production 1
Combined Fishery: Gear Types 1
Group Name: Hatchery: BONNEVILLE HATCHERY
Age: 2 Total # of Est. Recoveries: 213.2 Total # of Est. Fishery Recoveries: 3.0
Grouped Fishery Name
Number of
Number of
% of Total
Obs. Recoveries Est. Recoveries Est. Recoveries
Ungrouped Fisheries
208
All-Sport
Total Recoveries
210.2
98.6%
1
3.0
1.4%
209
213.2
100.0%
Age: 3 Total # of Est. Recoveries: 1,976.6 Total # of Est. Fishery Recoveries: 641.6
Grouped Fishery Name
Number of
Number of
% of Total
Obs. Recoveries Est. Recoveries Est. Recoveries
Ungrouped Fisheries
1,339
1,344.2
68.0%
All-Troll
20
67.3
3.4%
All-Net
16
34.8
1.8%
All-Sport
Total Recoveries
208
530.3
26.8%
1,583
1,976.6
100.0%
Group Name: Hatchery: SANDY HATCHERY
Age: 2 Total # of Est. Recoveries: 184.1 Total # of Est. Fishery Recoveries: 0.0
Grouped Fishery Name
Number of
Number of
% of Total
Obs. Recoveries Est. Recoveries Est. Recoveries
Ungrouped Fisheries
157
184.1
100.0%
Total Recoveries
157
184.1
100.0%
Age: 3 Total # of Est. Recoveries: 2,336.6 Total # of Est. Fishery Recoveries: 630.4
Grouped Fishery Name
Ungrouped Fisheries
Number of
Number of
% of Total
Obs. Recoveries Est. Recoveries Est. Recoveries
1,541
1,706.2
73.0%
All-Troll
15
50.3
2.2%
All-Net
37
66.4
2.8%
203
513.7
22.0%
1,796
2,336.6
100.0%
All-Sport
Total Recoveries
Age: 4 Total # of Est. Recoveries: 1.0 Total # of Est. Fishery Recoveries: 0.0
Grouped Fishery Name
Number of
Number of
% of Total
Obs. Recoveries Est. Recoveries Est. Recoveries
Ungrouped Fisheries
1
1.0
100.0%
Total Recoveries
1
1.0
100.0%
71
RMIS -- User Guide
MAR 2012
FRESHWATER FISHERY RECOVERY
Report characteristics:
•
•
•
•
summarized, master-detail format showing release information in header section
observed and estimated freshwater recoveries by recovery year, (standard PSC) fishery, and site
aggregates by columns: Tag Code, Recovery Year
sorts by columns: Tag Code, Recovery Year, PSC Fishery name.
Example output listing:
72
RMIS -- User Guide
MAR 2012
Freshwater Recovery
Run Date: 2012-03-15
Tag List: Mid-Columbia
Release Summary
Tag Code: 094052
Brood Year: 2003
Species: Coho
Hatchery Name: OXBOW HATCHERY
Release Agency: Oregon Department of Fish and Wildlife
Release Stage: Smolt
Run:
Release Site: TANNER CR (BNVILLE)
Stock: TANNER CR (BNVILLE)
Rearing Type: Hatchery reared fish
Return Year PSC Fishery
Site
# Observed # Estimated
2005
Hatchery
BONNEVILLE HATCHERY
47
47.47
2006
Columbia River Gillnet ABOVE BNVILLE NET
4
11.46
2006
Columbia River Gillnet COL R TONGUE PT POST '06
5
18.30
2006
Columbia River Gillnet COL R ZONE 1 NET 777
1
1.00
2006
Columbia River Gillnet COL R ZONE 2 NET
3
6.27
2006
Columbia River Gillnet COL R ZONE 3 NET
3
4.34
2006
Columbia River Gillnet COL R ZONE 4 NET 534
4
5.44
2006
Columbia River Gillnet COL R ZONE 5 NET AREA 5
7
10.22
2006
Columbia River Sport
COL R OR SPORT SEC 8
1
2.64
2006
Columbia River Sport
COL R OR SPT SEC 10
1
4.23
2006
Estuary Sport
COLUMBIA R ESTUARY
7
7.39
2006
Hatchery
BONNEVILLE HATCHERY
1,149
1,160.49
2006
Hatchery
LTL WHITE SALMON NFH
5
5.00
2006
Spawning Ground
COL R BEL BONNEVILLE
1
1.00
2006
Spawning Ground
NELSON CR 29.0019
1
0.00
2006
Spawning Ground
WASHOUGAL R 28.0159
1
0.00
Release Summary
Tag Code: 094458
Brood Year: 2005
Species: Coho
Hatchery Name: OXBOW HATCHERY
Release Agency: Oregon Department of Fish and Wildlife
Release Stage: Smolt
Return Year PSC Fishery
Run:
Release Site: UMATILLA R
Stock: TANNER CR (BNVILLE)
Rearing Type: Hatchery reared fish
Site
2007
Fish Trap (freshwater) THREE MILE DAM (UMAT
2008
Columbia River Gillnet ABOVE BNVILLE NET
2008
2008
2008
Fish Trap (freshwater) THREE MILE DAM (UMAT
2008
Freshwater Net
2008
Freshwater Sport
# Observed # Estimated
1
1.00
10
63.33
Columbia River Gillnet COL R ZONE 5 NET AREA 5
1
2.57
Estuary Sport
3
9.01
13
13.00
DRANO LK (SKAM)
1
0.00
UMATILLA R SPORT SEC-1
1
1.00
COLUMBIA R ESTUARY
73
RMIS -- User Guide
MAR 2012
FRESHWATER RECOVERY (CWT GROUPS)
Report characteristics:
•
•
•
•
tabular format, organized by CWT groups (see RAR Tag-List grouping in Ch. 8)
observed and estimated freshwater recoveries by CWT groups, recovery year, (standard PSC) fishery,
and site
aggregates by columns: CWT group number, Recovery Year, PSC Fishery name
sorts by columns: CWT group number, Recovery Year, PSC Fishery name.
Example output listing:
Freshwater Recovery (groups)
Run Date: 2012-03-15
Tag List: Mid-Columbia
Group Name: Release Site: TANNER CR (BNVILLE)
Return Year PSC Fishery
Site
2005
Hatchery
BONNEVILLE HATCHERY
2006
2006
# Observed # Estimated
51
51.51
Columbia River Gillnet ABOVE BNVILLE NET
5
14.43
Columbia River Gillnet COL R TONGUE PT POST '06
6
21.96
2006
Columbia River Gillnet COL R ZONE 1 NET 777
1
1.00
2006
Columbia River Gillnet COL R ZONE 2 NET
3
6.27
2006
Columbia River Gillnet COL R ZONE 3 NET
3
4.34
2006
Columbia River Gillnet COL R ZONE 3 NET 23
1
1.36
2006
Columbia River Gillnet COL R ZONE 4 NET 534
4
5.44
2006
Columbia River Gillnet COL R ZONE 5 NET AREA 5
7
10.22
2006
Columbia River Sport
COL R OR SPORT SEC 8
1
2.64
2006
Columbia River Sport
COL R OR SPT SEC 10
1
4.23
2006
Estuary Sport
COLUMBIA R ESTUARY
11
11.53
2006
Hatchery
BONNEVILLE HATCHERY
1,679
1,695.79
2006
Hatchery
LTL WHITE SALMON NFH
7
7.00
2006
Spawning Ground
COL R BEL BONNEVILLE
1
1.00
2006
Spawning Ground
NELSON CR 29.0019
1
0.00
2006
Spawning Ground
WASHOUGAL R 28.0159
1
0.00
Group Name: Release Site: UMATILLA R
Return Year PSC Fishery
Site
# Observed # Estimated
2007
Columbia River Gillnet ABOVE BNVILLE NET
1
4.38
2007
Fish Trap (freshwater) THREE MILE DAM (UMAT
3
3.00
2008
Columbia River Gillnet ABOVE BNVILLE NET
10
63.33
2008
Columbia River Gillnet COL R ZONE 5 NET AREA 5
1
2.57
2008
Estuary Sport
2008
Fish Trap (freshwater) THREE MILE DAM (UMAT
2008
Freshwater Net
2008
Freshwater Sport
COLUMBIA R ESTUARY
3
9.01
13
13.00
DRANO LK (SKAM)
1
0.00
UMATILLA R SPORT SEC-1
1
1.00
74
RMIS -- User Guide
MAR 2012
SURVIVAL AND CONTRIBUTION RATE (CWT GROUPS)
Report characteristics:
•
•
•
•
tabular format, organized by Species, CWT groups (see RAR Tag-List grouping in Ch. 8)
shows number CWT released, ‘contribution’ into Management-Fisheries, ‘expanded escapement’ rate,
and ‘total expanded recovery’ rate for each Tag Code release
aggregates by columns: Tag Code
sorts by columns: Species, CWT group number, Tag Code.
Example output listing:
Survival and Contribution Rate (groups)
Run Date: 2012-03-16
Tag List: Umatilla Basin
Species: Chinook
Group Name
Release Site: COLUMBIA R-5
Release Site: COLUMBIA R-5
Release Site: COLUMBIA R-5
Release Site: COLUMBIA R-5
Release Site: UMATILLA R
Release Site: UMATILLA R
Release Site: UMATILLA R
Release Site: UMATILLA R
Release Site: UMATILLA R
Release Site: UMATILLA R
Release Site: UMATILLA R
Release Site: UMATILLA R
Release Site: UMATILLA R
Release Site: UMATILLA R
Release Site: UMATILLA R
Release Site: UMATILLA R
Tag Code
B50312
B50313
B50314
B50315
Hatchery Name
SOC SEC PENS (MCNARY
SOC SEC PENS (MCNARY
SOC SEC PENS (MCNARY
SOC SEC PENS (MCNARY
Release Site
COLUMBIA R-5
COLUMBIA R-5
COLUMBIA R-5
COLUMBIA R-5
BrYr
1985
1985
1985
1985
073162
073327
073833
073834
073835
073836
073837
073838
073839
073840
073841
073842
BONIFER POND
IRRIGON HATCHERY
IRRIGON HATCHERY
IRRIGON HATCHERY
IRRIGON HATCHERY
IRRIGON HATCHERY
IRRIGON HATCHERY
IRRIGON HATCHERY
IRRIGON HATCHERY
IRRIGON HATCHERY
IRRIGON HATCHERY
IRRIGON HATCHERY
UMATILLA R
UMATILLA R
UMATILLA R
UMATILLA R
UMATILLA R
UMATILLA R
UMATILLA R
UMATILLA R
UMATILLA R
UMATILLA R
UMATILLA R
UMATILLA R
1984
1984
1985
1985
1985
1985
1985
1985
1985
1985
1985
1985
# CWTs
Released
50,840
54,598
52,387
52,946
Average
30,838
88,396
20,636
21,335
20,690
20,170
20,982
20,815
21,659
20,269
20,895
21,694
Average
Expanded
Fishery
Contribution
Rate
0.0029
0.0019
0.0023
0.0014
0.0021
Expanded
Escapement
Rate
0.0001
0.0004
0.0004
0.0014
0.0006
Total
Expanded
Recovery
Rate
0.0029
0.0023
0.0027
0.0028
0.0027
0.0063
0.0294
0.0050
0.0037
0.0032
0.0041
0.0028
0.0032
0.0053
0.0051
0.0027
0.0042
0.0063
0.0004
0.0027
0.0024
000000
0.0004
0.0011
0.0021
0.0003
0.0002
0.0005
0.0034
0.0002
0.0011
0.0067
0.0321
0.0074
0.0038
0.0036
0.0052
0.0050
0.0035
0.0054
0.0056
0.0061
0.0044
0.0074
Species: Steelhead
Group Name
Release Site: LTL SHEEP CR (IMNAHA
Release Site: LTL SHEEP CR (IMNAHA
Tag Code
Hatchery Name
073760
IRRIGON HATCHERY
073761
IRRIGON HATCHERY
Release Site
LTL SHEEP CR (IMNAHA
LTL SHEEP CR (IMNAHA
# CWTs
BrYr Released
1985
28,491
1985
28,527
Average
Release Site: SPRING CR (WALLOWA R
Release Site: SPRING CR (WALLOWA R
Release Site: SPRING CR (WALLOWA R
Release Site: SPRING CR (WALLOWA R
073762
073763
073801
073802
SPRING CR (WALLOWA R
SPRING CR (WALLOWA R
SPRING CR (WALLOWA R
SPRING CR (WALLOWA R
1985
1985
1985
1985
IRRIGON HATCHERY
IRRIGON HATCHERY
IRRIGON HATCHERY
IRRIGON HATCHERY
28,610
29,766
28,518
28,303
Average
Expanded
Total
Fishery
Expanded Expanded
Contribution Escapement Recovery
Rate
Rate
Rate
0.0042
0.0039
0.0081
0.0026
0.0041
0.0067
0.0034
0.0040
0.0074
0.0105
0.0115
0.0036
0.0062
0.0080
0.0050
0.0051
0.0032
0.0032
0.0041
0.0155
0.0165
0.0068
0.0094
0.0121
75
RMIS -- User Guide
MAR 2012
CONTRIBUTION RATE (COMBINED FISHERIES)
Report characteristics:
•
•
•
•
tabular format across Recovery Years
shows Estimated Number and, ‘contribution’ rate into customized Management-Fishery categories
(groups) using a combined-fishery (created by the user, see Ch. 9 above)
aggregates by columns: Management-Fishery group number
sorts by columns: Management-Fishery group number.
Example output listing:
Contribution Rate (combined fishery)
Run Date: 2012-03-16
Tag List: Umatilla Basin
Combined Fishery: Gear Types 1
Recovery Years
Fisheries
Ungrouped Fisheries
1986
# %
1987
# %
1988
# %
1989
# %
1990
# %
1991
# %
79.1
64.9
27.9
2.6
582.7
20.4
487.1
26.7
96.8
17.0 24.1
58.1
All-Troll
4.7
3.9
58.7
5.6 1,024.6
35.9
491.5
26.9 190.0
33.3 14.1
34.0
All-Net
38.0
31.2
586.7
55.6
990.1
34.7
804.1
44.0 255.8
44.8
3.3
8.0
0.0
0.0
382.8
36.2
256.1
9.0
43.0
4.9
0.0
0.0
All-Sport
Total Recoveries
2.4
28.2
121.8 100.0 1,056.1 100.0 2,853.5 100.0 1,825.7 100.0 570.8 100.0 41.5 100.0
Contribution Rate = total # of estimated recoveries in fishery for recovery year / total # of recoveries in all fisheries and escapement for recovery year
Chapter 11 RAR Fishery Recovery Report
The RAR Fishery recovery report is described and illustrated as follows:
• based on inputs of:
o user created RAR Combined-Fishery object (described in Ch. 9)
o one Species
o range of Recovery Years;
• produces a complete table of observed and estimated recoveries for each Tag Code
release as distributed into the Management-Fishery categories defined in the RAR
Combined-Fishery;
• aggregates by columns: Management-Fishery group number, Tag Code;
• sorts by columns: Management-Fishery group number, Brood Year, Recovery Year, Tag
Code.
Example output listing:
76
RMIS -- User Guide
MAR 2012
Fishery Recovery
Run Date: 2012-03-16
Combined Fishery: Coastal—2
Species: Chum
Recovery Year: 2000 to 2002
Fishery Group: #1 Washington Troll
Species: Chum
Strata
2002
BY
1998
Tag Code
183850
Release Site
R-Chehalis R
Hatchery
H-Chehalis River H
Stock
S-Chehalis R
# Observed
1
# Estimated
2
1998
183851
R-Chehalis R
H-Chehalis River H
S-Chehalis R
1
2
1998
183852
R-Chehalis R
H-Chehalis River H
S-Chehalis R
1
2
1999
184543
R-Inch Cr
H-Inch Creek H
S-Inch Cr
1
2
1999
184545
R-Sliammon R
H-Sliammon River H
S-Sliammon R
3
7
Fishery Group: #3 SE Alaska Troll
Species: Chum
Strata
2001
BY
1997
Tag Code
0401010308
Release Site
NAKAT INLET 101-11
Hatchery
NAKAT INLET
Stock
NEETS BAY
# Observed
3
# Estimated
0
1998
0401031406
NAKAT INLET 101-11
NAKAT INLET
NEETS BAY
1
0
# Observed
1
# Estimated
0
1
0
Fishery Group: #4 High Seas
Species: Chum
Strata
2000
BY
1997
Tag Code
0401010307
Release Site
NAKAT INLET 101-11
Hatchery
NAKAT INLET
Stock
NEETS BAY
2001
1998
184045
R-Inch Cr
H-Inch Creek H
S-Inch Cr
Chapter 12 APPENDIX
12.1 Explanation of RSR, TA3 Report
The TA3 report is designed to provide a high-level aggregation of recoveries to assist with
Selective Fishery Evaluation Committee (SFEC) analyses. The report provides a custom
aggregation of recovery record counts (observed) by Tag Code and specially defined conceptual
region (SFEC-Region) and type of fishery (SFEC-FisheryType) where SFEC-Region is a
geographic entity based on PSC format fields Recovery Location Code and/or PSC Region code;
SFEC-FisheryType is a broad fishery categorization value based on PSC format field Fishery.
Report characteristics:
•
•
•
Tabular, fixed-field line format
aggregates by columns: Tag Code, SFEC Region, SFEC FisheryType
sorts by columns: Tag Code, SFEC Region, SFEC FisheryType.
where SFEC Region, SFEC FisheryType are described as follows:
•
SFEC-Region: This comprises the following broadly categorized regions for SFEC
purposes:
o
o
ALASKA: all one category
BRITISH COLUMBIA:
BC Marine North (where Recovery Location Code contains ‘2MN...’)
BC Marine South (where Recovery Location Code contains ‘2MS...’)
77
RMIS -- User Guide
o
o
o
o
MAR 2012
WASHINGTON:
Columbia River (where RMIS Region is: LOCR, CECR, UPCR, SNAK)
Washington (includes all other WA recovery locations)
Columbia River (where RMIS Region is: LOCR, CECR, UPCR, SNAK)
Oregon Coast (includes all other OR recovery locations)
IDAHO: Columbia River (where RMIS Region is: UPCR, SNAK)
OREGON:
CALIFORNIA: all one category
SFEC-FisheryType: Only PSC Fishery values that fall into defined ‘commercial’ or ‘sport’
categories are included in the report. (i.e. those in series ranges: 10 – 19, 20 – 29, 40 –
49). All other fishery categories are considered not relevant and are excluded
from the report.
•
12.2 Table of RAR CRAS1 Management-Fisheries
The following table of fisheries is used in the RMIS Analysis Reporting system. These
Management-Fisheries are ‘mapped’ to PSC Fishery codes and Recovery Sites coast-wide in the
RMIS CWT database using a translation known as ‘CRAS1’. CRAS1 has been used in research
and analysis at the Northwest Indian Fisheries Commission (NWIFC), and by other fisheries
analysts throughout the Pacific Northwest. The RMIS Analysis Reporting system can be modified
to accommodate additional fishery-to-Recovery-Site translations.
Management
Fishery Code
01
Management Fishery Name
Southeast Alaska Troll
Management
Fishery Code
49
Management Fishery Name
Lummi Bay Net (WA Area 7D)
02
Southeast Alaska Net
50
Juan de Fuca Troll (WA Areas 5, 6,6C, 7,7A)
03
Southeast Alaska Sport
51
WA Area 5 Sport
04
North British Columbia Troll
52
WA Area 6 Sport
05
Central British Columbia Troll
53
Juan de Fuca Net (WA Areas 4B,5,6,6A,6C)
06
North/Central British Columbia Sport
54
Dungeness Net (WA Area 6D)
07
North British Columbia Net
55
WA Area 8 or 8-1 Sport (Skagit)
08
Central British Columbia Net
56
Skagit Marine Net (WA Area 8)
09
NW Vancouver Island Troll
57
WA Area 8-2 Sport (Stillaguamish-Snohomish)
10
SW Vancouver Island Troll
58
Stillaguamish/Snohomish Net (WA Area 8)
100
Southern British Columbia Troll
59
Tulalip Bay Net (Area 8D)
101
Canada General Net
60
WA Area 9 Sport (Discovery-Admiralty)
11
West Coast Vancouver Island Sport
61
WA Areas 6B and 9 Net
12
West Coast Vancouver Island Net
62
WA Area 9A Net (Port Gamble Bay)
13
Georgia/Juan de Fuca/Johnstone Str. Troll
63
WA Area 10 Sport (Seattle-Bainbridge)
14
Georgia/Juan de Fuca/Johnstone Str. Sport
64
WA Area 11 Sport (Tacoma-Vashon)
15
Georgia/Johnstone Straits Net
65
WA Area 10 Net
16
Fraser River Net
66
WA Area 10A Net
17
Juan de Fuca Net (Canadian Area 20)
67
WA Area 10B, 10C, 10D, 10F, 10G Net
18
WA Areas 4 and 4B Troll (Cape Flattery)
68
WA Area 10E Net
19
WA Area 4 Sport (Neah Bay)
69
WA Area 11 Net
20
WA Area 3 Troll (Quileute)
70
WA Area 11A Net
78
RMIS -- User Guide
MAR 2012
21
WA Area 3 Sport (La Push)
71
WA Area 12 Sport
22
WA Area 2 Troll (Grays Harbor)
72
Hood Canal Net (WA Areas 12,12B,12C,12D)
23
WA Area 2 Sport (Westport)
73
Quilcene Bay Net (WA Area 12A)
24
WA Area 1 Troll (Columbia River Mouth)
74
WA Area 13 Sport (South Sound)
25
WA Area 1 Sport (Illwaco)
75
WA Area 13 Net
26
North Washington Coastal Marine Net
76
WA Area 13A Net
27
Grays Harbor Net
77
WA Area 13C Net
28
Willapa Bay Net
78
WA Area 13D Net
29
Buoy 10 Sport
79
WA Areas 13E-13K Net
30
Tillamook Troll
80
Freshwater Sport
31
Tillamook Sport
81
Freshwater Net
32
Newport Troll
82
Juvenile Catch
33
Newport Sport
83
High Seas Catch
34
Coos Bay Troll
84
Freshwater Escapement
35
Coos Bay Sport
85
Alaska Coast Recovery
36
Brookings Troll
86
Gear and Location Unknown
37
Brookings Sport
87
BC General-Troll
38
Crescent City Troll
88
Oregon General-Troll
39
Crescent City Sport
89
Oregon-Calif General-Troll
40
Eureka Troll
90
California General-Troll
41
Eureka Sport
91
Alaska-Unknown or Mixed Gear
42
Fort Bragg Troll
92
Oregon-Unknown or Mixed Gear
43
Fort Bragg Sport
93
Columbia R-Unknown or Mixed Gear
44
Southern California Troll
94
California-Unknown or Mixed Gear
45
Southern California Sport
95
Washington General-Net
46
WA Area 7 Sport
96
Oregon Test Fishery
47
San Juan Net (WA Areas 7 and 7A)
97
Canada Aboriginal
48
Nooksack/Samish Net (WA Areas 7B, 7C, 7E)
98
Oregon General-Sport
79