1
User Manual
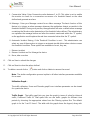
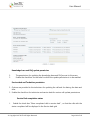
total, maximum, minimum, and average traffic values for this interface for the selected
time period.
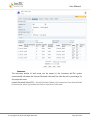
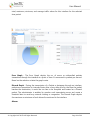
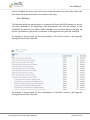
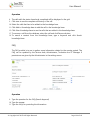
Error Graph - The Error Graph depicts the no. of errors or mishandled packets
transmitted through the interface at a point of time. It’s measured in packets per second.
Based on the selection criteria the graph varies.
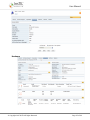
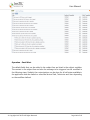
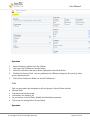
Discard Graph - During the transmission of a Packet or datagram through an interface,
packets are transmitted to intended hosts after a long delay and by the time the packet
reaches the destination, it would be too late to be accepted and treated as a Discard
packet. The administrator is enabled to monitor such transmission errors and create a
threshold alert to avoid any network choking or congestion. The Discard Graph depicts
the maximum or minimum of such discard’s monitored in the interface
Alarms
© Copyright 2007 InsTIL. All Rights Reserved
Page 61 of 166