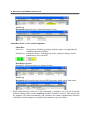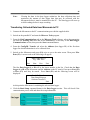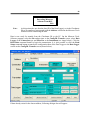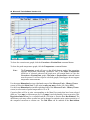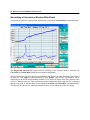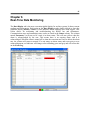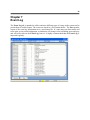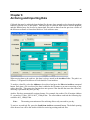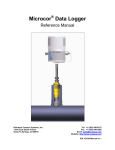
1
® Microcor Tools Version 4.0.0 User Manual Rohrback Cosasco Systems Inc. Tel: (1) 562-949-0123 11841 East Smith Ave Fax: (1) 562-949-3065 Santa Fe Springs, CA 90670 E-mail: [email protected] Web Site: www.rohrbackcosasco.com P/N: 100156-Manual Rev C Microcor®, µcor®, Corrdata®, Corrosometer®, and Corrater® are trademarks of Rohrback Cosasco Systems, Inc. Windows® is a trademark of Microsoft Corporation. i Table of Contents CHAPTER 1 INTRODUCTION AND INSTALLATION ................................................................3 CHAPTER 2 CONFIGURATION AND SETUP ...........................................................................7 CREATE, SELECT AND REMOVE SITES .......................................................................................................... 7 CONFIGURING SITE AND INSTRUMENT LOCATIONS ......................................................................................... 8 CHAPTER 3 ONLINE DATA COLLECTION.............................................................................15 STARTING AND STOPPING DATA COLLECTION.............................................................................................. 15 TESTING CHANNELS ................................................................................................................................... 21 CHAPTER 4 DATA COLLECTION FROM DATA LOGGER ....................................................23 CONFIGURATION OF DATA LOGGERS WITH PC ............................................................................................ 23 DATA COLLECTION FROM DATA LOGGERS WITH PC..................................................................................... 24 CONFIGURATION OF DATA LOGGERS WITH MICROMATE ............................................................................... 26 DATA COLLECTION FROM DATA LOGGERS WITH MICROMATE ....................................................................... 32 TRANSFERRING COLLECTED DATA FROM MICROMATE TO PC....................................................................... 35 CONFIGURATION OF DATA LOGGERS WITH CHECKMATE DL ......................................................................... 38 DATA COLLECTION FROM DATA LOGGERS WITH CHECKMATE DL.................................................................. 40 TRANSFERRING COLLECTED DATA FROM CHECKMATE DL TO PC................................................................. 42 CHAPTER 5 RETRIEVING AND PLOTTING DATA (HISTORY VIEWER) ..............................47 MICROCOR TRANSMITTERS (MT 9485, MT 9485A)..................................................................................... 47 E9020 TRANSMITTER (E9020)................................................................................................................... 49 ZOOM COMMANDS ..................................................................................................................................... 50 GENERATING A CORROSION OR EROSION RATE GRAPH............................................................................... 52 DATA CURSOR ........................................................................................................................................... 53 POINT TO POINT CALCULATIONS ................................................................................................................. 54 GENERATING A STATUS REPORT ................................................................................................................ 55 CHAPTER 6 REAL-TIME DATA MONITORING.......................................................................57 CHAPTER 7 EVENT LOG.........................................................................................................59 CHAPTER 8 ARCHIVING AND IMPORTING DATA ................................................................61 ii Microcor® Tools Software Version 4.0.0 Appendices APPENDIX 1 – ALLOY MULTIPLIERS .....................................................................................63 APPENDIX 2 – MODBUS CONFIGURATION ...........................................................................65 APPENDIX 3 – OPC CONFIGURATION ...................................................................................69 WORKGROUP VS. DOMAIN SETUP ............................................................................................................... 69 CONFIGURE THE OPC SERVER COMPUTER OR THE IIU ON A DOMAIN/WORKGROUP ..................................... 70 SET UP OPC SERVER OR THE IIU FOR A WORKGROUP NETWORK ENVIRONMENT ......................................... 71 1. OPC Server or the IIU on a Workgroup Network – IIU Default .....................................................................71 2. Setup Automatic Logon – IIU Default .............................................................................................................73 SETUP THE STATIC INTERNET PROTOCOL (IP) ADDRESS ............................................................................. 74 WINDOWS FIREWALL SETUP ....................................................................................................................... 76 SETUP WINDOWS FOLDER PROPERTIES: DISABLE “USE SIMPLE SHARING” – IIU DEFAULT ............................ 76 INSTALL MICROCOR TOOLS SOFTWARE AND OPC SERVER APPLICATION – IIU DEFAULT .............................. 77 SETTING UP DCOM PROPERTIES FOR WORKGROUP NETWORKS ONLY – IIU DEFAULT ................................. 78 LAUNCHING OPC SERVER OR THE IIU ........................................................................................................ 82 USING THE PREINSTALLED OPC CLIENT TEST UTILITY ON RCS IIU TO TEST THE OPC SERVER ................... 85 TROUBLESHOOTING ................................................................................................................................... 87 Microcor® Tools Software Version 4.0.0 3 Chapter 1 Introduction and Installation The Microcor Tools Software enables users to collect, save, transfer and display corrosion information from Microcor Transmitters and Data Loggers, and Corrater E9020 Transmitters. It is available in two versions: 1. Microcor Tools Standard 2. Microcor Tools - Output Interfaces The Microcor Tools Standard version is a stand-alone software package for installation on your computer to provide data retrieval, storage, and graphical presentation of results from Microcor and E9020 Corrosion Transmitters and Data Loggers. Microcor Tools - Output Interfaces is an enhanced version of the software which provides Modbus and OPC out put interfaces for data transfer from Microcor and E9020 on-line transmitters to Distributed Control Systems (DCS), Process Control Systems (PCS), or Supervisory Control and Data Acquisition (SCADA) systems. This software package is included on RCS Supplied hardware such as the Intelligent Interface Unit (IIU). See separate hardware manual for more details. The Microcor Tools Software CD comes with the software installation package, manuals, and datasheets for PC installation. Insert the CD in the CD-ROM drive and the AutoPlay feature will open the welcome page which will provide links to the Software Installation files, User Manuals, and Datasheets. To install the software, click the Install button. If the AutoPlay feature is disabled, browse to the MicrocorTools.exe file on the CD and double click, then follow the onscreen instructions to finish the install. Microcor Tools Software is now ready for use. If the default install settings are kept (recommended) when installing the Microcor Tools Software, all associated files will be installed in the C:\Program Files\MicrocorTools directory. Microcor Tools Software is not designed as a client/server application but it may be operated on a Network with some minor limitations. The database may be read by multiple computers, but the basic configuration file modb.CFG and data may only be written to by one PC at any one time. If requirements exist for making the database of the Microcor Tools available to multiple computers or if the database is to be stored on a server, the location of the database can be changed as follows: If for example the database is to be stored on a backup server that is mapped to the local computer such as in the directory path Z:\Userdata\Microcor proceed as follows: 1. Create a MicrocorToolsDatabase subfolder in the Z:\Userdata\Microcor. 4 Microcor® Tools Software Version 4.0.0 2. Find the dataT.cfg file (the default location is C:\Program Files\MicrocorTools unless). and rename it to data.cfg 3. Right-click the data.cfg file and select Open with to edit the content with Notepad or WordPad (shown below): Following Microsoft dialog boxes may appear: Choose Open With… and the following dialog box will open: 5 Choose Select the program from a list and click OK. Choose Notepad or WordPad from the next screen to proceed to edit the data.cfg file. 4. When the Notepad editor opens, change the path C:\aa with the following path Z:\Userdata\Microcor\MicrocorToolsDatabase (shown below) and Save and Exit. Note: If the Microcor Tools Software program has already been used and data has been collected, then this collected data can be transferred to the new shared database location. Copy the data file directory (not the newly renamed data.cfg file) from C:\Program Files\MicrocorTools to the new directory. It is also possible to share the database when a single computer is shared amongst multiple users. Simply choose a shared location such as Shared Documents of the All Users profile for the database and follow the above procedure. 6 Microcor® Tools Software Version 4.0.0 7 Chapter 2 Configuration and Setup To launch the Microcor Tools program, click Start Æ All Programs Æ RCS Æ Microcor Tools. Onscreen help is accessible by clicking on the Help button. Create, Select and Remove Sites A Site is a collection of up to 100 corrosion-monitoring locations. The corrosion information for these locations can be provided from the following data sources: - Online data collection via the RS485 network from Microcor Transmitters - Online data collection via RS485 network from Corrater E9020 Transmitters - Offline data input from Microcor Data Loggers or data-transfer units - Offline data imported from archives or files, or the previous versions of Microcor software. Create a Site Select the New Site option button and type a name in the text box (Existing Sites option button is selected by default). Click the Create Site command button. 8 Microcor® Tools Software Version 4.0.0 Select an Existing Site Select the Existing Sites option button, open the list box and click on the desired site name. Remove a Site Select the Existing Sites option button, open the list box and click on the desired site name. Click the Remove command button to remove the site. Use the Save command button at the bottom of the screen to store all settings for the selected site. Configuring Site and Instrument Locations 1. Create a new site or use the Site list box on the Site/Communications tab to select a site. 2. Click the Config/DL Transfer tab to select the configuration screen. 9 3. Locate the Address area. Use the Up/Down control or type the number in the text box. If the data source for this location is an online transmitter, the Address must be equal to the transmitter address. Internally, each transmitter has a DIP switch with a selectable address (0 to 99 for Model MT 9485A and E9020 and 0 to 31 for Model MT 9485. The preset address is marked on the outside of the transmitter as the IN# or Instrument Number. See the transmitter manual for more details. If the data source is a data logger or data-transfer unit, RCS recommends that the IN # of the transmitter connecting to the data logger is used. 4. Complete the Description field with the provided free-format text description area to meaningfully identify the location (optional). 5. Proceed to the Connection, Instrument and Rate/Alarms Settings area. Click the check box to select either Online or Data Logger data transfer method. Supported transmitters are Microcor (MT 9485A and Microcor MT 9485) and Corrater E9020. E9020 transmitters are used with Online connections only. Note: To be able to check the Data Logger checkbox, it is first necessary to select the COM port in the Data Logger section of the Site/Communication tab and click the start button. Note: It is important to ensure that the “Hibernate,” “System Standby” and “Turn off hard disks” on the Windows Power Options is turned to “Never” so data collection will not be interrupted on Online systems. The Rate/Alarms Settings command button opens the following screen: 10 Microcor® Tools Software Version 4.0.0 Users can choose to enable the alarm by selecting the CR/ER Alarm Enabled button. However, it is important to note that this feature is only relevant when used on Online systems. Alarm Level can be changed by typing in the desired value. The measurement units are specified to the right of the alarm level value and this can be changed in the Graphical Display (History Viewer) screen (click on the Show Data command button; see the Retrieving and Plotting Data (History Viewer) section for more details). Once the alarm is activated, the Parameter 3 column on the Data Display screen will turn red if the corrosion rate exceeds the set alarm rate. A blinking red/gray indicator will replace the green indicator on the status bar located on the bottom of the Microcor Tools application screen (see the section on the Online Data Collection below for more details). The standard method for corrosion rate calculations is by Linear Regression which can be changed by checking the 24h Filter. Checking the 24h Filter adds a 24 hour filter specifically to reduce the effects of any diurnal (24) thermal noise. Linear Regression values are adjustable and can be set on the Graphical Display (History Viewer) screen. 6. Proceed to and complete the Probe section once the above selections are made. Type and Element are optional informational fields which will be useful later when reviewing the corrosion/erosion data. It is possible to type content in on these fields if the probe information does not exist or if customization is desired. Probes designated with type “M” are used for corrosion monitoring and type “S” are used for erosion monitoring. 11 Span [mils] is the useable life of the probe element. This is always defined in units of mils and is one half of the probe element thickness (i.e. F10 or T10 probes have a 5 mil span). This required field is used to define the physical scale of the metal loss graph. The appropriate Span is automatically set when the Probe Element is chosen from the drop down menu; however, users may change the Span by typing in a different value if necessary. If the required Probe Element is not in the list, choose BLIND as the Element, which will set the Span to 1; this can be changed as needed. Note: The BLIND setting may also be used with the Microcor Tools – Output Interfaces version when used on blind Intelligent Interface Units. This allows scaling changes for different probe spans to be accommodated internally on the IIU such as in DCS or SCADA systems. 7. Proceed and complete the Transmitter section (this information is necessary for both Online and Data Logger connection types). Sampling Interval is used to set the data-record frequency. For Online metal loss (Microcor) transmitters (MT 9485A and MT 9485) the minimum recommended setting is 2 minutes. A typical Sampling Interval would be 5 minutes, which will yield 12 readings per hour. For corrosion rate transmitters (E9020), the Sampling Interval should be 5, 10, 15 or 20 minutes, depending on the selected cycle time. For Microcor Transmitters driven by Data Loggers, where battery consumption is a consideration, a Sampling Interval of 3 hours (180 minutes) is usually selected. This gives a battery life of up to one year, and still provides eight readings per day. The minimum recommended Sampling Interval for Data Loggers is 30 minutes with the maximum setting at 1440 minutes (one day). Tag is an optional free-format text field used to identify the probe, which provides labeling on the graphical display (History Viewer) screen. 12 Microcor® Tools Software Version 4.0.0 Check the Probe Temperature check-box if the transmitter has the probe temperature measurement capability and if the function is enabled by the internal transmitter DIP switch (see transmitter manual for details). Temperature measurement is available only on certain probe models. Select (type in) values for Zero and Gain to calibrate the measurement. If calibration parameters are unknown for probes and transmitters, select 0 for Zero and 31 for Gain. If the probe-temperature measurement function in the transmitter is not enabled or the transmitter does not support probe-temperature measurements uncheck the Probe Temperature check-box. The E9020 Setup command button opens the following configuration screen: The two sections represent the settings stored in the computer and in the instrument. The command buttons with arrows provide transfer of the settings in both directions: - from the PC to E9020 - from E9020 to the PC To store the new configuration from the database to the E9020, choose the bottom arrow pointing to the right. To read the current configuration of the E9020, choose the top button with the arrow pointing left. Cycle Time is used to set the desired measurement cycle time. For water with conductivities greater than 100 µS, any cycle time of 5 minutes or more should be satisfactory. For lower conductivity water, or when filming type inhibitors are in use, it is recommended that the 20 minute cycle time be selected first. After consistent readings are obtained, then a shorter time cycle can be selected as long as the readings do not increase substantially (>5%) over the readings taken with a 20 minute cycle. Set the Alloy Multiplier to the appropriate multiplier value for the metal or alloy of the electrodes as shown in the chart of Appendix 1. The E9020 setup allows the user to choose from either the Corrosion Rate or the Potential and Current Noise Measurement. Contact RCS for more information regarding the Potential and Current Noise Measurement feature. 13 The default selection on the E9020 setup for the Electrode type is Standard. Keep the selection Standard if using a probe with protruding 5.0 square centimeter electrodes or select Flush if using a probe with flush 0.5 square centimeter electrodes. The Transmitter Test command button is enabled for Online connections. It sends requests to the transmitter and displays returned data in the Answer text field if the communication is successful. 8. If using data loggers, first make a complete list of the IDs (Address), Tags and descriptions to be used. This will help organize and manage sites. Note: The ID (address) of the data logger is independent of the address of the transmitter to which it is connected. The data logger communicates with a transmitter irrespective of the transmitter address. The ID (address) of the data logger is allocated by this software or from the Mate or Mate II during configuration of the data logger in order to segregate the different sets of data. 9. The Microcor Tools software allows the direct connection from a PC to a data logger, (this may be used ONLY in an electrically safe area). Alternatively, the data loggers can be programmed and data retrieved with the intrinsically safe Mate or Mate II instrument programmed in Micromate mode or with a Checkmate DL programmed for Microcor Systems, then the data can be transferred to the PC in the safe area. 10. When using a direct PC-to-data logger connection, the data logger screen below is used for configuration and data retrieval after the Com Port # is enabled in the Data Logger Communication section in the Site/Communications tab. Setup Commands: Read Setup command button – reads and displays the data logger setup and status information. Use this command to check the settings of the data logger before the data transfer. Store Setup command button – reads the Tag and Sampling Interval settings from the Transmitter section and stores this information to the Data Logger. It will also set the data logger ID equal to the selected Address, and the data logger real-time clock to match the computer date and time. Note: Make sure the computer is set to the correct regional settings and time zone in the Control Panel (Classic View). 14 Microcor® Tools Software Version 4.0.0 Data Commands: Read Data command button – reads the collected corrosion information from the data logger and stores it in the computer. Clear Data command button – use this command to delete the data logger memory. When using the Micromate to configure the Microcor Data Logger, see the section on Configuration of Data Loggers with Micromate. Refer to the Checkmate DL User Manual for instructions on configuring Microcor Data Loggers with Checkmate DL. Other Commands: This section is used to handle history information; display, delete, move, and load data from archives. Show Data command button – opens the Microcor Tools – History Viewer (see the Retrieving and Plotting Data (History Viewer) section for more details). Delete Data command button – deletes the corrosion data stored for this location. Move to Archives command button – moves the data file to an “archives” folder. Archive files have automatically assigned names. For example, the archive file of location Address 15, created on 13 May, 2003 is: ch15_13May03.dat. See separate section on Archiving. Load from Archives command button – use this command to load data from archives or import data from previous versions of Microcor. Then use the Show Data command to display the information graphically. This command can also be used to import data from other Microcor files (on the hard drive or floppy disk). Note: Data files (*.DAT) that are imported do not include probe reading interval or probe span details. This must be separately added on the Config/DL Transfer screen. This information is stored in the file (*.SET) of the original data folder. 11. At this point the settings for the current instrument are complete. For the next instrument select new Address and repeat steps 1 to 10. Note: The entries may be made for all of the instruments before saving the settings. However, saving the settings after the entries for each location avoids the chance of losing the data accidentally. To save the configuration on the hard disk, select the Site/Communications tab and click the Save command. 15 Chapter 3 Online Data Collection Starting and Stopping Data Collection For online data collection, use the Online Communication section in the Site/Communications tab. Note: It is important to ensure that the “Hibernate,” “System Standby” and “Turn off hard disks” on the Windows Power Options is turned to “Never” so data collection will not be interrupted on Online systems. Windows Power Options can be found on the Control Panel (Classic View) of the Windows Operating System. 1. Select the Com Port # being used on the computer. 2. Select the baud rate. This depends on the RS232/RS485 converter being used. For MA-1000 converter select 300 baud rate; for any other standard converters select 2400 baud rate. 3. Click the Start command button to turn the communication on. At this point the program commences polling the Online connected transmitters. Real-time information from the transmitters is displayed in the Data Display tab. Use this view for troubleshooting and checking the operation of the transmitters and the RS485 bus. Note: Ensure that the Microsoft Windows “Turn off hard disks”, “System standby” and “System hibernates” are disabled when setting up Online Communication. 4. Click the Start command button in the Data Collection section to start collecting data from the transmitters to their respective data files. One solid green indicator and one flashing green/yellow indicator will appear on the status bar to indicate that the program is collecting data (see images below). If the solid green indicator starts to blink red and gray, then it is indicating that the corrosion rate level of at least one unit has surpassed the set alarm level on the Rate/Alarm Settings area. The Parameter 3 of the unit(s) in alarm status (at the Data Display screen) will turn red and the Event Log will display detailed information of the unit(s). Click on the blinking alarm indicator to acknowledge the alarm. This will stop the blinking and reset the status bar indicator to solid red and the Parameter 3 of the unit(s) in alarm to yellow. This means there is an ongoing alarm, and it is acknowledged. When the 16 Microcor® Tools Software Version 4.0.0 alarm is turned off or when the corrosion rate resets to below the alarm rate, the indicator light will turn to solid green. If a unit enters an alarm status and resets prior to user acknowledgement, red indicator will change color to blinking green and gray and will reflect this on the Event Log; hence it is highly recommended that the Event Log is inspected regularly. Normal Operation Status Bar: First Icon – Group Alarm - Solid green, indicates active data collection and corrosion rate level below alarm value Second Icon - Transmitter Status - Flashing green/yellow, indicates reading of probe transmitters is active (normal) Data Display Screen: Corrosion rate level below alarm value so no alarm activity shown. Event Log Screen: Communication is okay. 17 Active Alarm Status Bar: First Icon – Group Alarm - Flashing red/gray, indicates corrosion rate level of at least one unit has surpassed the set alarm value Second Icon - Transmitter Status - Flashing green/yellow, indicates reading of probe transmitters is active (normal) Data Display Screen: Parameter 3 will turn red to indicate active alarm status. Event Log: Alarm status is recorded on the Description area. Alarm Acknowledged Status Bar: First Icon – Group Alarm - Solid red, indicates user acknowledged the alarm but the alarm condition still persists. This will turn to solid green when the alarm is turned off or when the conditions return back to normalcy Second Icon - Transmitter Status - Flashing green/yellow, indicates reading of probe transmitters is active (normal) Data Display Screen: Parameter 3 will turn yellow to indicate user acknowledgment of tripped alarm. 18 Microcor® Tools Software Version 4.0.0 Event Log: Description changed to show “Alarm Recognized” status. Alarm Reset Prior to User Acknowledgement Status Bar: First Icon – Group Alarm - Flashing green/gray, indicates alarm was tripped but the condition returned to normalcy Second Icon - Transmitter Status - Flashing green/yellow, indicates reading of probe transmitters is active (normal) Data Display Screen: Parameter 3 will turn not show any change of status Event Log: Description will record the date, time and ID of the unit(s) which was in alarm status 5. When using Microcor Tools for on-line monitoring, it should be set up in the Microsoft Windows Startup folder and the Autostart checkbox should be checked. This ensures that the program will restart automatically and commence the online communication and data collection when the computer is restarted after maintenance or power failure. 19 Note: Users may require Power User or Administrative privileges to perform the below operations and should always consult your organization’s IT Department for assistance and permissions. To add Microcor Tools to the Windows Startup folder, copy the Microcor Tools icon form the desktop and paste it in the C:\Documents and Settings\All Users\Start Menu\Programs\Startup directory. Alternatively, users may navigate to Start Æ All Programs Æ RCS and right click on Microcor Tools and select Pin to Start Menu as shown below: 6. The Auto Archiving feature is designed for computers or embedded computers as in the RCS IIU with limited storage resources. If the Auto Archiving is selected, when a site collects 2MB of data (approximately 48,620 readings or 67 days of continuous data collection (temperature data collection enabled) at a sampling interval of 2 minutes), the data file is automatically transferred into the archives folders replacing the previously stored data file, and the current data file will be cleared for collection of new data. Note: When Auto Archiving is enabled, Microcor Tools initiates automatic archiving when the file reaches its limit, previous automatically stored archives will be deleted. This process will not delete any manually archived files. 7. On the Microcor Tools - Output Interface release used on the RCS Intelligent Interface Unit, users can set up data communication with other computers. Click the Interfaces button to enter the setup screen shown below. Select the desired method of transfer and configure the fields if necessary. Click the Enabled radio button and Save Configuration button prior to pressing Exit. 20 Microcor® Tools Software Version 4.0.0 Typically, only one interface, either Modbus or OPC, is used at a time. However, it is possibly to use both output interfaces at the same time, if required. Microcor Tools acts as a Modbus slave, and its address is set in the device window. The Com port should be set to correspond to the hard wired connection to the Modbus Master. If Microcor Tools is supplied on an RCS computer or embedded PC, the Modbus communications may be via RS 232, two- or four wire-RS 485, according to the unit ordered. Most commonly Remote Terminal Unit (RTU) binary protocol is used for economy of transmission data length. This, and the baud rate, parity, data bits, and stop bits should be set to match the Modbus master with which it is communicating. The Modbus addresses and data format is shown in Appendix 2). The OPC Interface is a Microsoft standardized database interchange protocol which uses the computers network interface card (NIC) to communicate via the network. Also included with the Microcor Tools Software - Output Interface option is a simple OPC Client Test Utility which enables testing of the OPC output. See Appendix 3 for further details. 8. To view the collected data, switch to Config/DL Transfer screen and change the Address to the desired ID. Click on the Show Data command button to open the Microcor Tools – History Viewer (see the Retrieving and Plotting Data (History Viewer) section for more details)). An alternate method is to switch to Data Display screen and double click on the desired Tag to open the Microcor Tools – History Viewer. 21 Testing Channels Individual transmitter channels may be checked with the Transmitter section on the Config/DL Transfer screen. 1. Click the Transmitter Test command button. 2. Successful transmission will return raw data and display it in the Answer text field. If communication with the selected transmitter fails, a “No Answer” error message will be generated in the status bar located at the bottom of the screen. If an error message occurs, check the following: ¾ All connections are correct. ¾ The correct Com Port # is being used and that the Online Communication has been started on the Site/Communications screen. ¾ The transmitter Address (or Instrument #) is correct. ¾ There is power to the transmitter. ¾ The system is connected properly. 3. Repeat the test by pressing Transmitter Test again. 4. Repeat as required for other RS485 locations. 22 Microcor® Tools Software Version 4.0.0 23 Chapter 4 Data Collection from Data Logger 1. For data loggers installed in non-hazardous areas, the configuration and data retrieval may be done directly with a portable PC. 2. For data loggers installed in hazardous areas, the configuration and data retrieval is made with the intrinsically safe Corrdata Mate or Mate II Data Transfer units running Micromate software or with the Checkmate DL handheld instrument programmed for Microcor Systems. Collected data is then transferred to the PC in the safe area. In this case, the Micromate and Checkmate DL emulate each data logger so that the software program retrieves collected data from them as it would from a data logger. Note: To configure a Microcor Data Logger from a Micromate or a Checkmate DL, follow the recommended suggestions below: 1. If a collection of data loggers exist on the PC, prepare a list that contains each data logger and its respective Address and Tag in advance to making the trip to the installed area. 2. Once in the field, connect the Micromate/Checkmate DL to the Microcor Data Logger and perform the programming with the information corresponding to the pre-made list from above. Refer to the Micromate and Checkmate DL User Manuals for more details. Configuration of Data Loggers with PC 1. Connect the PC or portable PC to the data logger with the cable P/N 748204 for data logger Model ML 9500A or cable P/N 748243 for data logger Model ML 9500B. 2. Select the Com Port # being used on the computer and click the Start button. 3. Switch to the Config/DL Transfer screen and select the Address. Click the Data Logger checkbox in the Connection section and configure the transmitter as described previously. 4. Click the Store Setup command button in the Data Logger section. This will populate the text fields in the Data Logger area accordingly. Verify all the text fields including Time and 24 Microcor® Tools Software Version 4.0.0 Date, and Battery for accuracy. Read Setup will interrogate the data logger and display stored values and will enable verification of these stored values. If the data loggers are in a hazardous area, they will need to be configured with the Corrdata Mate or Mate II programmed with the Micromate software or Checkmate DL programmed for Microcor Systems. Make a note of the configuration information as this will have to be entered again into the Micromate or the Checkmate DL. Data Collection from Data Loggers with PC 1. Connect the portable PC to the data logger communications port with cable P/N 748204 for data logger Model ML 9500A or cable P/N 748243 for data logger model ML 9500B. 2. Switch on the portable PC and start the Microcor Tools program. 3. Select the Site from the Existing Sites. Select the Com Port # from the Data Logger Communication section and click Start command button. 4. Switch to the Config/DL Transfer screen. Select the desired Address. 5. Click the Read Setup command button in the Data Logger section. This will interrogate the data logger and display the resulting information in the text fields. The time and date shown in Time and Date box should correspond to the current time. If there is an error or drift in the time this can be corrected with the Store Setup command. The Battery text field should read OK. If it reads Replace, then the battery needs to be replaced and the data MUST be cleared after collection for data collection to recommence. 25 Important Note: When the data logger battery gets too low to drive the transmitter, it shuts off the transmitter, and sets the Battery Replace flag. At this point there may still be enough power in the battery to drive the data logger for some time and even allow downloading of data. The battery must be replaced in order for the transmitter to run again. If the data is not cleared after the battery is replaced, the flag will not be reset and no data will be collected from the transmitter. The Sampling Interval text field should correspond to Sampling Interval in the Transmitter section. 6. Click the Read Data button. If data from this location has already been collected, the following message will appear: - Press Yes to add the new data onto an existing file. This is the normal method if the data in the data logger is deleted after it is collected each time, in order to speed data transfer. It also prevents reaching the maximum storage capacity in the data logger at which time the data collection stops. - Press No if all of the data in the Micromate/Checkmate DL is to replace an existing file. This should be used if the data in the data logger is NOT cleared each time it is read. In this case the existing file is automatically archived. - Press Cancel to exit the Read Data function. Note: The Microcor Data Logger will store up to 8000 readings before collection memory is fully allocated; at this point, collection of data will halt until data is cleared from memory. Note: The normal recommended practice is to collect data and then clear the data in the data logger. The new data is then appended to the stored data file on the PC and the data transfer time is minimized. After a selection has been made, a counter in the status bar indicates the number of samples to be transferred. Status bar will read End of Transfer when the data is successfully transferred from the data logger to the Microcor Tools program. 26 Microcor® Tools Software Version 4.0.0 7. Verify that the data is transferred correctly - click the Show Data command button to display the data with the Microcor Tools – History Viewer. 8. It is recommended to clear the data in the data logger at this point to reduce the data transfer times on later downloads. Click the Clear Data command button to perform this action. 9. Repeat the steps 1 to 8 for each of the data loggers from which data is collected. Make sure that the correct Address is selected for each data logger before loading the data. Note: The data logger checks the battery status during the maximum-load time intervals. If the battery voltage is low, a battery Replace status is set in non-volatile memory. In this state the data logger does not power the transmitter and does not collect data. Other functions and commands such as Read Setup, Store Setup, Load Data, and Clear Data are not affected. The data logger will remain in this state until Clear Data command is executed after replacing the battery. Configuration of Data Loggers with Micromate First, connect the Microcor transmitter and data logger as described in their operating manuals. Ensure that the battery in the data logger is connected. Note: 1. The data logger enclosure is rated explosion proof, with an intrinsically safe RS 232 communications port. When operating the data logger in a hazardous area, a hot work permit will be required to install or replace the battery which is housed in the explosion proof enclosure. Verify that the Corrdata Mate or Mate II is programmed with the Micromate software for use with Microcor Data Loggers. The Corrdata Mate programmed as a Micromate will appear as follows when switched on: Micromate ver 1.00 Free Readings 24500 Mate Battery: OK More If the Corrdata Mate is programmed for operation with Corrosometer and Corrater probes and data loggers, the screen will appear as follows when switched on: ROHRBACK COSASCO SYSTEMS Read 2. Disp Dump Mate Setting up the Corrdata Mate or Mate II with Micromate software is described in steps 3 to 11. If Micromate is already installed on the Corrdata Mate or Mate II, skip to step 12. 27 The Corrdata Mate or Mate II is software programmable. For reasons of memory limitations, the Corrdata Mate or Mate II is programmed either for use with the Corrosometer and Corrater range of probes and data loggers, or with the Micromate software for use with the Microcor range of data loggers. The Mate Programming Utility allows the program in the Corrdata Mate to be changed back and forth if required. This process is also used to set the Time Zone in the Micromate which is required for the correct date and time function of the Microcor Software application. 3. Make sure that the Mate Programming Utility has been installed on the PC. 4. To start the Mate Programming Utility, click Start Æ All Programs Æ RCS Programs Æ Mate Programming Utility. The following screen will appear. 5. From the main menu select CommPort, and click on the Com port you will be using for communication with the Mate. This will usually be Com 1 or Com 2. 6. Click on the Continue button. 28 Microcor® Tools Software Version 4.0.0 7. Select the Quick Mode unless any of the problems described on the image above have occurred. A pop-up screen will then ask if the Mate is already programmed as a Mate or a Micromate. This is because the key selections required to set up a Mate are different from setting up a Micromate. 8. Click the Mate or Micromate button as appropriate. If the unit is already programmed as a Corrdata Mate, which is how new units are shipped, selecting the Mate command button will display the following instructions: 1. Connect Mate to COM Port 1 using Serial Adapter Cable 2. Turn on Mate 3. Press F1 (Read) on Mate 4. Press F2 (MODE) on Mate If the unit is already programmed as a Micromate, the following instructions will be shown: 1. Connect Micromate to COM Port 1 using Serial Adapter Cable 2. Turn on Micromate 3. Press F4 on Micromate (one or two times) until F4 reads OK 4. Press F4 (OK) on Micromate 5. Press F4 (Mate) on Micromate 6. Press F2 (Prog/Mate) on Micromate 29 9. Follow the instructions above and then select the button to program the Mate as Mate or Micromate. In this case we want to choose Make Micromate. A Scroll bar on the PC will indicate the progress on the programming and a scrolling of addressing being programmed on the Mate will show on the Mate screen. Note: If the scroll bar operates on the PC but there is no scrolling of addresses on the Mate, then the Mate is not being programmed. This may be due to a bad connection or a wrong Com port. The PC is not able to indicate such a problem as there is no handshaking between the PC and the Mate during programming. The Mate will beep and indicate when the programming is complete. 10. 11. The programming of the Mate with the Micromate software also sets the Time Zone information into the Micromate automatically from the computer. The correct time zone is required as the underlying data format uses a GMT time reference. Note 1: If you are using the Mate Programming Utility to set the Time Zone into the Micromate software, make sure that the time on your computer is correct and that the Regional Settings in the Control Panel (Classic View) of Windows are correct. Note 2: You can also program the Time Zone manually on the Micromate on startup. Switch on the Micromate. The following screen will appear: 30 Microcor® Tools Software Version 4.0.0 Micromate ver 1.01 Free Readings 24500 Mate Battery: OK More The number of free readings should be 24500 if the Micromate memory is completely clear. If the number is less than 24500, and previously collected data has already been transferred to the PC, then it is best to clear the memory to obtain maximum data collection capacity. See step 13 below. If the Battery indicates LOW then the Micromate batteries need changing. Press More (F4). Standard Time Zone | | DTZ GMT - 8.00 Up Down OK If the Micromate has been programmed from the PC, and the PC is correctly set up for your regional settings and time, then this screen should show the correct time zone with the number of hours from GMT (+ numbers of hours for locations East of London, numbers of hours for locations West of London). Standard Time Zone indicates there is no daylight savings. Daylight Time Zone indicates that Daylight Savings Time is in operation. If any of these settings are incorrect, check your computer and verify time and date settings are correct. On the Micromate, the number of hours east or west of London may be changed with the Up (F3) and Down (F4) keys. The Standard and Daylight Savings may be toggled with the F1 key. Press More (F4). This will display the following screen. ROHRBACK COSASCO SYSTEMS Xfer Read Conf Data Mate 12. To clear the data memory in the Mate, if required, press Mate (F4), and Clear Mate (F1). A warning will appear. Press Yes (F1) to complete memory clearance. 13. Produce a listing of the configuration information for the data loggers. 14. Connect the Micromate to the first data logger to be configured with the cables supplied. From the Micromate main screen above press Conf (F2) to display the screen: Set Data Logger ID < > Enter CLR BkSp More 31 15. Enter the Logger # for the ID. This is the same as the Address # in the software. The Clear (F2) clears the complete entry. BkSp (F3) backspaces one character to enable correction. Press Enter (F1) to complete the entry. This brings up the following screen: Set Data Logger Tag < > Enter 16. CLR BkSp More Enter the Tag number for this location, up to 12 characters, and press Enter (F1) to complete the entry. This brings up the following screen: Set Sample Rate < > minutes Enter 17. CLR BkSp More Enter the Sample Rate or the reading frequency required. For a data logger, where battery consumption is a consideration, a reading interval of 3 hours or 180 minutes usually suits well. This gives a battery life of around one year, and still provides eight readings a day. The minimum recommended setting is 30 minutes. The maximum setting is 1440 minutes (one day). Press Enter (F1) to complete the entry. This brings up the following screen: Set D/L Clock < > YYMMDDHHMMSS Enter CLR BkSp More 18. Enter the date and time in the format indicated, in order to set the reference time into the data logger. YY is two digits for the year MM is two digits for the month DD is two digits for the day HH is two digits for the hour (24 hour clock) MM is two digits for the minute SS is two digits for the seconds (or just enter 00) Press Enter (F1) to complete the entry and configure the data logger. The Micromate will indicate configuration is in progress and then display the configured information such as follows: ID: 01 CDL 1003 Jul 7, 2005 13:30 Sample Rate: 180 Exit 32 Microcor® Tools Software Version 4.0.0 Note: When configuring the data logger with the Micromate, it is not necessary to clear any data that may be left in the data logger. This is done automatically by the Micromate. 19. Leave the data logger to collect data. It will take its first reading at the end of the sample period. 20. Repeat steps 15 to 19 on the other data loggers that are to be configured. Data Collection from Data Loggers with Micromate 1. Connect the Micromate to the data logger communications port with the supplied cable. Note: There are separate cables for the ML 9500A and the ML 9500B. Take care to use the correct cable. Otherwise communication will not work. 2. Switch on the Micromate, and press F4 twice to clear the initial screens. 3. Press Read (F1) to display the following screen: Read Stat ID: 25 CP 1002 Jul 7, 2005 13:30 Read Set Data Clock Exit 4. If the battery on the data logger has expired, the Micromate will indicate that there is no communication. In this case, change the data logger battery. When the battery runs low, the data logger will first switch off power to the transmitter, set the Battery Status to LOW, and stop taking readings. However, it will have enough power left for some time to allow communication with the Micromate. WARNING: Note: If the battery status indicates low, the data logger memory must be cleared after data collection to reset the Battery Low flag and re-enable reading of the transmitter. See step 5 below. If the memory is not reset, the data logger will not restart taking readings from the transmitter. Changing the data logger battery in a hazardous area will require a hot work permit; make sure the local atmosphere is free of explosive gases. After replacing the battery, re-read the data logger as described in steps 2 and 3. Replacing the battery will require the data logger clock to be reset. This will be indicated on the screen: 33 Read Stat ID: 25 CP 1002 Clock Not Set! Read Set Data Clock Exit Press Set Time (F3) and enter the current date and time. Otherwise the default date is Jan 1, 2000. This function is also used if required to correct the time in the data logger. Set D/L Clock < > YYMMDDHHMMSS Enter CLR BkSp More Press Enter (F1) to show the screen in Step 3 above. 5. It is then important to press Stat (F1) to check the status of the data logger, specially the battery status. This would give a screen such as the following: Jul 7, 2005 13:30 Readings: 245 Sample Rate: 180 More Exit Press More (F1): Batt: OK (or Low) Mem: OK (or BAD) Trans: OK (or BAD) Exit WARNING: If the battery status indicates Low, collect the data in the data logger as described below, and then the data logger memory MUST be cleared (see step 8) to allow data collection to re-commence. Memory Bad indicates a problem in the data logger memory requiring repair. Transmitter Bad indicates that the data logger is not communicating with the transmitter. It suggests a problem with the interconnecting cable or transmitter. Press Exit (F4) to return to the screen: Read Stat ID: 25 CP 1002 Jul 7, 2005 13:35 Read Set Data Clock Exit 34 Microcor® Tools Software Version 4.0.0 6. Press Data (F2) to commence collecting data. If the data logger has not had its Logger # or ID not set (for example if it was configured directly from a portable PC using the previous MS 9000 version 1.8 software), the Micromate will request setting of an ID (Address) and Tag. If the data logger has already had the Logger # or ID set, then it will go directly to a screen similar to the following. Data Logger ID: 01 Tag: CDL 1003 Start Exit If there is insufficient memory for downloading the data, an error message "No Memory Space for Readings" will be displayed. At this point the existing data in the Micromate will have to be transferred to the PC and the memory in the Micromate cleared. If the memory is sufficient, the Micromate will display the following: Getting Data Please Wait Approx 15.7 seconds (or mins) The screen will indicate how long it will take for the data to transfer to the Micromate, and will count down as it goes. 7. When data collection is complete, the screen will display the last reading, the date and time of the last reading, and the number of readings taken, similar to the following: Last Reading +128586 Jul 7, 2005 13:30 Number Reads: 245 Clear Next The last reading confirms that the instrument is producing good numbers. If the reading is near +262144, then the probe has almost expired and needs changing. If this is the case, then the data logger will need to be powered down and then re-configured after the probe replacement and powering-up again in order to set the correct time and date. 8. Press Clear (F1) to clear the data memory in the data logger. This MUST be done if the Battery Status indicated LOW and the battery has been changed. If the battery has not been changed and you do not wish to clear the memory press Next (F4). If you press Clear (F1), a warning screen will ask for confirmation to clear the logger. Press YES (F1) to accept or No (F4) to reject. 9. Repeat steps 1 to 8 for each data logger from which data is to be collected. 35 Note: Clearing the data in the data logger minimizes the data collection time and maximizes the amount of data logger data that may be collected with the Micromate before it must be transferred to the PC. The data logger will store up to 8000 readings before it stops recording. Transferring Collected Data from Micromate to PC 1. Connect the Micromate to the PC communications port with the supplied cable. 2. Switch on the portable PC and start the Microcor Tools program. 3. From the Site/Communications tab in the Microcor Tools software, select the appropriate site from the Existing Sites area and set the Com Port # if necessary in the Data Logger Communications section, then press the Start command button. 4. From the Config/DL Transfer tab select the Address (data logger ID) of the first data logger for which information is to be collected from. 5. Switch on the Micromate and press (F4) twice to go to the main screen. Then press Xfer Data (F3). A screen such as the following will appear: Data Logger ID: 01 Tag : CDL 1003 Start Next Prev Exit The first Data Logger # or ID will be the lowest number in the list. Check that the Data Logger # or ID on the Micromate and the Address on the PC match. If not press Next (F2) or Prev (F3) until they do match. Press Start (F1) and the following screen will be displayed: Ready To Transfer Data using Microcor Software from RCS Exit At this point the Micromate is emulating the selected data logger. 6. Click the Read Setup command button in the Data Logger section. This will check if the communication port is valid and show the setup information. 36 Microcor® Tools Software Version 4.0.0 The time and date shown in the Time and Date text field should correspond to the time the data was downloaded from the data logger. The Battery text field should read OK. If it reads Low, then the battery in the data logger should be changed and memory cleared. The Sampling Interval text field in the Data Logger section should correspond to Sampling Interval text field in the in the Transmitter section. Note: 7. The Store Setup and Clear Data are not functional when working with the Micromate even though the status bar at the bottom of the screen indicates operation. These are only operational when working directly with the PC and the data logger. When using the Micromate, the configuration and clearing of the data logger is done by the Micromate. Click the Read Data command button. If data from this location has already been collected the following message appears: - Press Yes to add the new data onto an existing file. This is the normal method if the data in the data logger is deleted after it is collected each time in order to speed data transfer. It also prevents reaching the maximum storage capacity point in the data logger at where data collection stops. - Press No if all of the data in the Micromate is to replace an existing file. This should be used if the data in the data logger is NOT cleared each time it is read. In this case the existing file is automatically archived. - Press Cancel to exit the Read Data function. Note: The Microcor Data Logger will store up to 8000 readings before collection memory is fully allocated, then the collection of data will halt until data is cleared from memory. After a selection has been made, a counter in the status bar indicates the number of samples to be transferred. Status bar will read End of Transfer when the data is successfully transferred from the data logger to the Microcor Tools program. 37 8. Verify that the data is transferred correctly - click the Show Data command button to display the data with the Microcor Tools – History Viewer. 9. At the end of the transfer, press Exit on the Micromate screen shown below: Ready To Transfer Data using Microcor Software from RCS Exit This will return to the previous screen: Data Logger ID: 01 Tag : CDL 1003 Start 10. Prev Exit Press Next (F2) to select the next Data Logger # or ID for data transfer from the Micromate to the PC. Select the corresponding Address on the PC and repeat steps 6 to 9 above. Repeat these steps to transfer data from other data loggers. Note: 11. Next An asterisk (*) after the ID number on the Micromate indicates that this ID has been transferred to the PC. This allows confirmation of which ID's have been transferred and which have not. Clear the memory in the Micromate once all of the data is properly transferred and verified. This is done from the main screen shown below, by pressing Mate (F4) and Clear Mate (F1): ROHRBACK COSASCO SYSTEMS Xfer Read Conf Data Mate The Micromate is now ready for the next data collection from the data loggers. Note: The data logger checks the battery status during the maximum-load time intervals. If the battery voltage is low, a battery Replace status is set in non-volatile memory. In this state the data logger does not power the transmitter and does not collect data. Other functions and commands such as Read Setup, Store Setup, Load Data, and Clear Data are not affected. The data logger will remain in this state until Clear Data command is executed after replacing the battery. 38 Microcor® Tools Software Version 4.0.0 Configuration of Data Loggers with Checkmate DL This section explains the manual configuration of Microcor probes (attached to a Microcor Data Logger) onto the Checkmate DL. Once the Microcor Data Logger information is properly configured into the Checkmate DL, Data Loggers will need to be programmed. See the Checkmate DL User Manual for more details. Connect the Checkmate DL to the Microcor Data Logger; from the Standby display, press Conf (F2) to proceed to the Set Data Logger ID display: Set Data Logger ID < > Enter Clr BkSp Exit Enter a the desired ID number from 0 to 99 and press Enter (F1) to proceed to the Set Data Logger Tag display. If the ID selected has already been configured, the user will be notified; if continued with the configuration, all previously accumulated data will be erased from the Data Logger. Enter Data Logger Tag > < Enter Clr BkSp Exit In the Enter Data Logger Tag display, enter up to twelve (12) alpha/numeric characters to uniquely identify the monitoring location. This can be a tag number, location or process name. Pressing Clr (F2) clears a previously entered ID. Pressing BkSp (F3) backs up one space for each time it is pressed so that a change can be made. Pressing Exit (F4) returns to the Standby display. Press Enter (F1) to proceed to the Set Sample Rate display: Set Sample Rate > < minutes Enter Clr BkSp Exit Set the desired sample rate and press Enter (F1) to complete the configuration. Data Logger is successfully configured when the Checkmate DL displays the screen below. Date and Time settings are automatically programmed into the Data Logger using the programmed 39 Checkmate DL time and date. Press Exit (F4) to return to the Standby screen from the following display: ID: XX XXXXXXXXXXXX MMM DD, YYYY HH:MM Samp Rate: XXXXX Exit Note: It is necessary to set the correct DAYLIGHT or STANDARD time zone into the Checkmate DL to accurately Date and Time stamp Data Logger readings. Refer to the AVAILABLE MEMORY SPACE AND STANDARD TIME ZONE section for more details. If following error messages appear on the Checkmate DL during the Data Logger configuration, verify the Checkmate DL is properly connected to the Data Logger. ERROR Error Reading Logger Check Connections Exit Set Data Logger Time The Data Logger Date and Time is automatically set when the unit is configured using the Checkmate DL. However, it is possible to update or reset the time if required or if the display indicates “CLOCK NOT SET!” To set the Data Logger Time and Date, connect the Checkmate DL to the Data Logger with the provided adapter cable connector. From the Standby screen, press Read (F1) to proceed to the following display with the attached Data Logger information: ID: XX XXXXXXXXXXXX MMM DD, YYYY HH:MM Read Read Set Stat Data Clock Exit Press Set Clock (F3) to update the Data Logger with the set time of the Checkmate DL. Note: It is necessary to set the correct DAYLIGHT or STANDARD time zone into the Checkmate DL to accurately Date and Time stamp Data Logger readings. Refer to the AVAILABLE MEMORY SPACE AND STANDARD TIME ZONE section for more details. 40 Microcor® Tools Software Version 4.0.0 Data Collection from Data Loggers with Checkmate DL The Checkmate DL is designed to configure and gather data from all Microcor Data Loggers (ML 9500A and/or ML 9500B). The following section will explain the data collection procedure from Microcor Data Loggers. Read Data Logger Configuration and Status Configurations already set into the Data Logger are easily read with the Checkmate DL. Connect the Checkmate DL to the Data Logger with the provided adapter cable connector. From the Standby screen, press Read (F1) to proceed to the following display with the attached Data Logger information: ID: XX XXXXXXXXXXXX MMM DD, YYYY HH:MM Read Read Set Stat Data Clock Exit Press Read Stat (F1) to display the Data Logger time, number of readings and the sample rate as shown below: MMM DD, YYYY HH:MM Readings: XXXXX Samp Rate: XXXXX More Exit Press More (F1) to continue to the next display which shows the battery, memory and transmission information as shown below. Battery status will show OK or LOW. Memory and Transmission will show OK or BAD depending on their status. Batt: OK/LOW Mem: OK/BAD Trans: OK/BAD Exit Reading / Clearing Data from Microcor Data Loggers To read a Data Logger, connect the Checkmate DL to the Data Logger with the provided adapter cable connector. From the Standby screen, press Read (F1) to proceed to the following display with the attached Data Logger information: 41 ID: XX XXXXXXXXXXXX MMM DD, YYYY HH:MM Read Read Set Stat Data Clock Exit Press Read Data (F2); Checkmate DL will perform a series of internal checks and proceed accordingly. First, Checkmate DL will check whether the ID is properly assigned. If the ID is not properly assigned, it will prompt the user to set the Data Logger ID and the Tag information. It will then determine if any readings for this ID are stored in the Checkmate DL. If any data for the ID exists in the Checkmate DL, then the user will be prompted to either Overwrite (F1) or Abort (F4). Overwriting will delete the existing data for that ID and replace it with the new data being read. Once these internal checks are performed and any issues resolved, Checkmate DL will proceed to the following screen: Data Logger ID: XX Tag: XXXXXXXXXXXX Start Exit Press Start (F1) from the above screen to begin the read process. The Checkmate DL will show the following screen during data transfer. Getting Data Please Wait Approx XX.X minutes If “NO MEMORY SPACE FOR READINGS” screen appears (shown below), then the Checkmate DL memory will need to be cleared before transferring the data. It is recommended that ALL existing data on the Checkmate DL be transferred to a PC prior to erasing ANY data. Refer to the section Clearing the Checkmate DL Memory on the Initializing Checkmate DL to Work with Microcor Systems chapter. NO MEMORY SPACE FOR READINGS Exit Once the data is successfully read and transferred it is displayed as shown below. Users can at this time elect to delete the Data Logger content if desired. Note: All data stored for this ID on the Checkmate DL will be erased if “Clear” button is pressed. 42 Microcor® Tools Software Version 4.0.0 Press Clear (F1) to clear Data Logger readings or Next (F4) to return back to the Data Logger information screen without clearing the readings. Last Reading xxxxxxx MMM DD, YYYY HH:MM Number Reads XXXXX Clear WARNING! Next It is recommended to clear the data in the Data Logger after transfer to the Checkmate DL. This reduces the amount and time of data transfer for future downloads. The data is then appended to the previous data when transferring the data from the Checkmate DL to the PC. Refer to the Transferring Collected Data from Checkmate DL to PC section. Transferring Collected Data from Checkmate DL to PC Data Logger data is downloaded to the PC using the provided Microcor® Tools Software program. Connect the Checkmate DL instrument to the 9 pin serial port on the PC using the provided cable. If there is no serial port in the computer, use the included serial-to-USB converter cable to complete the connection. Make sure to set the correct COM port number on the Microcor Tools Software program Data Logger Communication area (in most cases this will be COM 1, however verify this in the device manager). Checkmate DL Data Transfer Procedure From the Standby screen, press Data (F3) to advance to the following display: Transfer Data Connect to PC Start Exit Press the Start (F1) to proceed to the next screen. Use Next (F2) and Prev (F3) to navigate the ID list (0 – 99) and select the desired ID to transfer data (shown below). Data Logger ID: XX Tag: XXXXXXXXXXXX Start Next Prev Exit Once the ID is selected, press Start (F1). Following screen will appear: 43 Ready to Transfer Data using Microcor Software from RCS Exit Note: At this point make sure that the data (ID of the Data Logger) set in the Checkmate DL to be transferred corresponds with the Address selected in the Microcor Tools Software before transferring the data. Data is now ready for transfer from the Checkmate DL to the PC. On the Microcor Tools Software program, select the Site and navigate to the Config/DL Transfer screen, select Data Logger as the Connection type and Microcor as the Instrument (see image below). Click the Read Data command button to begin the transmission. It is also possible to click the Read Setup command button to transfer the configuration data of the Data Logger to the Data Logger section on the Config/DL Transfer screen (shown below). If data already exists for the chosen address, following dialogue box will appear: 44 Microcor® Tools Software Version 4.0.0 - Press Yes to add the new data onto an existing file. This is the normal method if the data in the data logger is deleted after it is collected each time in order to speed data transfer. It also prevents reaching the maximum storage capacity point in the data logger at where data collection stops. - Press No if all of the data in the Micromate is to replace an existing file. This should be used if the data in the data logger is NOT cleared each time it is read. In this case the existing file is automatically archived. - Press Cancel to exit the Read Data function. Note: The Microcor Data Logger will store up to 8000 readings before collection memory is fully allocated, then the collection of data will halt until data is cleared from memory. After a selection has been made, a counter in the status bar indicates the number of samples to be transferred. Status bar will read End of Transfer when the data is successfully transferred from the data logger to the Microcor Tools program. During the data transfer, the following screen will be displayed on the Checkmate DL: Data Transfer in Progress! xxxxx Readings Left Exit The number of readings (xxxxx) counts down as the data is transferred to Microcor Tools. Upon successful transmission, Checkmate DL will show the following screen: Data Transfer Done! Exit Press Exit (F4) to return to the Data Transfer screen to choose another ID for data transfer. 45 Note: Information from only one Data Logger can be transferred at a time, when transferring information of more than one Data Logger, change the Address on the Microcor Tools Software program for each transfer so that all data is not transferred only to one ID address. In case of any error messages displayed on Checkmate DL, check connections between Checkmate DL and the PC, make sure that Microcor Tools Software program is running and that the correct COM port is checked. If data is still not transferred after checking the connection between the PC and Checkmate DL, please see the Troubleshooting section for further help. 46 Microcor® Tools Software Version 4.0.0 47 Chapter 5 Retrieving and Plotting Data (History Viewer) Microcor Tools allows retrieving and plotting of corrosion data. Microcor Tools – History Viewer can be used to view data collected Online or by Data Logger connection methods. To open the Microcor Tools – History Viewer (graph feature), select the site from the Site/Communications tab, select the Address from the Config/DL Transfer tab, and click the Show Data command button. Microcor Transmitters (MT 9485, MT 9485A) In the screen shown above, the top graph is the Metal Loss and the bottom graph presents the probe Temperature (when applicable). The bottom screens show the Corrosion or Erosion Rate for the same set of data when the Corrosion or Erosion Rate button is selected. 48 Microcor® Tools Software Version 4.0.0 To show the corrosion rate graph, click the Corrosion or Erosion Rate command button. To show the probe temperature graph, click the Temperature command button. Note: The Temperature graph will open as the default bottom graph if the transmitter supports temperature monitoring capabilities and if the Probe Temperature check-box is selected; otherwise the graph area will remain blank (to view the Corrosion or Erosion Rate graph, Corrosion or Erosion Rate command button must be pressed. It will not open as a default graph). Data loggers do not support temperature measurements. Use the upper Dimension box (top right-hand corner of the Microcor Tools – History Viewer screen) to select the Metal Loss Y-axis units in mils, µm, mm or Probe Life Units (PLU). Use the lower Dimension box (middle right-hand side of the Microcor Tools – History Viewer screen) to select units of probe temperature in ºC or ºF. Corrosion Rate will be in units corresponding to the Metal Loss units that have been selected (Mils per Year (mpy) or Micrometers per Year (µmpy)) and calculated by linear regression. This Regression Interval may be re-adjusted and the Corrosion or Erosion Rate Recalculated. The default may suit many online systems but can be changed to optimize noise against sensitivity of the computed corrosion or erosion rate. The 24h Filter can be enabled at the Rate/Alarms 49 Settings area to reduce the effects of any diurnal (24) thermal noise. The Alarm Level units are directly related to the above selected units and can only be changed by the above settings. Once the settings have been optimized, the rate data may be saved with the Store button. When closing the graphical display window (History Viewer) you will be asked to save the settings. Select Yes to store these settings for automatic application to all new data. Select (or type in) values for Zero and Gain to calibrate the measurement. If calibration parameters are unknown for probes and transmitters, select 0 for Zero and 31 for Gain. The Zero Offset will allow users to change the y-axis reference point to zero (0) by changing the value. This is a helpful feature when conducting tests to graphically view the data from a convenient starting point. It is recommended that this be returned to original value of zero so determination of probe life can be done accurately. E9020 Transmitter (E9020) The top graph is the Imbalance graph. Use the upper Dimension box (top right-hand corner of the Microcor Tools – History Viewer screen) to select the Imbalance units in Pit Units (PitU) or Microamperes (µA). The bottom graph displays the Corrosion Rate (units of mpy or µmpy) or the Potential Noise Rate (Volt or Raw Data). Both the top and the bottom graphs have same time scale. 50 Microcor® Tools Software Version 4.0.0 Zoom Commands To select a zoom area: 1. Navigate to the graph, press and hold the left mouse button on the starting location; 2. Move the mouse horizontally; 3. Release the button at the desired end location. Use the UndoZoom command button to return to the previous state of the graph. Note: UndoZoom command button will only undo the last nine (9) graphical zoom changes and will adjust the Y-axis unit range to match the maximum ranges of the graphs. The zoom result from the above graph is shown below: 51 Smoothing is a process by which data points are averaged with their neighbors in a series to blur the sharp edges to depict smoother data points. At the default of zero, it plots every data point. The setting is the number of points used in a moving average to smooth the Metal Loss data. The maximum setting number is 100. Increase and decrease the number for more or less smoothing of graphs. Note: This setting does not affect the data used for the Corrosion or Erosion Rate computation, as the Corrosion or Erosion Rate is computed from the raw data. 52 Microcor® Tools Software Version 4.0.0 Generating a Corrosion or Erosion Rate Graph To generate a graph of Corrosion Rate against time, press the Corrosion Rate command button. The Regression Interval [h] control allows selecting a time interval used to calculate the Corrosion or Erosion Rate graph (linear regression algorithm). The Corrosion Rate will be in units corresponding to the Metal Loss units that have been selected in Mils per Year (mpy) or Micrometers per Year (µmpy), and will be calculated by linear regression on an initial default-running-window of 24 hours (20 hours when the collection time is set to 2 minute intervals). This regression period is displayed in hours and may be re-adjusted and the Corrosion or Erosion Rate re-run with the Corrosion or Erosion Rate command button. The interval may need to be adjusted to optimize noise versus sensitivity of the rate graph. 53 Data Cursor The Data Cursor function provides information for an individual data point. The Enable command button marks the data points on the graph with dots. Mouse clicking on the data point will refresh the Metal Loss, Temperature/Corrosion Rate (depending on the graph selected) and Time readings on the gray bar located in the bottom section of the graph. To disable the Data Cursor function, click the Disable command button. 54 Microcor® Tools Software Version 4.0.0 Point to Point Calculations This function (Metal Loss graphs only) provides metal loss and corrosion rate calculation for a selected time-interval. Click on the Show command button under the Selection Lines label. -Two vertical lines (red and green) will appear on the screen. Click and drag the lines to a new position on the graph. Click the Corr. Rate or Metal Loss command buttons for the calculations. Click the Hide command button to disable this feature. 55 Generating a Status Report The history file that contains all the corrosion data also contains status codes. These status codes are not shown by the Microcor Tools – History Viewer graphs. The Status Report command button is intended to search the history file for status codes and to generate a report in standard text format. The command opens the report in the Notepad editor. Use the Notepad “Print” or “Save As” commands to print or store the report on the hard drive. 56 Microcor® Tools Software Version 4.0.0 57 Chapter 6 Real-Time Data Monitoring The Data Display tab is the most convenient global display for on-line systems. It shows current readings and alarm status. Each point on the Data Display maybe double-clicked to show the graphical display (History Viewer). It also indicates which addresses have data loggers. This screen allows for monitoring and troubleshooting the RS485 bus and transmitters. Communication errors and transmitter status codes are listed in the Status column. The column named Parameter 3 will turn red if a unit is in alarm status. This will turn yellow when the alarm is acknowledged by the user. This means there is an ongoing alarm, and it is acknowledged. When the alarm is turned off or when the corrosion rate resets to below the alarm rate, the column will return to normal. If a unit enters an alarm status and resets prior to user acknowledgement, red indicator will change color to blinking green and gray and will reflect this on the Event Log. 58 Microcor® Tools Software Version 4.0.0 59 Chapter 7 Event Log The Event Log tab is intended to collect and store different types of events in the system and to present them in a table format. The events are stored in a 500 element buffer. The Save permits export of the event log information in to a text-format file. If a unit enters an alarm status and resets prior to user acknowledgement, red indicator will change color to blinking green and gray and will reflect this on the Event Log; hence it is highly recommended that the Event Log is inspected regularly. 60 Microcor® Tools Software Version 4.0.0 61 Chapter 8 Archiving and Importing Data Collected data may be archived when the data files become large enough to slow down the graphing function, typically over 65,000 points. Data may also be retrieved from archives into the program, and this function may also be used to import data files such as those from the previous versions of the Microcor software or from other Microcor Tools software users. When moving data to the archives, this data is always stored in the Archives folder. The path is as follows; C:\Program Files\Microcor Tools\data\Site Name\archives. To archive a data file, select the Address to be archived and press the Move to Archives command button. Each time a file is archived, the date is added to the file name to prevent overwriting of any earlier dated file. This protection function does not operate if the data has the same date, therefore, archiving is permitted only once per day. Archive files have automatically assigned names. For example, the archive file of location Address 15, created on 13 May, 2003 is ch15_13May03.dat. The same address archived the following day would be ch15_14May03.dat. Note: The naming convention used for archiving allows only one archive per day. To retrieve an archived file, press the Load from Archives command button. The default opening of the browse box will be the Archive folder for retrieving existing archived files. 62 Microcor® Tools Software Version 4.0.0 To import data from some other data files such as those from the previous versions of Microcor or from other Microcor Tools users, browse to the required file and select the Open button. Note: If importing data from other Microcor Tools users or previous versions of Microcor Tools, import the data files (*.DAT). However, these files do not contain details of probe span and probe reading interval. This information will need to be manually entered on the Config/DL Transfer screen. This information can be found in the source data file (*.SET). Probe reading interval can also be found on the graph by clicking the Enable on the Data Cursor and checking the reading interval. The Auto Archiving feature in the main screen is designed for computers with limited storage resources. If the Auto Archiving is selected, when a site collects 2MB of data (approximately 48,620 readings or 67 days of continuous data collection (temperature data collection enabled) at a sampling interval of 2 minutes), the data file is automatically transferred into the archives folders replacing previously stored data file. Archive files use a different naming convention in this situation. For example, the archive file of location Address 15 is ch15.dat. Note: When Auto Archiving is enabled, Microcor Tools initiates automatic archiving when the file reaches its limit, previous automatically stored archives will be deleted. This process will not delete any manually archived files 63 Appendix 1 – Alloy Multipliers These factors are recommended for use with the E9020 instrument. They are based upon use of CORRATER® electrodes which have surface areas of 5cm2 for "standard" probes and 0.5 cm2 for "flush" probes UNS Code Material Multiplier UNS Code Material Multiplie r K03005 Pipe Grade Carbon Steel 1.00 N08800 Incolloy 800 0.89 A91100 Aluminum 1100-0 0.94 N08825 Incolloy 825 0.88 A92024 Aluminum 2024 0.88 N10276 Hastelloy C276 0.86 C11000 Copper 110 ETP Comm. Pure 2.00 R50400 C44300 CDA 443 Arsenical Admiralty 1.67 S30400 AISI 304 Stainless Steel 0.89 C44500 CDA 445 Phosphorized Adm. 1.68 S31600 AISI 316 Stainless Steel 0.90 C64200 CDA 642 A1 Silicon Bronze 1.48 S31603 AISI 316L Stainless Steel 0.90 C68700 CDA 687 Alum. Brass Arsenical 1.62 S31803 2205 Duplex Stainless Steel 0.89 ASTM B-348 Grades 2-4 Titanium 0.75 C70610 CDA 706 90/10 Copper/Nickel 1.80 S32750 2507 Duplex Stainless Steel 0.88 C71500 CDA 715 70/30 Copper/Nickel 1.50 Z17001 Grades 1A, 1, 2, 3, or 5 Zinc 1.29 G41300 AISI 4130 Alloy Steel 1.00 L50045 Lead 2.57 N04400 Monel 400 Nickel 1.13 N05500 Monel K-500 Nickel 1.04 N06022 Hastelloy C22 0.85 N06600 Inconel 600 Nickel 0.95 N08020 Carpenter 20 CB3 SST 0.98 64 Microcor® Tools Software Version 4.0.0 65 Appendix 2 – Modbus Configuration RCS Microcor® Intelligent Interface Unit Modbus Configuration Modbus Slave ID: 1 Modbus Data Type: Float 32 Microcor Transmitters - Model MT-9485A Metal Temp Calc Calc Loss Change Rate Rate w/ (mm) (deg F) (mm/yr) 24h filter Transmitter Modbus Modbus Modbus Modbus Address Address Address Address Address (I/N) Network 1 0 40,001 40,129 40,257 40,385 1 40,003 40,131 40,259 40,387 2 40,005 40,133 40,261 40,389 3 40,007 40,135 40,263 40,391 4 40,009 40,137 40,265 40,393 5 40,011 40,139 40,267 40,395 6 40,013 40,141 40,269 40,397 7 40,015 40,143 40,271 40,399 8 40,017 40,145 40,273 40,401 9 40,019 40,147 40,275 40,403 10 40,021 40,149 40,277 40,405 11 40,023 40,151 40,279 40,407 12 40,025 40,153 40,281 40,409 13 40,027 40,155 40,283 40,411 14 40,029 40,157 40,285 40,413 15 40,031 40,159 40,287 40,415 16 40,033 40,161 40,289 40,417 17 40,035 40,163 40,291 40,419 18 40,037 40,165 40,293 40,421 19 40,039 40,167 40,295 40,423 20 40,041 40,169 40,297 40,425 21 40,043 40,171 40,299 40,427 22 40,045 40,173 40,301 40,429 23 40,047 40,175 40,303 40,431 24 40,049 40,177 40,305 40,433 25 40,051 40,179 40,307 40,435 26 40,053 40,181 40,309 40,437 27 40,055 40,183 40,311 40,439 28 40,057 40,185 40,313 40,441 29 40,059 40,187 40,315 40,443 30 40,061 40,189 40,317 40,445 31 40,063 40,191 40,319 40,447 Parameter (Unit) Description Tag Number Span of Probe TAG 10 MIL Status Modbus Address 40,513 40,515 40,517 40,519 40,521 40,523 40,525 40,527 40,529 40,531 40,533 40,535 40,537 40,539 40,541 40,543 40,545 40,547 40,549 40,551 40,553 40,555 40,557 40,559 40,561 40,563 40,565 40,567 40,569 40,571 40,573 40,575 66 Microcor® Tools Software Version 4.0.0 Parameter Description Tag Number Span of Probe Transmitter Address (I/N) Corrater Transmitters - Model E9020 (Not Used) Corrosion Pitting/ Integrated Reserved Rate / (Galvanic) Metal Potential Current Loss Modbus Address Status Modbus Address Modbus Address Modbus Address Modbus Address 40,129 40,131 40,133 40,135 40,137 40,139 40,141 40,143 40,145 40,147 40,149 40,151 40,153 40,155 40,157 40,159 40,161 40,163 40,165 40,167 40,169 40,171 40,173 40,175 40,177 40,179 40,181 40,183 40,185 40,187 40,189 40,191 40,257 40,259 40,261 40,263 40,265 40,267 40,269 40,271 40,273 40,275 40,277 40,279 40,281 40,283 40,285 40,287 40,289 40,291 40,293 40,295 40,297 40,299 40,301 40,303 40,305 40,307 40,309 40,311 40,313 40,315 40,317 40,319 40,385 40,387 40,389 40,391 40,393 40,395 40,397 40,399 40,401 40,403 40,405 40,407 40,409 40,411 40,413 40,415 40,417 40,419 40,421 40,423 40,425 40,427 40,429 40,431 40,433 40,435 40,437 40,439 40,441 40,443 40,445 40,447 40,513 40,515 40,517 40,519 40,521 40,523 40,525 40,527 40,529 40,531 40,533 40,535 40,537 40,539 40,541 40,543 40,545 40,547 40,549 40,551 40,553 40,555 40,557 40,559 40,561 40,563 40,565 40,567 40,569 40,571 40,573 40,575 Network 1 TAG 10 MIL 0 1 2 3 4 5 6 7 8 9 10 11 12 13 14 15 16 17 18 19 20 21 22 23 24 25 26 27 28 29 30 31 40,001 40,003 40,005 40,007 40,009 40,011 40,013 40,015 40,017 40,019 40,021 40,023 40,025 40,027 40,029 40,031 40,033 40,035 40,037 40,039 40,041 40,043 40,045 40,047 40,049 40,051 40,053 40,055 40,057 40,059 40,061 40,063 67 Protocol RS-485 2 wire, 19200 Baud, 8 data bits, 1 stop bits, no parity Scaling Note: The Modbus metal loss values are in the range of -1 to +1 Microcor Transmitter Metal Loss = Modbus value x Probe Span in mils, µm, or mm as applicable Temperature = (Modbus value x 397) +152 Deg C Corrosion Rate = Modbus value x Probe Span in mils for mpy, or Probe Span in µm for µm/y, or Probe Span in mm for mm/y Corrater E9020 Transmitter Corrosion Rate = Modbus value x E9020 Full Scale Range of 200 mpy for mpy, 5000 µm/y for µm/y, or 5 mm/y for mm/y Potential = Modbus value x Full Scale voltage range of 2 volts, or 2000 mV Pitting (Imbalance) = Modbus value x Full Scale range of Corrosion rate of 200 mpy, 5000 µm/y, or 5 mm/y (Pitting units have no dimensions, but must have same scale as the Corrosion Rate) Current (Galvanic) in µA = Modbus value x Full Scale Current Range of 500 µA Integrated Metal Loss = Modbus value x Full Scale Corrosion Rate range of 200 for mils, 5000 for µm, or 5 for mm Status Field Status 1 - 2 Bytes Bit 0 Bit 1 Bit 2 Bit 3 Bit 4 Bit 5 Bit 6 Bit 7 Bit 8 Bit 9 Bit 10 Bit 11 Bit 12 Bit 13 Bit 14 Bit 15 Status 2 - 2 Bytes Reserved Metal Loss Status (1=OK) Bit 0=1 if Bit 8=0, and Bit 9=0, and Bit 10=0 Temperature Status (1=OK) Corrosion Rate Linear Regression (1=OK) Corrosion Rate with 24 hr filter (1=OK) Not Used Not Used Not Used Not Used Transmitter to IIU communication error (1=Error) Transmitter in Startup (1=StartUp) Probe or Probe Connection Failure (1=Failure) Not Used Not Used Not Used Not Used Not Used 68 Microcor® Tools Software Version 4.0.0 69 Appendix 3 – OPC Configuration OPC refers to OLE for Process Control protocol and is based on Microsoft’s OLE/COM technology which is used for data transfer between databases. When Microcor Tools – Output Interfaces is used on the RCS Intelligent Interface Unit (IIU), the Microcor Tools acts as the OPC Server to provide data transfer to the DCS, PCS or SCADA system running the OPC Client. While the principle of operation is simple, configuration can be complex as OPC is integrated into Microsoft security. Workgroup vs. Domain Setup Setting up the OPC Server computer or the IIU will differ on a workgroup computer network compared to a domain computer network. OPC Server computer or the IIU must be properly configured according to the local network to communicate with the client. If the local network is on a domain, the OPC Server computer or the IIU must be added to the domain, otherwise both should be in the same workgroup. In order for the OPC Server computer or the IIU and Client to properly communicate in a domain network environment, a common username and password is required to be set on both computers. OPC Server computer or the IIU and Client must both be logged on to the domain with the same user credentials In order for the OPC Server computer or the IIU and the Client computer to properly communicate it requires a common username and password to be set on both computers. First, determine whether the client computer which will connect to the OPC Server computer or the IIU is set up as a part of a domain network or a workgroup network. To do this, navigate to Start Æ Control Panel (Classic View) Æ System and double click the Computer Name tab of the intended client computer (shown below): 70 Microcor® Tools Software Version 4.0.0 Note: The above image shows that this computer is in a Workgroup named WORKGROUP. If the system is in a domain, the word “Workgroup” will be replaced with “Domain” followed by the domain name. Configure the OPC Server Computer or the IIU on a Domain/Workgroup Following steps illustrates the steps taken to configure the OPC Server computer or the IIU on a workgroup or a domain network. Administrative privileges on the computer or the IIU (username, password) are required in order to switch from a domain network configuration to a workgroup. If switching from a workgroup to a domain, Administrative privileges to the domain are required (consult IT Administrator for assistance). It is recommended that IT Department assistance is enlisted when going from a workgroup to a domain network. Navigate to Start Æ Control Panel Æ System and double click the Computer Name tab. Click on the Change button to advance to the Computer Name Changes screen shown below: On the Member of area, change from Domain/Workgroup as desired. When OK is clicked, you will be prompted to enter the Username and Password of an administrator. If going to a workgroup, use a local computer administrator username and password, if going to a domain, have the IT Administrator enter the domain Administrator username and password. 71 Note: For the RCS Intelligent Interface Unit (IIU), the default administrator username and password (case sensitive) is as follows: Username: rcsuser Password: rcs Set up OPC Server or the IIU for a Workgroup Network Environment The following section will explain the additional setup steps required when configuring the OPC Server or the IIU in a workgroup network environment. An IIU as supplied is set by default as an OPC Server on a Workgroup with the name “WORKGROUP” and with automatic logon. For an IIU supplied or for systems on domains networks, skip to the next section, the Setup the Static IP Address below. 1. OPC Server or the IIU on a Workgroup Network – IIU Default In order for the OPC Server or the IIU and Client to properly communicate it requires a common username and password to be set on both computers. It is recommended by RCS to use the following username and password with administrative privileges on both computers. User Name: rcsuser Password: rcs Note: Administrative privileges are required on the computers to add a new user and make the necessary changes. It is recommended that you consult your organization’s IT Department and obtain permission/assistance prior to changing configurations on the computers. 72 Microcor® Tools Software Version 4.0.0 To create a new user profile, navigate to Start Æ Control Panel Æ Administrative Tools Æ Computer Management and expand System Tools. Find Local Users and Groups, expand and choose Users. Right click on the right hand side and select New User. This will open a New User dialogue box, Enter rcsuser as the User name and rcs as the Password and confirm the password. Before pressing the Create button, uncheck “User must change password at next logon.” Make sure to check the password as “password never expires” and “user cannot change password.” Press Create to create the user and Close the New User dialogue box. You should now see the new rcsuser profile on the Computer Management screen. This user can now be added to be a member of the Administrators group. It is necessary for the rcsuser to have administrative privileges on the computer. To set the configuration, right click on the rcsuser name and select properties. Click on the Member Of tab. The rcsuser by default will be in the Users group. Click Add and type in Administrators as the object type and click OK. Click on Users and click Remove (once above steps are completed, rcsuser will have administrative privileges on the computer, see image below). 73 2. Setup Automatic Logon – IIU Default Note: Administrative privileges are required to make changes to the registry. Follow steps with utmost caution to prevent serious damage to the operation of the Operation System. Caution: Deleting/Editing Registry Keys can cause serious damage to the operation of the system, only manipulate the described keys below. It is recommended that you consult your organization’s IT Department for assistance Use the Registry Editor to add the log on information, follow the steps below: 1. Click Start Æ Run, type regedit and click OK. 2. Locate the following registry key: • HKEY_LOCAL_MACHINE\SOFTWARE\Microsoft\WindowsNT\CurrentVersion\ Winlogon • Double-click the DefaultUserName entry, type rcsuser, and then click OK. • Double-click the DefaultPassword entry, type rcs under the value data box, and then click OK. 3. If there is no DefaultPassword value, create the value by follow the steps below: • In Registry Editor, click Edit, click New, and then click String Value. • Type DefaultPassword as the value name of the New Value created, and then press ENTER. • Double-click the newly created key, and then type your password (rcs) in the Value Data box and click OK. 74 Microcor® Tools Software Version 4.0.0 4. If no DefaultPassword string is specified, Windows XP automatically changes the value of the AutoAdminLogon registry key from 1 (true) to 0 (false) to turn off the AutoAdminLogon feature. Double-click the AutoAdminLogon entry, type 1 in the Value Data box, and then click OK. 5. If there is no AutoAdminLogon entry, create the entry by performing the following steps: • In Registry Editor, click Edit, click New, and then click String Value. • Type AutoAdminLogon as the value name, and then press ENTER. • Double-click the newly created key, and then type 1 in the Value Data box. 6. Exit the Registry Editor. 7. Click Start Æ Shutdown Æ Restart, and then click OK. The computer will automatically log onto the rcsuser profile. Setup the Static Internet Protocol (IP) Address In order for the OPC Server computer or the IIU and the OPC Client computer to communicate, IP Addresses may need to be set. The following recommended procedure is for networks that support Dynamic Host Configuration Protocol (DHCP). It is recommended that the OPC Server or the IIU is set up with Internet Protocol (TCP/IP) Properties to “Obtain IP Address automatically” and the Alternate Configuration to be configured with the suggested following settings (default configuration of the IIU): IP Address: Subnet Mask: Default Gateway: 192.168.3.1 255.255.255.0 192.168.3.254 This configuration enables the OPC Server computer or the IIU to be plugged directly into a domain network and obtain an IP Address from the DHCP Server or use the Alternate Configuration if a DHCP Server is not found or unavailable (if a cross-over cable is used). In order for the OPC Client computer to connect when a DHCP Server is unavailable, the Alternate Configuration on the client computer should be setup with an incremented IP Address such as 192.168.3.2 (IP Address range must be within 192.168.3.2 to 192.168.3.253). Consult your IT Department for more details. The typical navigational path to make the TCP/IP changes is Start Æ Control Panel Æ Network Connections Æ Local Area Connection. Right-click and select Properties. Scroll, find and select the Internet Protocol (TCP/IP) under the General tab and click the Properties command button. See image below: 75 Set the configuration as follows under the General and Alternate Configuration tabs: Note: If Static IP Addresses are used exclusively in the Domain or Workgroup, consult your IT Department for available Static IP Addresses, Subnet Mask, Default Gateway and assistance. 76 Microcor® Tools Software Version 4.0.0 Windows Firewall Setup Navigate to Start Æ Control Panel Æ Windows Firewall and select Off (not recommended) and click OK. Note: Once the setup procedure is completed and communication is verified, enable the firewall following the same process as above and selecting ON (recommended). Note: If a cross-over cable is used to connect to the IIU or the OPC Server computer, then the Windows Firewall may be required to be turned off prior to establishing the connection. Re-enable the firewall after disconnecting from the IIU or the OPC Server computer. Setup Windows Folder Properties: Disable “Use Simple Sharing” – IIU Default Double click My Computer from the desktop or right click Start and select Explorer. Click Tools Æ Folder Options and select View tab (shown below). Uncheck the “Use simple file sharing (Recommended)” and click Apply followed by OK. 77 Install Microcor Tools Software and OPC Server Application – IIU Default Install the Microcor Tools 4.0 Software from the installation CD. It is important to retain all default options when installing. Once the installation is complete, follow the steps below to register the OPC Server. Click Start Æ Run, type cmd and click OK. Type cd C:\ Type cd Program Files\MicrocorTools Type MTXOPCServer.exe – regserver Exit Command Prompt window (see image below). If errors are encountered, make sure all steps are performed as explained above and that the user has sufficient privileges on the computer. 6. Install OPC Client Test Utility (Consult RCS for more information). 1. 2. 3. 4. 5. 78 Microcor® Tools Software Version 4.0.0 Setting up DCOM Properties for Workgroup Networks Only – IIU Default DCOM properties must be configured to assure the communication between the OPC Server and Client when using workgroup networks. Skip to the next section Launching OPC Server if using a domain network. To setup the DCOM properties, navigate to Start Æ Control Panel Æ Administrative Tools Æ Component Services. Expand the Console Root by clicking on it, click on the Component Services Æ Computers Æ My Computer Æ DCOM Config (see image below). 79 Find the MTX OPC Server entry and right click and choose properties (shown above). Change the Authentication Level to None on the General tab and select only the “Run application on this computer” on the Location tab and click Apply as shown below. 80 Microcor® Tools Software Version 4.0.0 Change the Launch and Activation Permissions and Access Permissions to Customize and Configuration Permissions to Use Default in the Security tab and click Apply. Click the Edit button under the Launch and Activation Permissions and ensure that all Groups or Users have full permissions allowed as shown below. Click OK. 81 Click the Edit button under the Access Permissions and ensure that all Groups and Users have full permissions allowed as shown below. Click OK. Click Apply on the Security tab before moving on to the Endpoints tab (no changes made on the Endpoints tab, shown below). 82 Microcor® Tools Software Version 4.0.0 Select the “The Launching User” on the Identity tab and click Apply. The OPC Server is now ready to be launched for the Workstation Network setup. Launching OPC Server or the IIU On the OPC Server computer or the IIU log on to the domain network using the credentials provided by the IT Department or a local user; if the computer is setup for a workgroup network, the computer will automatically logon (if setup guidelines were followed). Launch the OPC Server on the Microcor Tools – Interface Option release by performing the following steps: 83 1. Run the Microcor Tools Software application from Start Æ All Programs Æ RCS Æ Microcor Tools. 2. Create a New Site or choose an Existing Site to enable the Online Communication Area. 3. Click on the Interfaces button to open the Interfaces screen. On the OPC area, select Enabled and Save Configuration and Return. 84 Microcor® Tools Software Version 4.0.0 4. When the Enabled selection is made, OPC icon will appear on the Windows Status bar as shown below: 5. Double-click on the OPC icon show above to open the OPC Server status screen. Users may monitor the connections from this screen. The values for statistics will dynamically change as clients log on and off of the OPC Server status screen. Note: It is important to note that the OPC Server shows values (Unit, ML, TC, CR-LR, CR24 and Stat) on the status bar. There values will only be present if the data are transferring correctly; otherwise the values will be blank. This means that either the Online Communication - Interfaces area is not properly configured or that the OPC Server was invoked by the OPC Client Test Utility installed on the computer (OPC Client Test Utility is preinstalled only on computers provided by RCS), see the Troubleshooting section below for more details. 6. The OPC Server is now set to transfer data. Make sure to Start the Online Communication and Data Collection (shown below); your OPC Client computer will now receive the data being transferred (make sure to use the same credentials on the OPC Client computer as used on the OPC Server computer). 85 Using the Preinstalled OPC Client Test Utility on RCS IIU to Test the OPC Server If the OPC Server computer or the IIU is configured and shipped by RCS, an OPC Client Test Utility application will also be installed just to verify the functionality of the OPC Server. This OPC Client Test Utility can be run by following the steps below: 1. Run the OPC Client Test Utility application from Start Æ All Programs Æ VB6Client 2. Normally, in order for a client to see a server, the OPC Server PC name or the IP address must be typed in; however in this case since both the server and the client reside on the same machine, click on the drop-down arrow of the OPC Servers: to automatically browse to find the OPC Server. When the client is found, click on it to make the selection and then click on the Connect button. 86 Microcor® Tools Software Version 4.0.0 3. Click on the Add Group button of the OPC Groups area. This will browse, find and enter the group to the text box. 4. Click on the Browse button of the Namespace area. This will browse, find and enter the Namespace group on the text area. Expand the selection by clicking on the plus ( ) sign to show the detailed listing. Click the plus ( ) sign as required to see the individual selections. Right-click on each selection and left-click to select and view the data online. 87 Troubleshooting 1. OPC Server is started and the OPC Client Test Utility on the same computer can connect, but the Remote OPC Client computer cannot connect. • Disable the Windows Firewall temporarily on both computers until the connection is established. • Ensure the IP Addresses are correct and the connection cables are secure on the OPC Server computer or the IIU and the OPC Client computer. 2. OPC Server is started and the Client is connected but Client shows 0 for transferred values. • Ensure that the Start buttons are activated on the Online Communication and Data Collection as shown below on the on the Site/Communications screen. 88 Microcor® Tools Software Version 4.0.0 • Check the OPC Server status by clicking on the OPC icon on the status bar. If the OPC Server does not show values (Unit, ML, TC, CR-LR, CR24 and Stat) on the status bar then check the Online Communication - Interfaces area to ensure the OPC interface has been Enabled (see the following images). If the Status bar shows no activity as shown above then the OPC Server is not transferring data. Enable the OPC Interface and Save Configuration as shown below: 89 3. OPC Client computer does not receive data after the OPC Server computer reboot. • Ensure the Autostart is checked on the Online Communication area, shown below: If the Autostart was selected, click Stop to enable the Interfaces button. Click the Interfaces button and make sure the Enabled is selected on the OPC area; Save Configuration and Return and try again.