1
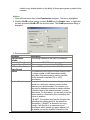
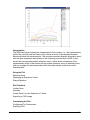
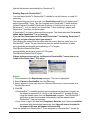
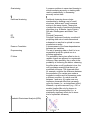
Overview
Component Analysis is an unsupervised or class-free approach to finding the most
informative or explanatory features in data. In particular, Principal Component Analysis
(PCA) substantially reduces the complexity of data in which a large number of variables
(e.g. thousands) are interrelated, such as in large-scale gene expression data obtained
across a variety of different samples or conditions. PCA accomplishes this by computing
a new, much smaller set of uncorrelated variables which best represent the original
data. PCA is a powerful, well-established technique for data reduction and visualization.
2D and 3D PCA plots often place objects with similar patterns near each other.
GeneLinker™ provides one option for PCA analysis: Orientation by Genes or
Orientation by Samples. In brief, PCA oriented by genes is useful for distinguishing
sample classes or sample clusters, while PCA oriented by samples is useful for
distinguishing gene classes or gene sets.
Mathematical Details and Examples of Orientation
To understand the difference and interpretive implications between the two different
orientations - PCA by Genes or PCA by Samples - it is helpful to conceptualize the
data analysis from the point of view of covariance matrices. A dataset can be thought of
as comprising distinct mathematical or statistical variables (e.g. columns) for which there
are statistical samples (e.g. rows).
a) Genes vs. Genes (Orientation by Genes)
• Typically, genes are considered the mathematical or statistical variables and
samples are considered the statistical samples. The corresponding covariance
matrix (if it were computed) would carry the covariance of one gene vs. another
gene, assessed over the samples, and recorded for each pairwise combination
of genes (i.e., pairwise combinations of the statistical variables). Thus, if there
are n genes and m samples, the corresponding covariance matrix would
comprise n by n entries, each entry being the covariance of the ith gene vs. the
jth gene, i and j running from 1 through n. The ith element along the diagonal of
this covariance matrix is simply the conventional variance of the ith variable, in
this case the variance of the ith gene over all the m samples.
b) Samples vs. Samples (Orientation by Samples)
• However, if the samples are considered to be the mathematical or statistical
variables, then the genes would play the role of the statistical samples. This
case is less typical, but is still useful for biological interpretation in some
situations (e.g., when the samples are different specific times of the cell cycle).
In this case, the corresponding covariance matrix (if we were to compute it)
would comprise m by m entries, each entry being the covariance of the ith
sample vs. the jth sample from the data matrix. However, this time i and j run
from 1 through m. Again, the ith element along the diagonal of this covariance
matrix is simply the conventional variance of the ith variable. In this case, it is
the variance of the ith sample (i.e., the ith mathematical or statistical variable)
over all the n genes (the statistical samples).
In GeneLinker™, a Principal Component (PC) is defined as a mathematical entity (i.e.,
vector) computed from the data which is equivalent to a characteristic vector (i.e.,
GeneLinker Gold 3.1 / GeneLinker Platinum 2.1
315