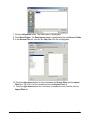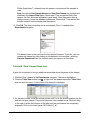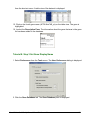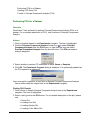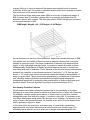
1
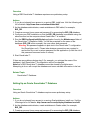
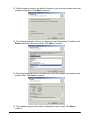
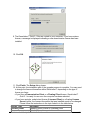
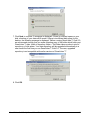
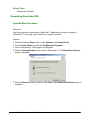
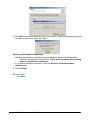
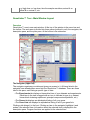
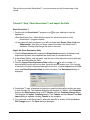
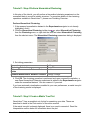
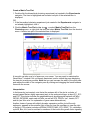
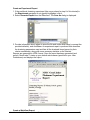
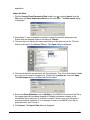
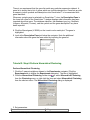
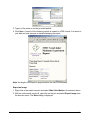
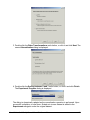
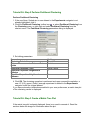
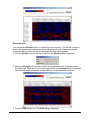
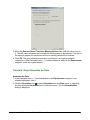
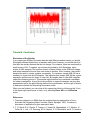
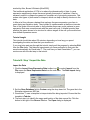
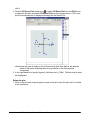
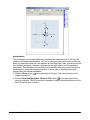
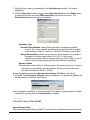
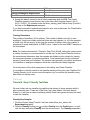
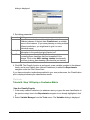
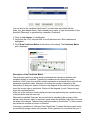
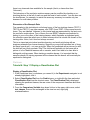
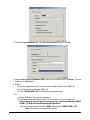
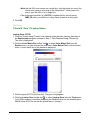
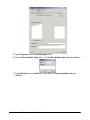
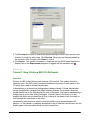
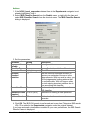
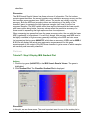
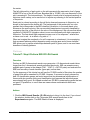
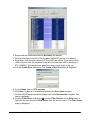
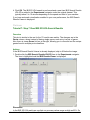
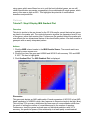
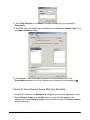
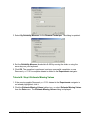
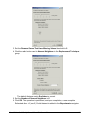
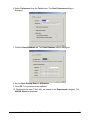
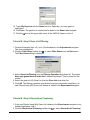
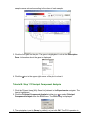
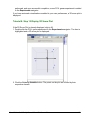
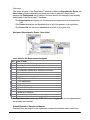
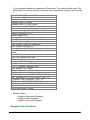
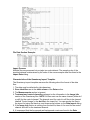
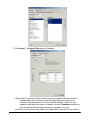
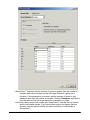
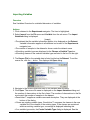
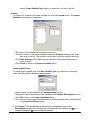
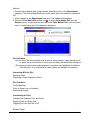
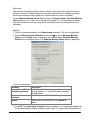
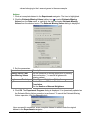
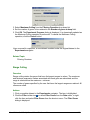
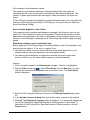
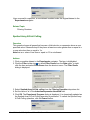
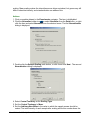
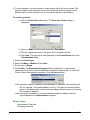
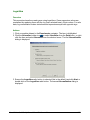
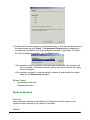
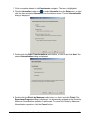
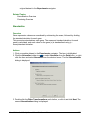
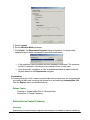
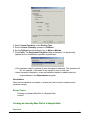
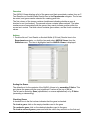
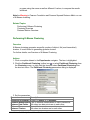
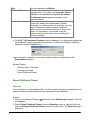
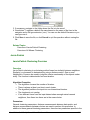
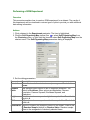
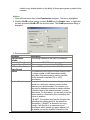
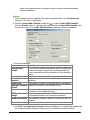
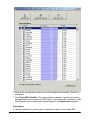
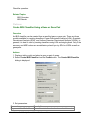
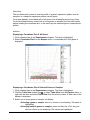
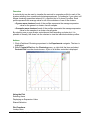
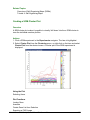
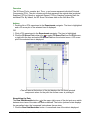
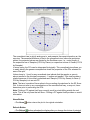
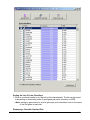
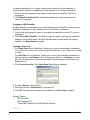
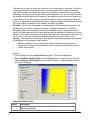
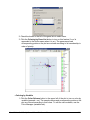
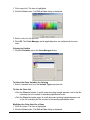
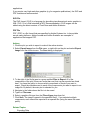
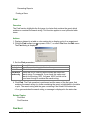
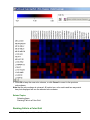
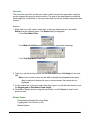
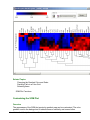
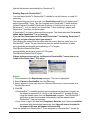
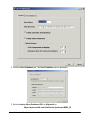
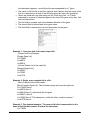
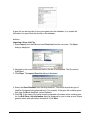
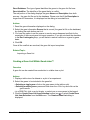
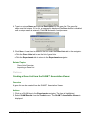
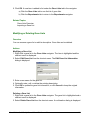
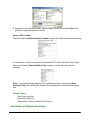
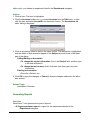
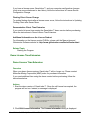
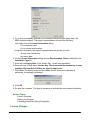
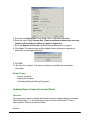
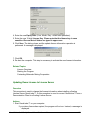
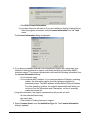
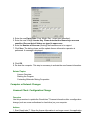
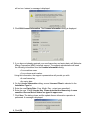
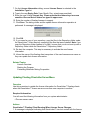
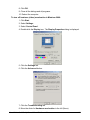
Tutorial 3A: Step 2 Perform Partitional Clustering
Perform Partitional Clustering
1. If the new Norm: Scaled min to max dataset in the Experiments navigator is not
already highlighted, click it.
2. Click the Partitional Clustering toolbar icon , or select Partitional Clustering from
the Clustering menu, or right-click and select Partitional Clustering from the
shortcut menu. The Partitional Clustering parameters dialog is displayed.
3. Set dialog parameters.
Parameter
Clustering Orientation
Distance Measurements: Between Data
Points
Algorithm Properties: Type
Algorithm Properties: Neighbors to
Examine
Algorithm Properties: Neighbors in
Common
Setting
Cluster Genes
Euclidean
Jarvis-Patrick
6
2
4. Click OK. The clustering operation is performed and upon successful completion, a
new J-P (6,2): genes | Euclid | average experiment is added to the Experiments
navigator under the original dataset.
If you have automatic visualizations enabled in your user preferences, a matrix tree plot
of the clustering results is displayed.
Tutorial 3A: Step 3 Create a Matrix Tree Plot
If the matrix tree plot is already displayed, there is no need to recreate it. Read the
sections below the image for information about the plot.
GeneLinker Gold 3.1 / GeneLinker Platinum 2.1
80