1
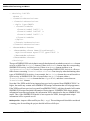
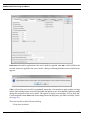
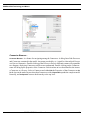
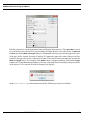
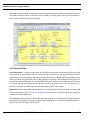
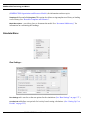
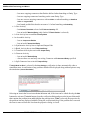
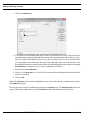
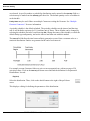
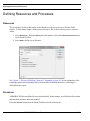
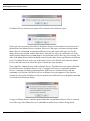
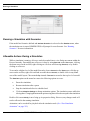
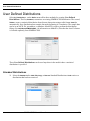
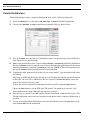
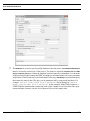
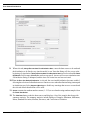
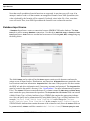
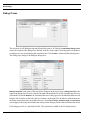
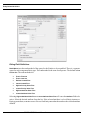
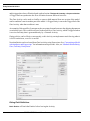
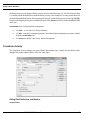
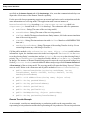
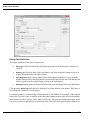
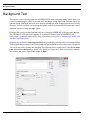
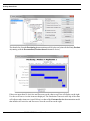
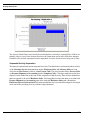
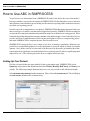
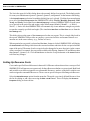
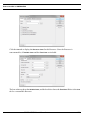
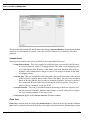
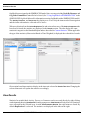
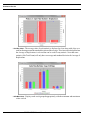
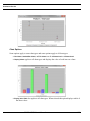
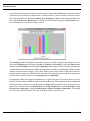
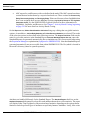
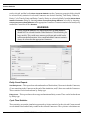
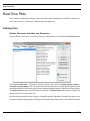
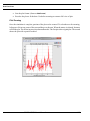
Activity Gantt Chart
Activity Gantt Chart
Gantt charts of the Activities and Processes in a model can be created after a simulation completes.
This Report menu option is available if Collect Activity Statistics or Collect Activity by Entity Statistics
is selected in Define Global Statistics Collection (see “Default Performance Measures” on page 243).
Selecting Activity Gantt Chart displays a dialog containing a list of the replications, a tree view of the
model, and various chart options.
Note that Sum of Replications is not in the replication list. At least one replication must be selected,
and a chart will be created for every selected replication. Select the Activities and Processes to include
from the Activity/Process tree. Multiple items can be selected individually by pressing the Control
key during selection. In addition there are buttons to assist in selection.
•
•
•
•
Select All
•
Deselect All
- Selects all Activities and Processes.
Select All Processes
Select All Activities
- Selects all Processes.
- Selects all Activities.
- This button is active when a single Process is selected. It selects all Activities and Processes subordinate to the selected Process.
Select Subordinate
- Removes all selections.
Just because an Activity or Process is selected in the tree does not mean that it will be included in the
chart. Activities and Processes with zero cycle time will not be included.
By default Display Total Time is selected. In addition to total cycle time, if an Activity has a specified
delay time it will have Processing time, if an Activity requires Resources it most likely will have Wait
for Resource time, and if an Activity queues Entities is will most likely have Hold for Condition
time. Some Activities can have all three. There are options to include all three subsets of total cycle
SIMPROCESS User’s Manual
206