1
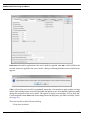
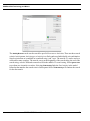
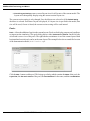
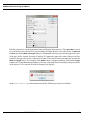
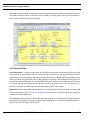
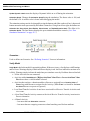
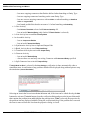
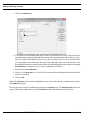
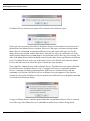
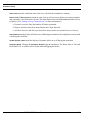
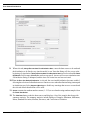
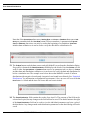
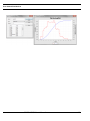
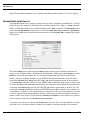
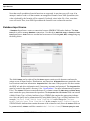
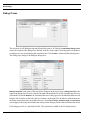
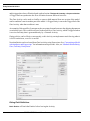
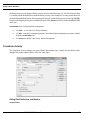
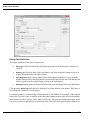
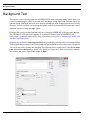
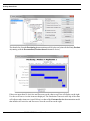
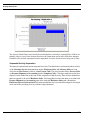
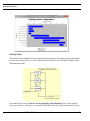
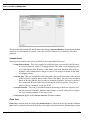
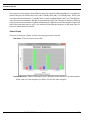
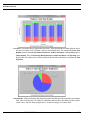
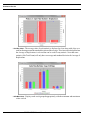
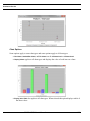
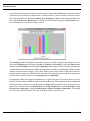
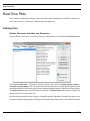
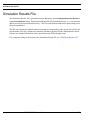
Simulation Results
were Entity (component type) and the selected statistics from Cycle Time By State by replication. If two
replications were selected (say Replication 1 and Replication 2), then two charts would be created.
One chart would have the title Cycle Time By State : Replication 1 and the other chart would have the
title Cycle Time By State : Replication 2. If statistics from the statistic category Count By State were
selected then there would be four charts created.
The Group By option also influences how many charts are created. Using the same selections as the
above chart (Replication 1; the Entities Product A, Product B, and Product C; and Cycle Time By State
statistics), if the Group By option is changed to Replication, three charts would be created. One dimension
would be Replication (the legend) and the other dimension would be a combination of Entity and the
statistics from the statistic category. Since three Entities were selected, there will be three charts. If
another statistic category is used there will be six charts. Note, though, that selecting more replications
will not result in more charts since the Group By option is Replication.
Pie and Pareto charts only support one dimension so, again if the same selections as above are used,
three Pie or Pareto charts would be created instead of one Bar chart. The only dimension is a combination
of all the selections. Since the Group By option was Entity and three statistics were selected there are
three Charts. The titles are Cycle Time By State : Processing : Replication 1, Cycle Time By State : Wait
For Resources : Replication 1, and Cycle Time By State : Hold For Conditions : Replication 1. The legend
for each is the selected Entities. This first of the three charts is shown below.
SIMPROCESS User’s Manual
240