1
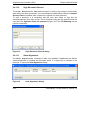
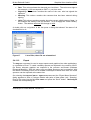
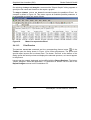
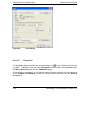
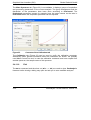
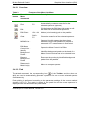
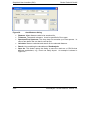
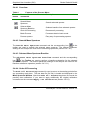
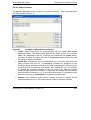
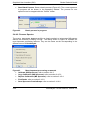
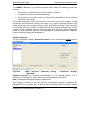
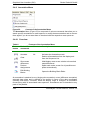
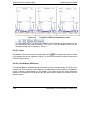
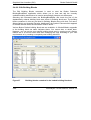
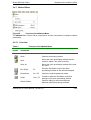
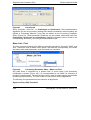
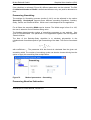
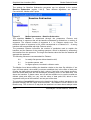
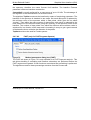
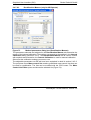
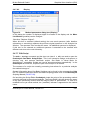
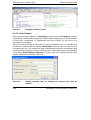
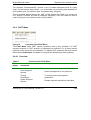
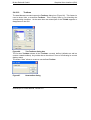
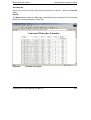
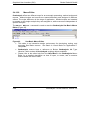
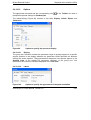
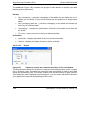
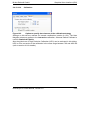
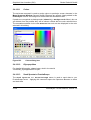
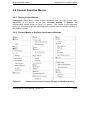
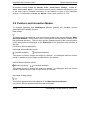
Bruker Daltonik GmbH
Graphical User Interface (GUI)
Pressing the <Ins> key a second time or selecting the related checkbox restores the
display. A spectrum is only displayed in the Mass Spectrum Window, if both
checkboxes (for spectrum and dedicated analysis) are selected.
Figure 27
2.4.2.10
Tree view of a disabled (not displayed) spectrum
Set Color
The Set Color command opens a palette of colors (Figure 28).
Figure 28
Palette of provided colors
This command is used to change the color of one or more selected mass spectra. If
only one spectrum is selected a white frame indicates the current color used for the
selected mass spectrum. To change the color, simply click the desired color box.
2.4.2.11
Default Color
In flexAnalysis color assignments are performed according to a color hierarchy. Each
color in this hierarchy has a unique value. Colors with higher values will be used prior
to colors with lower values. The Default Color command assigns colors to the
selected spectra, which are currently unused and have the highest scores in the color
hierarchy.
2.4.2.12
Set Selection Range
The Set Selection Range command is used to select a mass range of the
currently active spectrum within the Mass Spectrum Window, for example to run a
peak picking process in this specific range. Additionally, an intensity range can be
defined, when the button “Range/box selection type” is pressed.
In the dialog box minimal and maximal mass and intensity values can be entered to
define the ranges. If only the mass range is requested, choose “Range selection”, to
disable the intensity range.
flexAnalysis 3.0 User Manual, Version 3.0
2-21