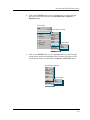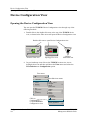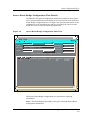
1
®
TRBMIM
Management Module Guide
Notice
Cabletron Systems reserves the right to make changes in speciÞcations and other information
contained in this document without prior notice. The reader should in all cases consult Cabletron
Systems to determine whether any such changes have been made.
The hardware, Þrmware, or software described in this manual is subject to change without notice.
IN NO EVENT SHALL CABLETRON SYSTEMS BE LIABLE FOR ANY INCIDENTAL,
INDIRECT, SPECIAL, OR CONSEQUENTIAL DAMAGES WHATSOEVER (INCLUDING BUT
NOT LIMITED TO LOST PROFITS) ARISING OUT OF OR RELATED TO THIS MANUAL OR
THE INFORMATION CONTAINED IN IT, EVEN IF CABLETRON SYSTEMS HAS BEEN
ADVISED OF, KNOWN, OR SHOULD HAVE KNOWN, THE POSSIBILITY OF SUCH
DAMAGES.
Virus Disclaimer
Cabletron has tested its software with current virus checking technologies. However, because no
anti-virus system is 100% reliable, we strongly caution you to write protect and then verify that
the Licensed Software, prior to installing it, is virus-free with an anti-virus system in which you
have conÞdence.
Cabletron Systems makes no representations or warranties to the effect that the Licensed
Software is virus-free.
Copyright © April 1998, by Cabletron Systems, Inc. All rights reserved.
Printed in the United States of America.
Order Number: 9031251 E6
Cabletron Systems, Inc.
P.O. Box 5005
Rochester, NH 03866-5005
SPECTRUM, the SPECTRUM IMT/VNM logo, DCM, IMT, and VNM are registered
trademarks, and SpectroGRAPH, SpectroSERVER, Inductive Modeling Technology,
Device Communications Manager, and Virtual Network Machine are trademarks of
Cabletron Systems, Inc.
Ethernet is a trademark of Xerox Corporation.
9031251 E6
i
Restricted Rights Notice
(Applicable to licenses to the United States Government only.)
1. Use, duplication, or disclosure by the Government is subject to restrictions as set forth in
subparagraph (c) (1) (ii) of the Rights in Technical Data and Computer Software clause at
DFARS 252.227-7013.
Cabletron Systems, Inc., 35 Industrial Way, Rochester, New Hampshire 03866-5005.
2. (a) This computer software is submitted with restricted rights. It may not be used,
reproduced, or disclosed by the Government except as provided in paragraph (b) of this
Notice or as otherwise expressly stated in the contract.
(b) This computer software may be:
(c)
(1)
Used or copied for use in or with the computer or computers for which it was
acquired, including use at any Government installation to which such computer or
computers may be transferred;
(2)
Used or copied for use in a backup computer if any computer for which it was
acquired is inoperative;
(3)
Reproduced for safekeeping (archives) or backup purposes;
(4)
Modified, adapted, or combined with other computer software, provided that the
modified, combined, or adapted portions of the derivative software incorporating
restricted computer software are made subject to the same restricted rights;
(5)
Disclosed to and reproduced for use by support service contractors in accordance with
subparagraphs (b) (1) through (4) of this clause, provided the Government makes
such disclosure or reproduction subject to these restricted rights; and
(6)
Used or copied for use in or transferred to a replacement computer.
Notwithstanding the foregoing, if this computer software is published copyrighted
computer software, it is licensed to the Government, without disclosure prohibitions, with
the minimum rights set forth in paragraph (b) of this clause.
(d) Any other rights or limitations regarding the use, duplication, or disclosure of this
computer software are to be expressly stated in, or incorporated in, the contract.
(e) This Notice shall be marked on any reproduction of this computer software, in whole or in
part.
ii
TRBMIM
Management Module Guide
Contents
Preface
Who Should Read This Manual ........................................................................................... xi
How This Manual Is Organized ........................................................................................... xi
Conventions ......................................................................................................................... xii
Related Reading................................................................................................................... xii
Getting Help ....................................................................................................................... xiii
Chapter 1
Introduction
What is in this Chapter...................................................................................................... 1-1
TRBMIM Management Module ......................................................................................... 1-1
TRBMIM Applications........................................................................................................ 1-2
Supported Firmware Revisions.......................................................................................... 1-3
SPMA and the TRBMIM .................................................................................................... 1-3
Chapter 2
Device View
What is in this Chapter...................................................................................................... 2-1
Device View ConÞguration ................................................................................................. 2-1
TRBMIM Physical Device View ......................................................................................... 2-2
Accessing the Physical Device View .................................................................................. 2-2
Logical Device Representation........................................................................................... 2-6
Accessing the Logical Device View .................................................................................... 2-6
Logical Device Icon..................................................................................................... 2-10
Logical Device Icon Components............................................................................... 2-11
Bridging Performance Access Label ................................................................... 2-13
Bridging Performance Access Icon Components ................................................ 2-14
Logical Port Icons ....................................................................................................... 2-15
Logical Port Icon Components ............................................................................ 2-17
Ring Management Icon.............................................................................................. 2-17
Ring Management Icon Component ................................................................... 2-18
Chapter 3
ConÞguration & Station Table Views
What is in this Chapter...................................................................................................... 3-1
Device ConÞguration View ................................................................................................. 3-2
Opening the Device ConÞguration View ..................................................................... 3-2
TRBMIM Device ConÞguration View Details............................................................. 3-3
Other ConÞguration Views ................................................................................................ 3-8
9031251 E6
iii
Chapter 3
ConÞguration & Station Table Views
(Continued)
Source Route Bridge ConÞguration View....................................................................3-8
Opening the Source Route Bridge ConÞguration View........................................3-8
Source Route Bridge ConÞguration View Details ................................................3-9
Source Route Port ConÞguration View......................................................................3-11
Opening the Source Route Port ConÞguration View..........................................3-11
Source Route Port ConÞguration View Details ..................................................3-11
Spanning Tree Port ConÞguration View ...................................................................3-12
Opening the Spanning Tree Port ConÞguration View .......................................3-12
Spanning Tree Port ConÞguration View Details ................................................3-13
Token Ring ConÞguration View .................................................................................3-15
Opening the Token Ring ConÞguration View .....................................................3-15
Token Ring ConÞguration View Details..............................................................3-16
Token Ring Ring ConÞguration View ........................................................................3-18
Opening the Token Ring Ring ConÞguration View ............................................3-18
Token Ring Ring ConÞguration View Details.....................................................3-18
Token Ring Security ConÞguration View ..................................................................3-20
Opening the Token Ring Security ConÞguration View ......................................3-20
Token Ring Security ConÞguration View Details...............................................3-20
Modify Allowed Station List Dialog Box ...................................................................3-22
Opening the Modify Allowed Station List Dialog Box .......................................3-22
Modify Allowed Station List Dialog Box Details ................................................3-22
Token Ring Device Model Information View ...................................................................3-25
Opening the Token Ring Device Model Information View .......................................3-25
Token Ring Device Model Information View Details................................................3-26
Token Ring Station Table Views.......................................................................................3-28
Token Ring Station Table View..................................................................................3-28
Opening the Token Ring Station Table View ......................................................3-28
Token Ring Station Table View Details ..............................................................3-29
Token Ring Station Isolating Errors Table View ......................................................3-32
Opening the Token Ring Isolating Errors Table View........................................3-32
Token Ring Station Isolating Errors Table View Details...................................3-33
Token Ring Non-Isolating Errors Table View ...........................................................3-34
Opening the Token Ring Non-Isolating Errors Table View ...............................3-34
Token Ring Non-Isolating Errors Table View Details ........................................3-34
Token Ring Station Alarm Thresholds View .............................................................3-35
Opening the Token Ring Station Alarm Thresholds View .................................3-35
Token Ring Station Alarm Thresholds View Details..........................................3-36
Token Ring Station Alarm States View .....................................................................3-37
Opening the Token Ring Station Alarm States View .........................................3-37
Token Ring Station Alarm States View Details .................................................3-37
Token Ring Station Detail View.................................................................................3-38
Opening the Station Detail View.........................................................................3-38
Station Detail View Details .................................................................................3-38
iv
TRBMIM
Management Module Guide
Chapter 3
ConÞguration & Station Table Views
(Continued)
Station Alarms Dialog Box ........................................................................................ 3-40
Opening the Station Alarms Dialog Box ............................................................ 3-40
Station Alarms dialog Box Details...................................................................... 3-41
Modifying Threshold Settings ............................................................................. 3-42
Reading Thresholds from a Station .................................................................... 3-43
Chapter 4
Event and Alarm Messages
What is in this Chapter...................................................................................................... 4-1
TRBMIM Events and Alarms ............................................................................................ 4-1
Index
9031251 E6
v
vi
TRBMIM
Management Module Guide
Figures
Chapter 2
Figure 2-1.
Figure 2-2.
Figure 2-3.
Figure 2-4.
Figure 2-5.
Figure 2-6.
Figure 2-7.
Figure 2-8.
Figure 2-9.
Chapter 3
Figure 3-1.
Figure 3-2.
Figure 3-3.
Figure 3-4.
Figure 3-5.
Device View
TRBMIM Bridging-Only Physical Device View .................................................. 2-4
TRBMIM Bridging and Management Physical Device View ............................. 2-5
TRBMIM Bridging-Only Logical Device View .................................................... 2-8
TRBMIM Bridging-and-Management Logical Device View ............................... 2-9
Logical Device Icon Interface Selections ........................................................... 2-11
TRBMIM Logical Device Application Icon Detail ............................................. 2-12
Bridging Performance Access Label .................................................................. 2-14
Port Icon Detail ................................................................................................... 2-16
Ring Management Icon Detail ........................................................................... 2-19
ConÞguration & Station Table Views
TRBMIM Device ConÞguration View .................................................................. 3-4
Source Route Bridge ConÞguration Table View .................................................. 3-9
TRBMIM Source Route Port ConÞguration View ............................................. 3-11
TRBMIM Spanning Tree Port ConÞguration View ........................................... 3-14
Cabletron Token Ring ConÞguration View ........................................................ 3-17
9031251 E6
vii
viii
TRBMIM
Management Module Guide
Tables
Chapter 2
Table 2-1.
Table 2-2.
Table 2-3.
Table 2-4.
Table 2-5.
Chapter 3
Table 3-1.
Table 3-2.
Table 3-3.
Table 3-4.
Table 3-5.
Table 3-6.
Table 3-7.
Chapter 4
Table 4-1.
Device View
Device Menu Selections Accessible from Logical Device Application Icon....... 2-13
Device Menu Selections Accessible from Bridging Performance Access Label 2-15
Port Menu Selections Accessible from Port Icon................................................ 2-16
Colors and Meanings for Logical Port Icon Status Labels ................................ 2-17
Ring Management Menu Selections Accessible from Ring Management Icon 2-19
ConÞguration & Station Table Views
Interface Configuration Table Field Definitions.................................................. 3-6
Component Table ViewÕs Field Definitions .......................................................... 3-7
Spanning Tree Port States and Definitions ....................................................... 3-15
Contact Status Color Definitions ........................................................................ 3-27
Information in Frame Breakdown Pie Chart..................................................... 3-39
Information in Isolating Errors Pie Chart ......................................................... 3-40
Information in Non-Isolating Errors Pie Chart ................................................. 3-40
Event and Alarm Messages
TRBMIM Events and Alarms ............................................................................... 4-2
9031251 E6
ix
x
TRBMIM
Management Module Guide
Preface
The Management Module Guide for the Cabletron SystemsTRBMIM serves as a
reference guide for the TRBMIM Management Module software. It provides all the
information you need to create, configure, and monitor TRBMIM devices in
SPECTRUM.
Who Should Read This Manual
You should read this manual if you are going to model and monitor a TRBMIM
device through SPECTRUM. Before reading this manual, you should be
familiar with SPECTRUMÕs operations. You should also be familiar with any
network management and hardware requirements described in the TRBMIM
documentation.
How This Manual Is Organized
This guide is organized as follows:
CHAPTER
DESCRIPTION
Chapter 1
Introduction
Describes the TRBMIM management module
and model types.
Chapter 2
Device View
This chapter describes the two types of Device
View for the TRBMIM Management Module Ñ
the Logical and Physical Device Views. The
discussion also includes an explanation of how
to use each of these views.
Chapter3
ConÞguration and Station
Table Views
Describes thevarious conÞguration views and
station table views for the TRBMIM and the
network management information provided by
each view.
Chapter 4
Event and Alarm Messages
Contains a listing and explanation of the alarm/
event messages generated in the Event Log or
Alarm Log View for the TRBMIM model type.
9031251 E6
xi
Conventions
Conventions
This manual uses the following conventions:
¥ Command names are printed in boldÑfor example: Clear or Save &
Close.
¥ Menu selections to access a view are printed in boldÑfor example:
ConÞguration or Detail.
¥ Buttons are represented by a shadowed boxÑfor example: Help .
Related Reading
Refer to the following documentation for more information on using
SPECTRUM and managing TCP/IP-based networks.
SPECTRUM System UserÕs Guide
SPECTRUM System AdministratorÕs Guide
LAN Troubleshooting Handbook, Mark Miller (1989, M&T Publishing, Inc.)
The Simple Book Ñ An Introduction to Management of TCP/IP-based
Internets, Marshall T. Rose, Performance Systems International, Inc.
ISO/IEC 802.5 Token Ring Standards Functional Spec., IEEE
Local Area Networking 802.5 Token Ring Access Method, IEEE
Computer Networks, Andrew S. Tanenbaum, Prentice-Hall, Inc.
Local Area Networks Architectures and Implementations, James Martin &
Kathleen K. Chapman for the Arben Group, Inc. (1989, Prentice-Hall, Inc.)
Preface
xii
TRBMIM
Management Module Guide
Getting Help
Getting Help
For additional support for SPECTRUM products, or to make comments or
suggestions regarding SPECTRUM or this manual, contact Cabletron
Systems Technical Support via one of the following means:
Location
Mail
FAX
Telephone
603-337-3075
603-337-3500
(*)-44-635-552062
(*)-44-635-580000
Europe
Cabletron Systems, Ltd.
Network House
Newbury Business Park
London Road, Newbury
Berkshire, England RG13 2PZ
E-mail: [email protected]
(*)-61-2-950-5950
(*)-61-2-950-5900
PaciÞc
Cabletron Systems, Inc.
Allambie Grove Estate
25 FrenchÕs Forest Road East
FrenchÕs Forest, NSW 2086
Sydney, Australia
E-mail: [email protected]
(*)-81-3-3240-1985
(*)-81-3-3240-1981
Japan
Cabletron Systems, KK
JTB Building 9F
164 Maranouchi
Chiyoda-ku
Tokyo 100 Japan
E-mail: [email protected]
(*)-65-7763382
(*)-65-7755355
Singapore
Cabletron Systems, Inc.
85 Science Park Drive
#03-03/04
The Cavendish
Singapore 051
E-mail: [email protected]
(*)-49-6103/991-229
(*)-49-6103/991-269
Germany
Cabletron Systems GmbH
Dreieich Park
Im GeÞerth 13d
63303 Dreieich
Frankfurt, Germany
E-mail: [email protected]
Cabletron Systems, Inc.
P. O. Box 5005
North America
Rochester, NH 03866-5005
E-mail: [email protected]
*International Operator Code
Questions About SPECTRUM Documentation?
E-MAIL
9031251 E6
Send your questions, comments or suggestions regarding SPECTRUM documentation
to the Technical Communications Department directly via the following internet
address:
[email protected]
Preface
xiii
Getting Help
Preface
xiv
TRBMIM
Management Module Guide
Chapter 1
Introduction
What is in this Chapter
This chapter describes CabletronÕs TRBMIMª (Token Ring Bridging Media
Interface Module), a SPECTRUM management module. It also lists the
speciÞc device models supported by this management module, and the model
type name assigned to the TRBMIM in SPECTRUM. The model type name
refers to the template used to specify attributes, actions, and associations for
certain device models in SPECTRUM.
TRBMIM Management Module
NOTE
If you are running a previous version of SPECTRUM, the following user
interface aspects may differ from those described in this publication for
SPECTRUM version 4.0:
¥ Order and names of menu selections
¥ Mouse button functionality and other navigational features
For information about menu selections and navigating within previous
versions of SPECTRUM, refer to the SPECTRUM System UserÕs Guide.
For information about menu selections and navigating within SPECTRUM
version 4.0, refer to the SPECTRUM Views reference.
The TRBMIM management module manages TRBMIM devices, using the
SNMP advanced network management agent and the Management
Information Bases (MIBs) which comes as part of the management module
software. The TRBMIM is an intelligent Token Ring concentrator with
9031251 E6
1-1
TRBMIM Applications
bridging capabilities. It provides port level control and statistics for
CabletronÕs Token Ring Bridging Media Interface Modules. It is fully IBM
Token Ring compatible and IEEE 802.5 compliant, using an Intel i960 RISC
processor for in-depth management functions. The module is designed to be
installed in a mid-chassis slot of a Cabletron Systems MMACª (Multi-Media
Access Center¨), constituting a two-port bridge that connects to one LAN
segment via the FNB¨ (Flexible Network Busª) and to another LAN
segment via a station port accessed on the TRBMIMÕs front panel.
A second-generation TRBMIM (CabletronÕs Dot5 Architecture, available on
Þrmware version 2.00 or higher) also is capable of ring management, as well
as providing intelligence to the hub. This capability is available as a switchselectable mode determined by the setting of hardware switch (S2 in Bank 1,
SW1) on the TRBMIM unit. To change modes, you must remove the unit from
the system, set the switch to its desired position, and then reinstall the unit in
its MMAC slot; the Þrmware will then set the card to the desired mode when
the card is rebooted. If the switch is ON, or in the up position, the device boots
up for the Bridging-Only mode, and the TRBMIM unit will be the only thing
that appears in the SPECTRUM Device View. If the switch is OFF, or in the
down position, the device boots up in the Bridging and Management mode,
and the SPECTRUM Device View will also include the hub and associated
devices.
SPECTRUM management of the TRBMIM is based on the following
Management Information Bases (MIBs), which come as part of the software
module for the model type:
¥
¥
¥
¥
¥
¥
¥
Cabletron Dot5 MIB
Cabletron Bridging MIB
IETF Bridging MIB
Cabletron Token Ring FNB MIB
Cabletron DownLoad MIB
Internet MIB-II (RFC 1213)
Cabletron Chassis MIB
The following chapters explain how you use SPECTRUM and the
management module software to monitor your TRBMIM.
TRBMIM Applications
The TRBMIM management module supports both common and device-speciÞc
applications described in the MIB II Applications, Bridging Applications,
and Miscellaneous Applications references. SPECTRUM management of a
TRBMIM is based on the following common and device-speciÞc applications:
¥ Bridging (Gen_Bridge_App)
- Spanning Tree (Span_Tree_App)
- Spource Routing (Source_Rt_App
Introduction
1-2
TRBMIM
Management Module Guide
Supported Firmware Revisions
- Static (Static_App)
¥ MIB-II (SNMP2_Agent)
-
IP (IP2_App)
System (System2_App)
ICMP (ICMP_App)
UDP (UDP2_App)
¥ Download App (CtDownLoadApp)
The TRBMIM Management Module also supports RMON and DLM, and
SPECTRUM management of these MIBs may be purchased separately. Refer
to the documentation provided with the RMON and DLM management
modules for descriptions of these capabilities. The following chapters explain
how to use SPECTRUM and the management module software to monitor and
manage a TRBMIM Management Module.
NOTE
If there is an Uninterruptible Power Supply (UPS) inline with your system,
CtUPS_App will appear as a major software application.
Supported Firmware Revisions
You should create the TRBMIM model using the Model Type Name that
corresponds to the Þrmware revision of your TRBMIM. For the BdgCSITRBM,
the Þrmware revision is 2.00.00 or higher. Firmware versions 1.00 and 1.01
provide only Bridge-Only support.)
SPMA and the TRBMIM
The TRBMIM Management Module provides direct access via button
selections from the Device ConÞguration View to two SPMA (SPECTRUM
Portable Management Applications) tools, as discussed on page 3-7 (see
Download Application and Trap Table). Additional SPMA application can be
accessed by selecting the Applications option on the Utilities selection on the
Icon Subviews menu. To open the SPMA Applications menu from any
SPECTRUM view, do the following:
1. Select TRBMIM model.
2. Select Icon Subviews from the View menu.
3. Select Utilities from the Icon Subviews menu.
9031251 E6
Introduction
1-3
SPMA and the TRBMIM
4. Select Applications from the Utilities menu.
The following SPMA applications are available in the resulting SPMA
Applications View as button selectable functions:
For type BdgCSITRBM:
Community Names
Hub View
Trap Table
For Gen Bridge App of type Gen_Bridge_App:
Bridge View
For type CtTokenRingApp (Network 1):
Alarm ConÞguration
Ring Map
Security
Statistics
For type HubCSITR (Network 2) [Applicable only if device is in Management
mode; not available if device in Bridge-Only mode.]:
Alarm ConÞguration
Ring Map
Security
Statistics
For MIB-II of type SNMP2_Agent:
Generic SNMP (MIB I II)
For DownLoad App of type CtDownLoad App:
TFTP download
For a full discussion of how to activate and use the various SPMA utilities,
refer to the SPECTRUM Portable Management Application for the
TRBMIM UserÕs Guide, which contains the following information:
¥ Chapter 2, Introduction to SPMA for the TRBMIM, explains how to
navigate through the Hub View, monitoring Hub activity, as well as
managing the hub at the device, module, and port levels.
¥ Chapter 3, Ring Map, explains how to open the Ring Map window,
describes the Ring Map display, and provides instructions for changing the
map poll interval, setting the statistics calculation mode, and assigning
station labels. Chapter 3 also describes the Map Error table, assigning a
station name and drop, the Quick Info Pop-Up window, the Management
Station ConÞguration window, the Ring History Information window,
together with procedures for using the Ring Map windowÕs Find features
and accessing other SPMA Token Ring applications.
¥ Chapter 4, Alarm ConÞguration, explains how to set Alarms at the Ring
and Station levels.
¥ Chapter 5, Statistics, discusses viewing the Ring Station List statistics,
Monitoring Ring statistics, and Station statistics, as well as Ring
Variables and Station Variables.
Introduction
1-4
TRBMIM
Management Module Guide
SPMA and the TRBMIM
¥ Chapter 6, Ring Security ConÞguration, explains how to set security for a
selected ring, explains the Security ConÞguration window Þelds and
buttons, including the Allowed and Disallowed Station Lists, and
discusses conÞguration of ring security via the Security ConÞguration
window.
¥ Chapter 7, Using the TRBMIM Bridge View, explains bridging methods,
gives a tour of the Bridge TrafÞc View, describes use of the Detail View,
tells how to monitor bridge operation, explains how to conÞgure bridge
operating parameters, and gives instructions for setting forwarding
thresholds, statistics, and notiÞcation options, as well as setting polling
parameters and enabling/disabling bridges.
In addition, the SPECTRUM Portable Management Application Tools Guide
also provides details on other SPMA views and functions, as follows:
¥ Chapter 2, Using the MIB I, MIB II Tool, explains how to use this tool in
order to view and to change MIB I and MIB II object ID values.
¥ Chapter 3, Using the Community Names Tool, explains CabletronÕs
ÒComponentÓ structure of device MIBs and describes how to change device
community names.
¥ Chapter 5, Using TFTP Download Tool, explains how to upgrade Þrmware
on Cabletron devices equipped with Flash EEPROMs.
¥ Chapter 6, The Traps Table Tool, explains how to establish which network
management workstations on your network will receive trap alarms from
a selected device, as well as providing a brief overview of some of the traps
supported by Cabletron SystemsÕ devices.
¥ Chapter 7, Using Charts and Meters, explains how to launch charts or
meters (used to analyze device statistics) from a UNIX prompt, and also
how to control the Meter ToolÕs display.
¥ Chapter 8, ConÞguring and Monitoring an Uninterruptible Power Supply,
introduces the UPS system (which connects a computer interface port to
an intelligent MIM) and explains how to start, conÞgure, and monitor the
UPS Tool.
¥ Chapter 9, Using DLM, explains how to manage Òsmart hubÓ devices, or
DLM Servers, on your network. This chapter also describes accessing the
DLM Application and its windows, adding/deleting DLM entries, and
managing DLM.
¥ Chapter 10, Using the Path Tool, explains how to generate a list of router
hops between a managed Cabletron device and a remote destination, and
also how to display speciÞc information about each hop found in the router
path.
¥ Chapter 11, MIB Tree/ MIB Tools, provides an overview of the MIB
Browser, the MIB Details tool, the MIB Editor, and outlines how to browse
the MIB Tree.
9031251 E6
Introduction
1-5
SPMA and the TRBMIM
Introduction
1-6
TRBMIM
Management Module Guide
Chapter 2
Device View
What is in this Chapter
This chapter provides a description of the two types of Device View for the
TRBMIM Management Module Ñ the Logical and Physical Device Views. The
discussion also includes an explanation of how to use each of these views.
The Device View for the TRBMIM lets you view the logical representations of
the TRBMIM device and ports.The Device View also lets you access various
menus leading to views that monitor and control the TRBMIM and its
ports.You can access the Device View by clicking on the Device View button
icon on the selected TRBMIM model, by selecting the applicable View > Icon
Subviews > Device options from the menu bar, or by clicking the right
mouse button on the TRBMIM model icon to activate the Icon Subviews
menu and then selecting the desired option.
Device View ConÞguration
The Device View gives an actual dynamic representation of the current
TRBMIM conÞguration used in your system. If the conÞguration changes, you
see the corresponding change in this view, updated with the next-following
polling cycle. Four different Device Views are available, depending both on
whether you select a logical or physical view and on whether the TRBMIM
module was set for Bridging-Only mode or for Bridging-and-Management
mode when last booted.
The mode is controlled by Þrmware selected by the position 2 switch (S2) in
hardware switch Bank 1 (SW1) on the TRBMIM card. In the ON (up) position,
this switch selects Bridging-Only mode; in the OFF (down) position, the
switch selects Bridging-and-Management mode. Figure 2-1 on page 2-4
illustrates a Physical Device View when the module has been set for Bridging-
9031251 E6
2-1
TRBMIM Physical Device View
Only capabilities, in which case the Device View shows only the TRBMIM unit
itself. Figure 2-2 on page 2-5 shows the Physical Device View when the
module has been set for Bridging-and-Management capabilities, in which case
the Device View shows representations not only for the TRBMIM but also for
the associated Hub modules. Similarly, Figure 2-3 on page 2-8 shows the
Logical Device View for the Bridging-Only mode and Figure 2-4 on page 2-9
shows the Logical Device View for the Bridging-and-Management mode.
TRBMIM Physical Device View
The lower part of the Physical Device View (see Figure 2-1 and Figure 2-2)
shows a representation of the actual equipment being modeled Ñ exactly as
you would see them if you were to stand in front of the rack in which they are
mounted. At the present time, the indicator lights of the TRBMIM
components of this program are not implemented; a future revision will
provide near-real-time monitoring of associated signal conditions for those
indicators.
Accessing the Physical Device View
You can access the TRBMIMÕs Physical Device View through any of the
following methods:
1. Double-click on the Device View button of the TRBMIM device icon, as
shown below. This action will open up whichever Device View was last
opened for that device (i.e., Logical or Physical).
Location View Icon
Topology View Icon
Device View Button
Device View
2-2
TRBMIM
Management Module Guide
Accessing the Physical Device View
2. Click on the TRBMIM device icon to highlight that icon and then pull
down the View menu and select the Icon Subviews -> Device ->
Physical option.
View menu
Ctrl+b
Go Back
Go Up
Icon Subviews
View Path
New View
Bookmarks
View History
Current View Info...
Notes...
Jump by name...
Zoom
Map Hierarchy
Icon Subviews menu
Close Ctrl+c
Navigate
Alarms
Performance
Notes...
Utilities
Device
Zoom
Device
DevTop
Logical
Application
Acknowledge Physical
menu
3. Click on the TRBMIM device icon to highlight that icon, click the right
mouse button inside that highlighted area to display a duplicate of the
Icon Subviews menu, and then select the Device -> Physical option.
Icon Subviews menu
Ctrl+c
Close
Navigate
Alarms
Performance
Notes...
Utilities
Device
Zoom
Device
DevTop
Logical
Application
Physical
Acknowledge
9031251 E6
menu
Device View
2-3
Accessing the Physical Device View
Figure 2-1.
TRBMIM Bridging-Only Physical Device View
Primary Landscape 0x00400000 - VNM Host - MMAC Plus of type BdgCSITRBMs
* File
View
Model Name 134.141.68.94
Help?
Network Address
134.141.68.94
Contact
Description
Cabletron TRBMIM Revision 2.01.10
Location
Primary Application
Gen Bridge App
System Up Time 103+11:36:12
Manufacturer
Cabletron Systems
Device Type
TRBM
Serial Number
TRBMIM
SN
RESET
BOK
16 Mb
WFLT
WRP
STBY
ERR
16 Mb
LWRP
NSRT
RWRP
S
T
N
F
N
B
S
T
A
T
I
O
N
C
O
N
S
O
L
E
TOKEN RING
Device View
2-4
TRBMIM
Management Module Guide
Accessing the Physical Device View
Figure 2-2.
TRBMIM Bridging and Management Physical Device View
Primary Landscape 0x00400000 - VNM Host - MMAC Plus of type BdgCSITRBMs
* File
View
Help?
Model Name 134.141.68.94
Network Address
System Up Time 14+01:47:32
134.141.68.94
Contact
Description
Cabletron TRBMIM Revision 2.01.10
Location
Primary Application
TRMIM-34A TRRMIM-4A
LNK
PEN
Err
SN
LNK
PEN
16 Mb
13
14
15
16
17
18
19
20
21
22
23
24
SN
LNK
PEN
MGT
1
2
3
4
5
6
7
8
9
10
11
12
1
2
3
4
5
6
7
8
9
10
11
12
ER
HH
Mb
CR
HF
HP
FO
FL
1
X
2
X
1
12
24
1
2
3
4
5
6
7
8
9
10
11
12
13
X
1
X
14
X
15
X
3
X
4
X
16
X
4
X
5
X
I
N
17
X
5
X
18
X
6
X
6
X
TH
RC
7
X
19
X
7
X
8
X
20
X
8
X
9
X
21
X
9
X
22
X
10
X
R
I
N
G
10
X
11
X
TH
9031251 E6
13
14
15
16
17
18
19
20
21
22
23
24
RC
ACTIVE STP
TOKEN RING
O
U
T
SN
Device Type
TRBM
Serial Number
Gen Bridge App
TRRMIM-A
Cabletron Systems
TRBMIM
SN
MGMT
R
I
N
G
12
X
ACTIVE STP
TOKEN RING
PEN
LNK
ERR
16 Mb
2
X
3
X
13
TRM-24A
SN
LNK
PEN
Manufacturer
23
X
11
X
24
X
12
X
ACTIVE UTP
TOKEN RING
RESET
ERR
MGMT
16Mb
R1 R0
CRS16
HLPT
FWP
FO
FLIX
BOK
16 Mb
WFLT
WRP
STBY
ERR
16 Mb
LWRP
NSRT
RWRP
S
T
N
F
N
B
S
T
A
T
I
O
N
R
I
N
G
TX
I
N
RX
R
I
N
G
TX
RX
STP
TOKEN RING
O
U
T
C
O
N
S
O
L
E
TOKEN RING
Device View
2-5
Logical Device Representation
Logical Device Representation
Instead of presenting a physical image of the TRBMIM, the Logical Device
View representation provides gauges and information about the device, the
modules it manages, and their station and ring ports. Figure 2-3 on page 2-8
shows a representation of a TRBMIM Logical Device View with Bridging-Only
capabilities. Figure 2-4 on page 2-9 shows a representation of a TRBMIM
Logical Device view with Bridging-and-Management capabilities, with this
view therefore including the associated cards and their respective logical
station port icons.
In both cases, the logical representation of the TRBMIM module shown in the
lower portion of the Device view is divided into different areas, as identiÞed by
the captions in these views. The Device Icon area at the top of the module
representation presents information about the device. The Bridging Icon
identiÞes the function of the module. The Logical Port Icon area presents
information about the station and the FNB ports. Finally, the Ring
Management Icon area (present only in Bridging-and-Management mode)
presents information about the Ring ports.
Accessing the Logical Device View
You can access the Logical Device view through any of the following methods:
1. Double-click on the Device view button of the TRBMIM device icon, as
shown below. This action will open up whichever Device view was last
opened for that device (i.e., Logical or Physical).
Location View Icon
Topology View Icon
Device View Button
Device View
2-6
TRBMIM
Management Module Guide
Accessing the Logical Device View
2. Click on the TRBMIM device icon to highlight that icon, pull down the
View menu, and select the Icon Subviews -> Device -> Logical option.
Ctrl+b
Go Back
Go Up
Icon Subviews
View Path
New View
Bookmarks
View History
Current View Info...
Notes...
Jump by name...
Zoom
Map Hierarchy
Close Ctrl+c
Navigate
Alarms
Performance
Notes...
Utilities
Zoom
Device
DevTop
Logical
Application
Physical
Acknowledge
3. Click on the TRBMIM device icon, click the right mouse button inside that
highlighted area to display the Icon Subviews menu, and then select the
Device -> Logical option.
Close Ctrl+c
Navigate
Alarms
Performance
Notes...
Utilities
Zoom
Device
DevTop
Logical
Application
Acknowledge Physical
9031251 E6
Device View
2-7
Accessing the Logical Device View
Figure 2-3.
TRBMIM Bridging-Only Logical Device View
Primary Landscape 0x00400000 - VNM Host - MMAC Plus of type BdgCSITRBMs
* File
View
Help?
Model Name 134.141.68.94
Network Address
134.141.68.94
Contact
Description
Cabletron TRBMIM Revision 2.01.10
Location
Slot Number
Device Label
Device View
2-8
Primary Application
Gen Bridge App
System Up Time 57+17:22:51
Manufacturer
Cabletron Systems
Device Type
TRBM
Serial Number
4
TRBMIM
Logical Device Application Icon
Bridging
Bridging Icon
STATION
FWD
TR
Logical Port Icon
FNB
FWD
TR
Logical Port Icon
TRBMIM
Management Module Guide
Accessing the Logical Device View
Figure 2-4.
TRBMIM Bridging-and-Management Logical Device View
Primary Landscape 0x00400000 - VNM Host - MMAC Plus of type BdgCSITRBMs
* File
View
Help?
Model Name 134.141.68.94
Network Address
System Up Time 29+131:27:14
134.141.68.94
Contact
Description
Cabletron TRBMIM Revision 2.01.10
Location
8
Primary Application
INS
TR-34-A
16M MGMT
1
2
3
4
5
6
7
8
9
10
11
12
13
14
15
16
17
18
19
20
21
22
23
24
ENB
ENB
ENB
ENB
ENB
ENB
ENB
ENB
ENB
ENB
ENB
ENB
ACT
ENB
ENB
ENB
ENB
ENB
ENB
ENB
ENB
ENB
ENB
ENB
ENB
Frms 00
Frms
Frms 00
Frms
Frms
Frms 00
Frms 00
Frms
Frms 00
Frms
Frms
Frms 00
Frms 00
Frms
Frms
Frms 00
Frms 00
Frms
Frms 00
Frms
Frms
Frms 00
Frms 00
Frms
Frms
Frms 00
Frms
Frms 00
Frms 00
Frms
Frms 00
Frms
Frms 00
Frms
Frms 00
Frms
Frms
Frms 00
Frms 00
Frms
Frms 00
Frms
Frms 00
Frms
Frms 00
Frms
Frms
Frms 00
7
INS
6
TRR-A
TR-24-A
16M MGMT
16M MGMT
Frms 0
1
2 INS Frms 0
3 INS Frms 0
4 ENB Frms 0
5 INS Frms 0
6 ENB Frms 0
7 ENB Frms 0
8 ENB Frms 0
9 INS Frms 0
1
2
3
4
5
6
7
8
9
10
11
12
13
14
15
16
17
18
19
20
21
22
23
24
INS
10INS Frms 0
11 INS Frms 0
12 ENB Frms 0
R1
R0
WRAP
ACT
ENB
ENB
ENB
ENB
ENB
ENB
ENB
ENB
ENB
ENB
ENB
ENB
ACT
ENB
ENB
ENB
ENB
ENB
ENB
ENB
ENB
ENB
ENB
ENB
ENB
Frms 00
Frms
Frms 00
Frms
Frms
Frms 00
Frms 00
Frms
Frms 00
Frms
Frms
Frms 00
Frms 00
Frms
Frms
Frms 00
Frms 00
Frms
Frms 00
Frms
Frms
Frms 00
Frms 00
Frms
Frms
Frms 00
Frms
Frms 00
Frms 00
Frms
Frms 00
Frms
Frms 00
Frms
Frms 00
Frms
Frms
Frms 00
Frms 00
Frms
Frms 00
Frms
Frms 00
Frms
Frms 00
Frms
Frms
Frms 00
Cabletron Systems
Device Type
TRBM
Serial Number
Gen Bridge App
INS
Manufacturer
5
INS
TRR-A
16M MGMT
R1 WRAP
R0
ACT
Ring
Management
Icon for Station Port
9031251 E6
4
TRBMIM
Bridging
STATION
FWD
TR
FNB
FWD
TR
Network 1
16M
R1
Network 2
16M
R2
Ring
Management
Icon for FNB
Device View
2-9
Accessing the Logical Device View
Logical Device Icon
Logical Device Icon
The TRBMIM Logical Device Application Icon displayed in the Logical Device
view (refer to Figure 2-3 or Figure 2-4) has speciÞc double-click zones that
provide access to speciÞc views, as designated by the left-side captions in
Figure 2-5. In addition, as designated by the right-side captions in that same
Þgure, right-clicking in each of the different areas in the Logical Device
Application Icon provides access to device menus pertaining to the given area.
These device menus provide the same access paths given by the View > Icon
Subviews menu when the associated area is highlighted.
To access these device menus, move the cursor to the desired icon and click the
right mouse button. This causes the system to display a duplicate copy of the
File > Icon Subviews menu as a pop-up menu that remains on display only
so long as you hold your right mouse button depressed. While this device
menu selection is on display, you can slide the cursor down through the listed
options; whichever option currently is covered by the cursor when you release
the button becomes selected. (Alternatively, you can click the left mouse
button on the same icon area and then pull down the View menu from the
Logical Device view menu bar and select its Icon Subviews option. The
resulting steady-state menu remains on display until you move the cursor to
one of its options and click the left mouse button.)
Figure 2-6 provides a breakdown of the Logical Device Icon for the TRBMIM,
its double-click zones, and the associated device menu selections. Table 2-1
provides deÞnitions of the different device menu selections.
Device View
2-10
TRBMIM
Management Module Guide
Accessing the Logical Device View
Logical Device Icon Components
Figure 2-5.
Logical Device Icon Interface Selections
Right-Click Icon
Subviews Menu Selections
Double-Click Zone
View Selections
Notes View
Device ConÞguration View
Performance View
4
TRBMIM
Bridging
STATION
FWD
TR
Spanning Tree Port
ConÞguration View
(Respective Port)
Cabletron Token Ring
ConÞguration View
(for Station Port)
Cabletron Token Ring
ConÞguration View
(for FNB)
FNB
FWD
TR
Network 1
16M
R1
Network 2
16M
R2
Cabletron Token Ring
Station Table View
(Respective Network)
Close
Navigate ->
Alarms
Performance
NotesÉ
Utilities ->
Physical Device
Devtop
Application
ConÞguration
Model Information
Module Notes
Close
Navigate ->
Alarms
Performance
NotesÉ
Utilities ->
Source Route ConÞguration
Source Route Statistics
Spanning Tree
(For Respective Port)
Close
Navigate ->
Alarms
Performance
NotesÉ
Utilities ->
Port ConÞguration
Port Performance
Port Model Information
(For Respective Network)
Close
Navigate ->
Alarms
Performance
NotesÉ
Utilities ->
ConÞguration
Stations
Station Errors
Model Information
Logical Device Icon Components
The Logical Device Application Icon, which actually consists of the entire
management module representation in the Logical Device view, contains two
double-click areas providing information pertaining to the device (refer to
Figure 2-6), as well as the subordinate areas pertaining to speciÞc functions,
ports, or networks. These double-click areas have the following functions:
9031251 E6
Device View
2-11
Accessing the Logical Device View
Logical Device Icon Components
SlotNumber/Module Notes Access Label Ð Displays the number
identifying the hub slot location occupied by the TRBMIM module being
viewed. Double-clicking on this label accesses the Notes window for the
TRBMIM.
Device Label Ð IdentiÞes the TRBMIM as the type of physical device being
modeled. Double-clicking on this label accesses the TRBM Device
ConÞguration view (see page 2-8).
Figure 2-6.
TRBMIM Logical Device Application Icon Detail
Slot Number/Module Notes Access Label
(Double-click to access TRBMIMÕs Notes window)
Logical
Device
Icon
4
TRBMIM
Device Label
(Double-click to access TRBMIMÕs Device ConÞguration
View)
Press right mouse button to access
TRBMIMÕs device menu
Close
Navigate
Alarms
Performance
NotesÉ
Utilities
ConÞguration
Stations
Ctrl+c
Device
Menu
(Same as
Icon
Subviews
Menu)
Station Errors
Model Information
Device View
2-12
TRBMIM
Management Module Guide
Accessing the Logical Device View
Logical Device Icon Components
Bridging Performance Access Label
Table 2-1.
Device Menu Selections Accessible from Logical Device Application
Icon
Menu Selection
Description
Close
Closes Logical Device view.
Navigate
Opens Navigator submenu, allowing you to navigate
in or up. For more information on the Navigator submenu refer to Chapter 4 in the SPECTRUM
Views reference.
Alarms
Opens the Alarms view, which identiÞes alarms (if
any) for the model.
Performance
Opens the Performance view for the TRBMIM
device. (Available only when Primary Application
selection is for an application that supports the
Performance view.)
Notes...
Opens the SPECTRUM Notes facility for the device.
Utilities
Opens the Utilities submenu, allowing you to access
any SPMA or other non-core utilities you have
purchased for SPECTRUM
ConÞguration
Opens the TRBM Device ConÞguration view for this
device. For further information on this view and its
related views, refer to Device ConÞguration View,
starting on page 3-2.
Stations
Opens the Token Ring Station Table view. For
further information on this view and its related
views, refer to Token Ring Station Table Views,
starting on page 3-28.
Station Errors
Opens the Token Ring Station Isolating Errors view.
For further information on this view and its related
views, refer to Token Ring Station Isolating Errors
Table View, starting on page 3-32.
Model Information
Opens the TRBM Model Information view for this
device.
The Bridging Performance Access Label consists of one icon, which
corresponds to the models in the Gen_Bridge_App in the Application view. The
Bridging Performance Access Label displays the bridging information for the
TRBMIM device and provides a device-related pop-up menu, which is the
same menu you would get if you were to click on that same label and then
select Icon Subviews from the View menu. To access the device menu,
depress the right mouse button while the cursor is on the Bridging
Performance Access Icon to bring up the device menu, and then slide the
9031251 E6
Device View
2-13
Accessing the Logical Device View
Logical Device Icon Components
cursor down through that menu to select the desired option. Alternatively, you
can click once on the Bridging Performance Access Icon to highlight that icon
and then select the View > Icon Subviews option from the menubar.
Figure 2-7 provides a breakdown of the Bridging Performance Access Label for
the TRBMIM and its associated device menu selections. Table 2-2 provides
deÞnitions of the associated device menu selections.
Bridging Performance Access Icon Components
The Bridging Performance Access Label (refer to Figure 2-7) consists of one
area providing information pertaining to the ring ports. The Bridging
Performance Access Label displays the bridging capabilities for the TRBMIM.
Double-clicking on this label accesses the Performance view.
Figure 2-7.
Bridging Performance Access Label
Bridging
Performance
Access
Label
Bridging
(Double-click to access TRBMIMÕs Performance View.)
[Provided via Gen_Bridge_App]
Press right mouse button to access
TRBMIMÕs device menu.
Close
Navigate
Alarms
Performance
Ctrl+c
Device
Menu
NotesÉ
Utilities
Source Route ConÞguration
Source Route Statistics
(Same as
Icon
Subviews
Menu)
Spanning Tree
Device View
2-14
TRBMIM
Management Module Guide
Accessing the Logical Device View
Logical Port Icons
Logical Port Icons
Table 2-2.
Device Menu Selections Accessible from Bridging Performance
Access Label
Menu Selection
Description
Close
Closes the Logical Device view.
Navigate
Opens the Navigator submenu, allowing you to
Navigate In or Up. For more information on the
Navigator sub-menu, refer to Chapter 4 in the
SPECTRUM Views reference.
Alarms
Opens the Alarms view, which identiÞes alarms (if
any) for the model.
Performance
Opens the Performance view for the TRBMIM
model.
Notes...
Opens the SPECTRUM Notes facility for the device.
Utilities
Opens the Utilities submenu, allowing you to access
any SPMA or other non-core utilities you have
purchased for SPECTRUM.
Source Route ConÞguration
Opens the Source Route Bridge ConÞguration Table
for this device. For further information on this view
and its related views, refer to Source Route Port
ConÞguration View, starting on page 3-11.
Source Route Statistics
Opens the Source Route Bridge Statistics Table for
this device.
Spanning Tree
Opens the Spanning Tree Information view.
The Logical Port Icons have speciÞc double-click zones and a device-related
pop-up port device menu, which is the same menu you would get if you were to
click on that same Logical Port Icon and then select Icon Subviews from the
View menu. To access the port device menu, depress the right mouse button
while the cursor is on the Logical Device Icon to bring up the menu, slide the
cursor down to the desired option, and then release the mouse button.
Alternatively, you can click on the Logical Port Icon zone and then select the
View > Icon Subviews option from the menubar. All of these subviews can also
be accessed from the DevTop View.
Figure 2-8 provides a breakdown of the Logical Port Icon and the associated
port device menu selections. Table 2-3 provides deÞnitions of the port device
menu selections.
9031251 E6
Device View
2-15
Accessing the Logical Device View
Logical Port Icons
Figure 2-8.
Port Icon Detail
Logical Port Icon
Spanning
Tree
Port
Type
Port Status Label
STATION
FWD
TR
Press right mouse
button anywhere in
Logical Port Icon
to access Port menu.
Interface Status/Spanning Tree Access Label
(Double-click on this label to access
Spanning Tree Port ConÞguration screen.)
Ctrl+c
Close
Navigate
Alarms
Performance
Port
Menu
NotesÉ
Utilities
Port ConÞguration
Port Performance
(Same as
Icon
Subviews
Menu)
Port Model Information
Table 2-3.
Port Menu Selections Accessible from Port Icon
Menu Selection
Device View
2-16
Description
Close
Closes the Logical Device view.
Navigate
Opens the Navigator submenu, allowing you to Navigate
In or Up. For more information on the Navigator submenu
refer to Chapter 4 in the SPECTRUM Views reference.
Alarms
Opens the Alarms view, which identiÞes alarms (if any)
for the model.
Performance
Opens the Performance view for the TRBMIM device.
(Available only when Primary Application selection is for
an application that supports the Performance view.)
Notes...
Opens the SPECTRUM Notes facility for the device.
Utilities
Opens the Utilities submenu, allowing you to access any
SPMA or other non-core utilities you have purchased for
SPECTRUM.
TRBMIM
Management Module Guide
Accessing the Logical Device View
Ring Management Icon
Table 2-3.
Port Menu Selections Accessible from Port Icon (Continued)
Port ConÞguration
Opens the Spanning Tree Port ConÞguration view for this
port. For further information on this view and its related
views, refer to Spanning Tree Port ConÞguration View,
starting on page 3-12.
Port Performance
Depending on current Primary Application selection,
opens applicable Performance view for this port.
Port Model
Information
Opens the Generic Bridge Port Model Information view
for this port.
Logical Port Icon Components
The Logical Port Icons consist of three areas providing information pertaining
to the station ports (refer to Figure 2-8). These areas have the following
functions:
Port Status Label Ð The port status label, designated either STATION or
FNB.
Port Type Label Ð The port type label. For a TRBMIM, this value is always
TR (Token Ring).
Interface Status/Spanning Tree Access Label Ð Shows the status of the
port, as follows:
Table 2-4.
Colors and Meanings for Logical Port Icon Status Labels
Status Label
Color
Meaning
BLK
Orange
Blocking
BRK
Red
Broken
DIS
Blue
Disabled
FWD
Green
Forward
LRN
Magenta
Learning
LST
Magenta
Listening
Ring Management Icon
The Ring Management Icon appears on the TRBMIMÕs Logical Device view
only when the TRBMIM is in Bridging-and-Management mode (refer to
Figure 2-4). This icon provides a link to the managed ring. It has a doubleclick zone and a pop-up Ring Management menu, which is the same menu you
9031251 E6
Device View
2-17
Accessing the Logical Device View
Ring Management Icon
would get if you were to click on that same icon and then select Icon
Subviews from the View menu. To access the Ring Management menu,
position the cursor on the Ring Management Icon and depress the right mouse
button to display the menu, then slide the cursor down to the desired option
and release the mouse button. Alternatively, you can click in that same icon
area and then select the View > Icon Subviews option. In addition, you can
also access these same subviews by clicking on the HubCSITR icon in the
Application view and then either selecting the Icon Subviews option from the
View menu or else holding down the right mouse button while the cursor is on
that HubCSITR icon. The list of options obtained thereby also provides access
to the DevTop view, as well as the ones accessible from the Logical Device
view.
Figure 2-9 provides a breakdown of the Ring Management Icon, its applicable
double-click zone, and the Ring menu selections. Table 2-5 provides deÞnitions
of the associated Ring Management menu selections.
Ring Management Icon Component
The Ring Management Icon (refer to Figure 2-9) consists of three areas
providing information pertaining to the ring ports. These areas have the
following functions:
Station Port Network Label Ð The Station Port Network Label identiÞes
the port-connected devices as a management ring.
Device View
2-18
TRBMIM
Management Module Guide
Accessing the Logical Device View
Ring Management Icon
Figure 2-9.
Ring Management Icon Detail
Ring Management Icon
Station Port Network Label
Spanning
Tree
Port
Type
Ring Speed Label
(Double-click on this label to access
Token Ring Station Table view.)
Network 1
16M
R1
Press right mouse
button anywhere in
Ring Management Icon
to access TRBMIMÕs
Ring Management Menu
Ctrl+c
Close
Navigate
Alarms
Performance
Performance
NotesÉ
Utilities
ConÞguration
Stations
Port
Menu
(Same as
Icon
Subviews
Menu)
Station Errors
Model Information
Ring label Ð The Ring Label, color-coded to show association with the
devices managed by the TRBMIM, identiÞes which port the TRBMIM
controls. Double-clicking on this label accesses the Device ConÞguration view
for this device.
Ring Speed Label Ð The Ring Speed Label identiÞes the ring speed; the
representation in Figure 2-9, for example, shows the associated network as
operating at a speed of 16 megabits/second. Double-clicking on this label
accesses the Token Ring Station Table view for this device.
Table 2-5.
Ring Management Menu Selections Accessible from Ring
Management Icon
Menu Selection
9031251 E6
Description
Close
Closes the Logical Device view.
Navigate
Opens the Navigator submenu, allowing you to
Navigate In or Up. For more information on the
Navigator submenu refer to the SPECTRUM Views
reference.
Device View
2-19
Accessing the Logical Device View
Ring Management Icon
Table 2-5.
Ring Management Menu Selections Accessible from Ring
Management Icon (Continued)
Menu Selection
Device View
2-20
Description
Alarms
Opens the Alarms view containing alarms (if any) for
the model.
Performance
Opens the Performance view for the TRBMIM device.
(Available only when Primary Application selection is
for an application that supports the Performance view.)
Notes...
Opens the SPECTRUM Notes facility for the TRBMIM
device.
Utilities
Opens the Utilities submenu, allowing you to access
any SPMA or other non-core utilities you have
purchased for SPECTRUM.
ConÞguration
Opens the Token Ring ConÞguration view for the
device. For further information on this view and its
related views, refer to Token Ring ConÞguration View,
starting on page 3-15.
Stations
Opens the Token Ring Station Table view for this
device.For further information on this view and its
related views, refer to Token Ring Station Table View,
starting on page 3-28.
Station Errors
Opens the Token Ring Station Isolating Errors view for
this device. For further information on this view and its
related views, refer to Token Ring Station Isolating
Errors Table View, starting on page 3-32.
Model Information
Opens the Model Information view for this device.For
further information on this view and its related views,
refer to Token Ring Device Model Information View,
starting on page 3-25.
TRBMIM
Management Module Guide
Chapter 3
ConÞguration & Station Table
Views
What is in this Chapter
This chapter provides general descriptions of the conÞguration views and
token ring station table views that are available for the TRBMIM. These
views let you access network conÞguration information and modify the
associated setups, as well as network trafÞc ßow and error rates. The
TRBMIM model type supports the following conÞguration and token ring
station table views:
¥
¥
¥
¥
¥
¥
¥
Device ConÞguration views (see page 3-2))
Source Route Bridge ConÞguration view (see page 3-8)
Source Route Port ConÞguration view (see page 3-11)
Spanning Tree Port ConÞguration view (see page 3-12)
Token Ring ConÞguration view (see page 3-15)
Token Ring Ring ConÞguration view (see page 3-18)
Token Ring Security ConÞguration view(see page 3-20)
- Modify Allowed Station List dialog box (see page 3-22)
¥ Token Ring Device Model Information view (see page 3-25)
¥ Station Table views (see page 3-28)
- Token Ring Station Table view (see page 3-28)
- Token Ring Station Isolating Errors view (see page 3-32)
- Token Ring Station Non-Isolating Errors view (see page 3-34)
- Token Ring Station Alarm Thresholds view (see page 3-35)
- Token Ring Station Alarm States view (see page 3-37)
- Token Ring Station Detail View (see page 3-38)
- Station Alarms Dialogue dialog box (see page 3-40)
9031251 E6
3-1
Device ConÞguration View
Opening the Device ConÞguration View
Device ConÞguration View
Opening the Device ConÞguration View
You can open the TRBMIMÕs Device ConÞguration view through any of the
following methods:
1. Double-click in the double-click zone at the top of the TRBMIM device
icon, as shown below. This action will open the Device ConÞguration view.
Double-click zone to open Device ConÞguration view
Model Name
Location View icon
Off-Page
Reference icon
Topology View icon
2. In your landscape view, click on the TRBMIM location view icon to
highlight that icon and then pull down the View menu and select the
Icon Subviews -> ConÞguration option.
View menu
Go Back
Ctrl+b
Go Up
Icon Subviews
View Path
New View
Bookmarks
View History
Current View Information...
Notes...
Jump by name...
Zoom
Map Hierarchy
Click on
ConÞguration
to open TRBMIMÕs
ConÞguration view
ConÞguration & Station Table Views
3-2
Icon Subviews menu
Close Ctrl+C
Navigate
Alarms
Performance
Notes...
Utilities
Zoom
Device
DevTop
Application
Acknowledge
Flash Green Enabled
Configuration
Model Information
Primary Application
TRBMIM
Management Module Guide
Device ConÞguration View
TRBMIM Device ConÞguration View Details
3. In the Logical Device view, double-click inside the device label on the
TRBMIMÕs logical device application icon to open the Device
ConÞguration view. Alternatively, you can right-click on that same icon to
display the device menu, slide the cursor down to the ConÞguration
option, and then release the mouse button.
Logical
Device
Application
icon
4
TRBMIM
Device Label
Double-click on label
to open TRBMIMÕs
ConÞguration view
Press right mouse
button to access
TRBMIMÕs device
menu
Click on
ConÞguration
to open TRBMIMÕs
ConÞguration view
Close
Navigate
Alarms
Performance
NotesÉ
Ctrl+c
Utilities
ConÞguration
Stations
Station Errors
Model Information
Device
Menu
(Same as
Icon
Subviews
Menu
when
Logical
Device
Application
icon is
highlighted)
TRBMIM Device ConÞguration View Details
The Device ConÞguration view (see Figure 3-1) provides information on the
conÞguration of the TRBMIM and lets you modify the values of some Þelds. In
addition to the general conÞguration information common to most generic
views, enclosed within the status border in the top part of the view, this view
provides the following information:
Firmware Revision Ð The Þrmware version of the TRBMIM.
Hardware Revision Ð The hardware revision for the device being modeled.
9031251 E6
ConÞguration & Station Table Views
3-3
Device ConÞguration View
TRBMIM Device ConÞguration View Details
Bridge Management Ð SpeciÞes whether the mode is Bridging-Only or
Bridging and Management. When the indication reads Mgmt_Enabled, the
TRBMIM is set for Bridging and Management and will manage the highernumbered boards in the hub (as displayed to its left in the Logical Device
view; see Figure 2-4 on page 2-9), up to the next intelligent MIM (which in
turn will manage the devices above itself). When the indication reads
Mgmt_Disabled, the TRBMIM is set for Bridging-Only mode and will not
manage any devices.
Figure 3-1.
TRBMIM Device ConÞguration View
Primary Landscape 0x00400000 - VNM Host - MMAC Plus of type BdgCSITRBMs
* File View
Help ?
Device Configuration View
Model Name 134.141.68.94
Network Address
134.141.68.94
Contact
Description
Cabletron TRBMIM Revision 2.01.10
Location
Primary Application
Firmware Revision 2.01.10
Update
MAC
Interface Address
1
00:00:B8:40:27:62
2
00:00:B8:40:27:E2
Gen Bridge App
Hardware Revision
4
System Up Time 57+17:22:51
Manufacturer
Cabletron Systems
Device Type
TRBM
Serial Number
Bridge Management
Mgmt_Enabled
Set Filter
Sort UP
Interface Configuration Table
Description
Type
Operational Status
iso88025-tokenRing
TokenRing0
On
iso88025-tokenRing
TokenRing1
On
–Interface Detail–
Component Table
Download Application
Trap Table
Interface ConÞguration Table Ð The lower half of the Device
ConÞguration View displays a multi-function Interface ConÞguration Table,
enclosed within a white border. This table lists each token-ring port and
displays the applicable Interface Address, Description, Type, and Operational
Status entries for each such port, as listed in Table 3-1. Selection buttons at
the top of each respective category column let you determine the category of
interest before you set Þlter conditions or sorting sequence for the listed ports,
ConÞguration & Station Table Views
3-4
TRBMIM
Management Module Guide
Device ConÞguration View
TRBMIM Device ConÞguration View Details
as described below. Once you select any one of these four mutually-exclusive
category selectors, it remains active until you select one of the other three
category buttons.
Update
The upper left corner of the Interface ConÞguration Table contains an
Update button. Click on this button to update the information being
presented in the Interface ConÞguration Table readouts.
MAC
The MAC button to the right of the Update button in the upper left corner of
the Interface ConÞguration Table is an address-format button lets you
alternate the format of the interface address between MAC (default) and
Canonical settings.
Sort Up
The upper right corner of the Interface ConÞguration Table contains a sortingspeciÞcation button, which lets you determine the sorting sequence for the
token-ring ports displayed in the table. This button is not active until after
one of the four column-selector category switches across the top of the table
listing has been selected (that is, any one of the Interface Address,
Description, Type, or Operational Status selection buttons, as described
in Table 3-1). When the Sort Up button is active, clicking this button lets you
select between Sort Up (default), Sort Down, and Un-Sort sequences for
those listed entries, based on whichever column category concurrently is
selected. Once any of these sorting options is chosen, it remains in effect until
a later change is made.
Set Filter
Located just to the left of the sorting-speciÞcation button in the upper right
center of the Interface ConÞguration Table, the Þlter-setup button lets you
alternate between two states: Set Filter (default) and Clear Filter. As with
the sort-function button, this button is not active until after one of the four
category switches across the top of the table listing has been selected. If you
select the Set Filter option, indicating that you want to establish a mask to
reject entries containing whatever elements you specify, the program then
activates a dialog box asking you to enter the applicable information
pertaining to whichever column category concurrently is selected. Once either
setting is chosen, it remains in effect until a later change is made.
9031251 E6
ConÞguration & Station Table Views
3-5
Device ConÞguration View
TRBMIM Device ConÞguration View Details
Table 3-1.
Interface ConÞguration Table Field DeÞnitions
Statistic
DeÞnition
Interface
Address
The interface identiÞcation address for this component.
Pressing the column selector containing this designation
means that any subsequent Þlter setting or item-sorting
operation will pertain to this category until one of the other
category buttons is selected.
Description
The descriptive nomenclature for this component. Pressing the
column selector containing this designation means that any
subsequent Þlter setting or item-sorting operation will pertain
to this category until one of the other category buttons is
selected.
Type
The type designation for this Þrmware component. Pressing
the column selector containing this designation means that
any subsequent Þlter setting or item-sorting operation will
pertain to this category until one of the other category buttons
is selected.
Operational
Status
The community password. The default value for this entry is
Òpublic.Ó Pressing the column selector containing this
designation means that any subsequent Þlter setting or itemsorting operation will pertain to this category until one of the
other category buttons is selected.
Interface Detail
The lower left corner of the Interface ConÞguration Table contains an
Interface Detail button. Click on this button to access the Interface Detail
view, which lets you change the interface number and administrative status
(On or Off) of whichever token-ring port concurrently is selected (highlighted,
with white background) on the Interface ConÞguration Table. If you make any
changes via this view, you will be asked to conÞrm that you wish to commit
those changes. Double-clicking on a Interface ConÞguration Table entry also
opens this same Interface Detail view for the port associated with that entry.
Directly below the Interface ConÞguration Table, arranged across the bottom
of the Device ConÞguration view, are three push-buttons that let you select
additional functions, as described below.
Component Table
Click on this button to open the Component Table view. This view contains the
Þelds and controls listed in table x and provides information on the TRBMIM
components. For further information on the use of this SPMA view, refer to
Chapter 3, Using the Community Names Tool, in the SPECTRUM Portable
Management Application Tools Guide.
ConÞguration & Station Table Views
3-6
TRBMIM
Management Module Guide
Device ConÞguration View
TRBMIM Device ConÞguration View Details
Table 3-2.
Component Table ViewÕs Field DeÞnitions
Field or
Control
DeÞnition
Access
Community
Name
The community password. The initial default value is
ÒpublicÓ Ñ but users are expected to change this to some userdeÞned value as a security measure.
ID
The identiÞcation number for given component.
Compnent Name
The name of the given component.
Read-Only
The community password for Read-Only privileges for the
TRBMIM model. The default entry is a ÒpublicÓ value.
Read-Write
The community password for Read-Write privileges for the
TRBMIM model. The default entry is a ÒpublicÓ value.
Super-User
The community password for Super-User privileges for the
TRBMIM model. The initial default value is ÒpublicÓ Ñ but
users are expected to change this to some user-deÞned value as
a security measure.
Component
Status
Mutually-exclusive selection between Enable or Disable
options.
Select All
Selects all Component Table entries simultaneously.
Refresh
Reads in Component Table entries to determine if changes have
been made since last read.
Quit
Closes the Compnent Table view.
Download Application
Click on this button to access the TFTP Download function, an SPMA
application that lets you upgrade the TRBMIM Þrmware from a TFTP Boot or
from a Bootp Server. For more information on this function, refer to Chapter 5,
ÒUsing the SPMA TFTP Download ToolÓ in the SPECTRUM Portable
Management Application Tools Guide.
Trap Table
Click on this button to access the Trap Table function, an SPMA application
that lets you enable and disable traps and specify the IP address of the
management workstation that receives and processes the trap messages. For
more information on this function, refer to Chapter 6, ÒThe Trap Table ToolÓ in
the SPECTRUM Portable Management Application Tools Guide.
9031251 E6
ConÞguration & Station Table Views
3-7
Other ConÞguration Views
Source Route Bridge ConÞguration View
Other ConÞguration Views
Source Route Bridge ConÞguration View
Opening the Source Route Bridge ConÞguration View
If you highlight the TRBMIMÕs Bridging icon in the Logical Device view, you
can access the Source Route Bridge ConÞguration view either by (1) rightclicking in that label to open the device menu and then selecting the Source
Route ConÞguration option or else by (2) pulling down the File menu from the
manu bar and selecting the File > Icon Subviews > Source Route
ConÞguration option.
Press right mouse
button to access
TRBMIMÕs device
menu
Logical Device
Bridging
Icon
Bridging
Click on Source Route
ConÞguration to open
Source Route ConÞguration
view
Close
Navigate
Alarms
Performance
NotesÉ
Ctrl+c
Device
Menu
Utilities
Source Route ConÞguration
Source Route Statistics
(Same as
Icon
Subviews
Menu
when
Bridging
icon is
highlighted)
Spanning Tree
Alternatively, if you are in the Application view, you can click on the
Source_Rt_App icon with the left mouse button to highlight that icon, then
pull down the File menu and select its Icon Submenus option, and then
select the ConÞguration option from the resulting submenu. Conversely, you
can click on that same Source_Rt_App icon with the middle mouse button to
activate a replica of the Icon Submenus menu and then select the
ConÞguration option on that menu.
ConÞguration & Station Table Views
3-8
TRBMIM
Management Module Guide
Other ConÞguration Views
Source Route Bridge ConÞguration View
Source Route Bridge ConÞguration View Details
In addition to the general conÞguration information common to most generic
views, enclosed within the status border in the top part of the view, the Source
Route Bridge ConÞguration view (see Figure 3-2) provides information on the
conÞguration of the associated port and lets you modify the values of some
Þelds. This view provides the following information:
Figure 3-2.
Source Route Bridge ConÞguration Table View
Primary Landscape 0x00400000 - VNM Host - MMAC Plus of type BdgCSITRBMs
* File View
Name
Network 1
Help ?
Network Address
134.141.68.94
Contact
Description
Cabletron TRBMIM Revision 2.01.10
Location
Primary Application
Gen Bridge App
System Up Time 10+07:12:18
Manufacturer
Cabletron Systems
Device Type
TRBM
Serial Number
Source Route Bridge Configuration Table
Sort
Port
1
2
Find
Update
Bridge Number Ring In Number
4
1
4
2
Ring Out Number
2
1
Map Count
7
7
Largest Frame
4472
4472
STE Span Mode
Auto-Span
Auto-Span
The Source Route Bridge ConÞguration view provides the following
information:
Port Ð This Þeld displays the number of the port containing Source Route
management information.
9031251 E6
ConÞguration & Station Table Views
3-9
Other ConÞguration Views
Source Route Bridge ConÞguration View
Bridge Number Ð This Þeld displays the number uniquely identifying the
bridge when more than one bridge is used to span the same two segments.
Ring In Number Ð This Þeld displays the number that uniquely identiÞes
the segment to which this port is connected.
Ring Out Number Ð This Þeld displays the segment number that
corresponds to the target segment this port is considered to be connected to by
the bridge.
Hop Count Ð This Þeld displays the number of routing descriptors allowed
in an All Paths or Spanning Tree Explorer frame.
Largest Frame Ð This Þeld displays the maximum size of the INFO Þeld
that this port can send or receive.
STE Span Mode Ð This Þeld lets you determine how the port behaves when
presented with a Spanning Tree Explorer frame. When disabled, the port will
not send or receive any Spanning Tree Explorer packets.
In addition, the Source Route ConÞguration view also provides three
convenient controls:
Sort
The Sort button, which is normally inactive (grayed out), becomes active
when you click any one of the column-heading labels in the Source Route
Bridge ConÞguration Table (that is, Port, Bridge Number, etc.); if you then
click on this Sort button while it is active, the system sorts the row entries in
accordance with the entries in whichever column you clicked to activate the
button.
Find
When this ÒgenericÓ view is used with certain other SPECTRUM modules, the
Find button can provide enhanced seaching funcitonality for a speciÞc
address, etc.,but this functionality is not implemented for the TRBMIM and
this button is grayed out (inactive).
Update
Clicking on the Update button updates the data contents of the Source Route
Bridge ConÞguration Table.
Double-clicking on any entry in the Source Route Bridge ConÞguration Table
view opens the Source Route Port ConÞguration view for whichever port is
associated with that entry. For further information concerning that view, refer
to the following section.
ConÞguration & Station Table Views
3-10
TRBMIM
Management Module Guide
Other ConÞguration Views
Source Route Port ConÞguration View
Source Route Port ConÞguration View
Opening the Source Route Port ConÞguration View
Double-clicking on any entry in the Source Route Bridge ConÞguration Table
view opens the Source Route Port ConÞguration view for whichever port is
associated with that entry.
Source Route Port ConÞguration View Details
The Source Route Port ConÞguration view (see Figure 3-3) provides
information on the conÞguration of the associated port and lets you modify the
values of some Þelds. This view provides the following information:
Figure 3-3.
TRBMIM Source Route Port ConÞguration View
Primary Landscape 0x00400000 – VNM Host – S
* File View
Help ?
Source Route Port Configuration
Port Number
2
Bridge Number
4
Ring In Number
2
Ring Out N umber
1
Maximum Hop Count
7
Largest Frame Size
STE Span Mode
4865
Auto-Span
Port Number Ð This Þeld displays the number of the port containing Source
Route management information.
Bridge Number Ð This Þeld displays the number uniquely identifying the
bridge when more than one bridge is used to span the same two segments.
Ring In Number Ð This Þeld displays the number that uniquely identiÞes
the segment to which this port is connected.
9031251 E6
ConÞguration & Station Table Views
3-11
Other ConÞguration Views
Spanning Tree Port ConÞguration View
Ring Out Number Ð This Þeld displays the segment number that
corresponds to the target segment this port is considered to be connected to by
the bridge.
Maximum Hop Count Ð This Þeld displays the number of routing
descriptors allowed in an All Paths or Spanning Tree Explorer frame.
Largest Frame Size Ð This Þeld identiÞes the maximum size of the INFO
Þeld that this port currently can send or receive. You can highlight this entry
and substitute any desired higher or lower value; the program will round your
entry up or down (depending on the associated device) to the nearest
applicable value deÞned by the IEEE 802.5M SRT Addendum. The bridge
uses this value to determine if modiÞcation of the LargestFrame Þeld of the
Routing Control Þeld of the Routing Information Field is necessary.
STE Span Mode
The STE Span Mode button determines how the current port will behave
when presented with a Spanning Tree Explorer frame. Clicking on this button
causes the system to display a pop-up list of three allowed values, as follows:
Auto-Span Ð This selection can be returned only by a bridge that both
implements the Spanning Tree protocol and also has use of the protocol
enabled on this port. Given these conditions, the frame will accept or
propagate a frame if the port is in the forwarding state; otherwise, the port
will silently discard the frame.
Disabled Ð This selection means that the port will not send or receive any
Spanning Tree Explorer packets, which instead will be silently discarded.
Forced Ð This selection means that the port will always accept and
propagate Spanning Tree Explorer frames. (This allows a manually
conÞgured Spanning Tree for this class of packet to be conÞgured. Unlike
transparent bridging, this is not catastrophic to the network if there are
loops.)
When you select the desired spanning mode, the mode name displayed as the
new button readout, remaining in effect until a different mode is selected.
Spanning Tree Port ConÞguration View
Opening the Spanning Tree Port ConÞguration View
If you highlight either Logical Port icon area in the Logical Device icon for the
TRBMIM in the Logical Device view, you can access the Spanning Tree Port
ConÞguration view (see Figure 3-4) by any of three methods: (1) double-click
inside the status label on the Logical Port icon, (2) press the right mouse
button and then select the Port ConÞguration option on the displayed device
ConÞguration & Station Table Views
3-12
TRBMIM
Management Module Guide
Other ConÞguration Views
Spanning Tree Port ConÞguration View
menu, or (3) pull down the View menu from the window menu bar and select
the View > Icon Subviews > Port ConÞguration option.
Logical
Port
icons
Double-click
on status label
to open the
Spanning Tree
Port ConÞguration
view for that
port
STATION
FWD
TR
Press right mouse
button in desired
Logical Port icon
to get Device menu
for respective port
FNB
FWD
TR
Close
Navigate
Alarms
Performance
Performance
NotesÉ
Ctrl+c
Utilities
Port ConÞguration
Port Performance
Click on
Port Model Information
Port ConÞguration
to open Spanning Tree
Port ConÞguration view
for port associated with
highlighted Logical Port icon
Device
Menu
(Same as
Icon
Subviews
Menu
when
Logical
Port
icon is
highlighted)
Spanning Tree Port ConÞguration View Details
The Spanning Tree Port ConÞguration view provides information on the
conÞguration of the associated port and lets you modify the values of some
Þelds. This view provides the following information:
Port Number Ð The number of this spanning tree port.
Port Status
The Port Status button identiÞes whether the associated spanning tree port
currently is Enabled or Disabled. Clicking on the button produces a twoselection menu that lets you select the alternate state or leave the current
state in place.
Port Priority Ð The network port priority, which is one of the values used by
the Spanning Tree algorithm to choose a root for the TRBMIM. A lower
9031251 E6
ConÞguration & Station Table Views
3-13
Other ConÞguration Views
Spanning Tree Port ConÞguration View
number indicates a higher priority. The default is 80; the allowable range is 0
to 255.
Figure 3-4.
TRBMIM Spanning Tree Port ConÞguration View
Primary Landscape 0x00400000 – VNM Host – Spanning Tree
* File View
Help ?
Spanning Tree Port Configuration
Port Number
Port Status
Port Priority
Port Path Cost
Port State
1
Disabled
0x80
20
Forwarding
Designated Root
80.0.0.0.1D.2.E4.46
Designated Cost
0
Designated Bridge
Designated Port
Forward Transition
80.0.0.0.1D.2.E4.46
14.0
1
Port Path Cost Ð The portion of the total path cost that is associated with
this port. In a parallel bridge network, the Spanning Tree algorithm selects
the bridge with the lowest path cost as the root bridge. The allowable range
for the path cost is 1 to 65535. The default value is 20.
Port State Ð The state of this station port. Table 3-3 provides possible port
states and deÞnitions.
Designated Root Ð The bridge identiÞer, recorded as the root in the
ConÞguration BPDUs transmitted by the Designated Bridge (for the segment
to which this port is attached.) This value is used as the Root IdentiÞer
parameter in all Bridge ConÞguration PDUs originated by this node.
Designated Cost Ð The path cost of the Designated Port of the segment
connected to this port.
Designated Bridge Ð The ID of the bridge that is assumed to be the root
bridge on the network.
Designated Port Ð The number of the port that offers the lowest path from
the TRBMIM to the root bridge.
ConÞguration & Station Table Views
3-14
TRBMIM
Management Module Guide
Other ConÞguration Views
Token Ring ConÞguration View
Forward Transitions Ð The number of times the port has changed from the
learning state to the forwarding state.
Table 3-3.
Spanning Tree Port States and DeÞnitions
State
DeÞnition
Disabled
Management has disabled the port. No trafÞc can be received or
forwarded while the port is disabled.
Learning
The device is learning network addresses. This occurs when the
deviceÕs Acquired Database is being created during start-up or
reconÞguration.
Listening
The device is not adding information to the Filtering Database but is
monitoring BPDU trafÞc while preparing to move from the Learning
state to the Forwarding state.
Forwarding
The device is on-line and this port is forwarding trafÞc.
Blocking
The port will not forward any trafÞc.
Broken
The port is malfunctioning.
Token Ring ConÞguration View
Opening the Token Ring ConÞguration View
If you highlight either Logical Port icon area (FNB or Station) in the Logical
Device icon for the TRBMIM in the Logical Device view, you can access the
Spanning Tree Port ConÞguration view (see Figure 3-4) by any of three
methods: (1) double-click inside the status label on the Logical Port icon, (2)
press the right mouse button and then select the Port ConÞguration option on
the displayed device menu, or (3) pull down the View menu from the window
menu bar and select the View > Icon Subviews > Port ConÞguration
option.
9031251 E6
ConÞguration & Station Table Views
3-15
Other ConÞguration Views
Token Ring ConÞguration View
Ring
Management
icons
Double-click
on Token Ring
Port Type icon
to open Token
Ring ConÞguration
view for that
port
Network 1
16M
R1
Press right mouse
button in desired
Ring Management
icon to get Device menu
for respective port
Network 2
16M
R2
Close
Navigate
Alarms
Performance
NotesÉ
Utilities
ConÞguration
Stations
Ctrl+c
Device
Menu
Click on
Station Errors
ConÞguration
to open Token Ring
Model Information
ConÞguration view
for port associated with
highlighted Port Type icon
(Same as
Icon
Subviews
Menu
when
Ring
Management
Port
icon is
highlighted)
Alternatively, if you are in the Application view, you can highlight either the
CtTokenRingApp icon or the HubCSITR icon with the right mouse button to
open the device menu and then select its ConÞguration option, or you can
highlight either of those same icons with the left mouse button and then pull
down the File menu from the menu bar and select the File > Icon Subviews
> ConÞguration option on that menu.
Token Ring ConÞguration View Details
In addition to the general conÞguration information common to most generic
views, enclosed within the status border in the top part of the view, the Token
Ring ConÞguration view (see Figure 3-5) provides information on the
conÞguration of the associated token ring network and lets you modify the
values of some Þelds. This view provides the following information:
ConÞguration & Station Table Views
3-16
TRBMIM
Management Module Guide
Other ConÞguration Views
Token Ring ConÞguration View
Figure 3-5.
Cabletron Token Ring ConÞguration View
Primary Landscape 0x00400000 - VNM Host - MMAC Plus of type BdgCSITRBMs
* File View
Name
Help ?
Network 1
Network Address
134.141.68.94
Contact
Description
Cabletron TRBMIM Revision 2.01.10
Location
Primary Application
Gen Bridge App
System Up Time 12+04:22:41
Manufacturer
Cabletron Systems
Device Type
TRBM
Serial Number
Cabletron Token Ring Configuration View
Ring Name
Network 1
Ring Number
1
Ring Speed
16MBits
Ring Status
Normal
Port Configuration
0
Station Ports ON Out of
0
Enable All Station Ports NoEnable
0
Ring Ports ON Out of
0
Enable All Ring Ports
NoEnable
– Ring Configuration –
– Ring Security
–
–
–
Alarm Table
Ring Name Ð The ASCII name assigned to this ring. This name defaults to
Network n, where n is a unique integer value.
Ring Number Ð The number of the attached ring. If SPECTRUM cannot
determine the number of the ring, a zero is returned.
Ring Speed Ð The speed of the ring, which can have a value of 4 or 16
megabits.
Ring Status Ð The operational state of the ring. Depending on the current
general operational state of the ring, this value will be any one of Normal,
Closed, Purge, Contention, Beaconing, Lobe Fail, or Unknown.
Directly below the just-described row of readouts, a Port ConÞguration
block presents the following information and controls pertaining to the
conÞguration of the device ports:
Station Ports ON Out Of Ð DeÞnes the total number of enabled station
ports on the addressed module.
Ring Ports ON Out Of Ð The total number of enabled ring-in/ring-out ports
in this port group.
Enable All Station Ports
This button lets you enable all station ports in this port group by setting the
value to Enable. The default value is NoEnable.
9031251 E6
ConÞguration & Station Table Views
3-17
Other ConÞguration Views
Token Ring Ring ConÞguration View
Enable All Ring Ports
This button lets you enable all ring ports in this port group by setting the
value to Enable. The default value is NoEnable.
In addition, three push-buttons on the right-hand side of the Port
ConÞguration area provide access to three other important views:
– Ring Configuration –
Clicking on this button opens the Token Ring Ring ConÞguration view./ For
further information on that view, refer to Token Ring Ring ConÞguration View,
starting on page 3-18.
–
Ring Security
–
Clicking on this button opens the Token Ring Security ConÞguration view. For
further information on that view, refer to Token Ring Security ConÞguration
View, starting on page 3-20.
–
Alarms Table
–
Clicking on this button opens the Token Ring Station Alarm Thresholds Table
view. For further information on that view, refer to Token Ring Station Alarm
Thresholds View, starting on page 3-35.
Token Ring Ring ConÞguration View
Opening the Token Ring Ring ConÞguration View
Clicking on the Ring ConÞguration button in the Token Ring ConÞguration
view (see Figure 3-5 on page 3-17) opens the Token Ring Ring ConÞguration
view. In addition to the general conÞguration information common to most
generic views, enclosed within the status border in the top part of the view,
this view provides information about the conÞguration of the associated token
ring network(s), including several elements of possible alarms concerned with
the ring, together with push-buttons associated with some of these elements.
You can modify the values of the Þelds that are displayed in this view in bold
print.
Token Ring Ring ConÞguration View Details
The Ring ConÞguration section, located on the left side of the Token Ring
Ring ConÞguration view, displays the following information:
ConÞguration & Station Table Views
3-18
TRBMIM
Management Module Guide
Other ConÞguration Views
Token Ring Ring ConÞguration View
Ring Name Ð The ASCII name assigned to this ring. This name defaults to
Network n, where n is a unique integer value.
Ring Number Ð The number of the attached ring. If SPECTRUM cannot
determine the number of the ring, a zero is returned.
Ring Speed Ð The speed of the ring, which can have a value of 4 or 16
megabits.
Ring Status Ð The operational state of the ring.
Active Monitor Ð The MAC address of the active monitor for the ring. This
address will appear in any tables with an asterisk (*) to identify it.
Active Stations Ð The number of active stations currently inserted on the
ring.
Beacon Recovery
The Beacon Recovery button lets you enable or disable automatic beacon
recovery for the TRBMIM. If you click on this button, the system displays a
three-option pop-up menu, letting you select between Enabled, Disabled,
and Invalid; the button readout identiÞes whichever selection is currently in
effect. When this button is in its Disabled state, the TRBMIM will not
attempt to reinsert itself into the ring after entering a beaconing state. If the
device does not support automatic beacon recovery, SPECTRUM will display a
status of Invalid.
The Ring Alarm/Threshold/State section, located on the left side of the
Token Ring Ring ConÞguration view, has three columns, displaying
information on the ring alarms, their current thresholds, and their states
(Enabled or Disabled). You can change the threshold settings by typing new
values into the Threshold Þelds. In addition, the state designations are
really readouts on two-position push-buttons, and you can change each alarm
to its alternate state by clicking on the button. The applicable ring alarms are
as follows:
Ring Purges Ð The threshold Þeld lets you set a value for the Ring Purges
alarm threshold. The associated state button lets you Enable or Disable
detection of this alarm.
AMP Errors Ð The threshold Þeld lets you set a value for the Active Monitor
Error alarm threshold. The associated state button lets you Enable or
Disable detection of this alarm.
Claim Token Errors Ð The threshold Þeld lets you set a value for the Claim
Token Errors alarm threshold. The associated state button lets you Enable or
Disable detection of this alarm.
Lost Frames Ð The threshold Þeld lets you set a value for the Lost Frames
alarm threshold. The associated state button lets you Enable or Disable
detection of this alarm.
9031251 E6
ConÞguration & Station Table Views
3-19
Other ConÞguration Views
Token Ring Security ConÞguration View
Token Errors Ð The threshold Þeld lets you set a value for the Token Errors
alarm threshold. The associated state button lets you Enable or Disable
detection of this alarm.
Beacon State Ð The threshold Þeld lets you set a value for the Beacon State
alarm threshold. The associated state button lets you Enable or Disable
detection of this alarm.
Frame Count Ð The threshold Þeld lets you set a value for the Frame Count
alarm threshold. The associated state button lets you Enable or Disable
detection of this alarm.
One Þnal Þeld at the bottom of this view, Ring Timebase, lets you set the
timebase for getting and setting all alarms for this ring. This value is
measured in seconds.
Token Ring Security ConÞguration View
Opening the Token Ring Security ConÞguration View
Clicking on the Ring Security button in the Token Ring ConÞguration view
(see Figure 3-5 on page 3-17) opens the Token Ring Security ConÞguration
view.
Token Ring Security ConÞguration View Details
The Token Ring Security ConÞguration view provides information about the
security conÞguration for the ring and lets you modify the values of some
Þelds. You can modify the values of the Þelds having labels that are displayed
in this view in bold print.
A highlighted bar across the top of the views provides the following four
readout Þelds:
Ring Name Ð The ASCII name assigned to this ring. This name defaults to
Network n, where n is a unique integer value.
Ring Number Ð The number of the attached ring. If SPECTRUM cannot
determine the number of the ring, a zero is returned.
Ring Status Ð The operational state of the ring.
Ring Speed Ð The speed of the ring, which can have a value of 4 or 16
megabits.
ConÞguration & Station Table Views
3-20
TRBMIM
Management Module Guide
Other ConÞguration Views
Token Ring Security ConÞguration View
Administration State
The Administration State button lets you select the security administration
state for the TRBMIM. When the readout on this button designates the ring
as being in the EnabledWithAlarms state, SPECTRUM will generate an
alarm upon insertion of an illegal station into the ring. When the indication is
EnabledWithRemoveAndAlarm, SPECTRUM generates an alarm and also
removes the illegal station from the ring. Finally, selecting the Disabled state
turns off security for the TRBMIM.
A blocked off area below the Administration State control button contains a
table that identiÞes the Interface designation and the Allowed Station
Address value for all stations allowed on the ring. The station that is the
active monitor for the ring is indicated by an asterisk (*) beside the address.
Double-clicking on any table line entry in the table opens the Modify Allowed
Station List dialog box, described in Modify Allowed Station List Dialog Box,
starting on page 3-22.
The blocked-off table area contains the following seven push-buttons:
Update
The Update button updates the contents of the Station Address Table.
MAC/Canonical
The MAC/Canonical button toggles the station address display format
between MAC (Physical) and Canonical (Ethernet) forms. The readout on
this button always designates the alternate state (that is, the one that is not
currently selected, but which will become selected if you click on the button).
Set/Clear Filter
The Set/Clear Filter button lets you set a Þlter affecting the interfaces/
stations displayed in the table. The readout on this button always designates
the alternate state (that is, the one that is not currently selected, but which
will become selected if you click on the button). You select an attribute to Þlter
against by clicking one of the column-heading buttons (that is, Interface or
Allowed Station Address).
Sort Up/Sort Down/Un-Sort
The Sort Up/Sort Down/On-Sort button lets you sort the interfaces or
station addresses displayed in the table. You select an attribute to sort on by
clicking one of the column-heading buttons (that is, Interface or Allowed
Station Address). When you click on this button, a pop-up menu appears,
letting you select the desired setting.
Interface
The Interface button, located directly above the Interface column in the
displayed table and constituting its label, provides a list of the available
9031251 E6
ConÞguration & Station Table Views
3-21
Other ConÞguration Views
Modify Allowed Station List Dialog Box
interface numbers. Selecting this button lets you designate one of the
interface values presented as the target for operations initiated by the Set
Filter and Sort buttons.
Allowed Station Address
The Allowed Station Address button. located directly above the Allowed
Station Address column in the displayed table and constituting its label,
provides a list of the station addresses. Selecting this button lets you use the
Set Filter and Sort buttons on the station addresses presented.
Modify Allowed Station List
The Modify Allowed Station List button, located below the table, opens the
Modify Allowed Station List view, which is described the following section.
Total Allowed Stations Ð This Þeld identiÞes the total number of stations
currently included in the Allowed Stations list.
Modify Allowed Station List Dialog Box
Opening the Modify Allowed Station List Dialog Box
You can access the Modify Allowed Station List dialog box by clicking on the
Modify Allowed Station List button in the Token Ring Security ConÞguration
View (refer to Token Ring Security ConÞguration View, starting on page 3-20).
Alternatively, you can also open this same dialog box by double-clicking on any
table entry in that Security ConÞguration view.
Modify Allowed Station List Dialog Box Details
!
CAUTION
Do not attempt to modify ring security without Þrst having a complete
understanding of Token Ring concepts and the TRBMIM device. Removal of
the station acting as the connecting bridge from the Ring Security Allowed
Station List can cause isolation from the ring.
The Modify Allowed Station List dialog box lets you modify the security for the
ring by adding or removing stations from the ringÕs list of allowed stations.
This dialog box provides the following functions:
The top section of the dialog box, labeled Security Administration State,
lets you choose the level of security for the ring. You may only select one
ConÞguration & Station Table Views
3-22
TRBMIM
Management Module Guide
Other ConÞguration Views
Modify Allowed Station List Dialog Box
mutually exclusive option at a time by clicking on the applicable button, as
follows:
Disable
This security option disables ring security, allowing all stations on the ring.
Enable with Alarm
This security option enables ring security with the condition that any station
entering the ring will generate an alarm unless it is on the secure list. The
device will place the station address on the Allowed Stations list.
Enable with Remove and Alarm
This security option enables ring security with the condition that any station
not on the secure list and that enters or currently resides on the ring will
generate an alarm and be removed from the ring.
The middle portion of the dialog box contains two scroll lists (Allowed
Stations and Disallowed Stations), together with associated buttons that
let you move station addresses back and forth between these two scroll lists,
as well as to add or delete stations from the ring. The left-hand Allowed
Stations list displays the list of stations currently allowed on the ring.
Double-clicking on any item in that list will move it to the right-hand
Disallowed Stations scroll list, except that you cannot move a station from
the Allowed Stations list if the security for that station address is set to
Enable with Alarm. Alternatively, you can highlight any station address in the
Allowed Stations list and then click on the > button to move it to the
Disallowed Stations list (again, you cannot move the station address if its
address is set for the Enable with Alarm state, and the > button remains
grayed out (inactive). If you move an address to the Disallowed Stations
list, the > label becomes active, with that condition remaining in effect until
you click on the Apply button to implement the change(s).
The right-hand Disallowed Stations scroll list acts as a scratch pad or buffer
to store addresses currently disallowed on the ring, but which you may want
to move to the Allowed Stations list in the future. The ring does not read
this buffer to deny ring access to certain stations; instead, the ring denies
access to all stations not explicitly included in the Allowed Stations scroll
list. Double-clicking on an item in the Disallowed Stations list will move it
to the Allowed Stations list. The normally inactive (grayed out) < button
becomes active when you make any such change, with this condition
remaining in effect until you click on the Apply button to implement the
change(s).
>
Unless the security for a given station in the Allowed Stations list has been
set for Enable with Alarm state, highlighting that station address and then
clicking on the > button will move the selected station from the Allowed
Stations list to the Disallowed Stations list. The > symbol then remains
9031251 E6
ConÞguration & Station Table Views
3-23
Other ConÞguration Views
Modify Allowed Station List Dialog Box
active to indicate that the station has recently been moved to the Disallowed
Stations list, with the condition remaining in effect until you click on the
Apply button to implement the change(s). You cannot move a station from the
Allowed Stations window if its security is set to Enable with Alarm.
<
Highlighting any station address entry in the Disallowed Stations list and
then clicking on the < button will move the selected station from the
Disallowed Stations list to the Allowed Stations list. The < symbol on the
button will remain active until the change is applied when you subsequently
click on the Apply button.
ADD
The ADD button lets you add a new station. The station address must be
added in valid hex MAC address format, using valid separators Ñ the colon (:),
period (.), and dash (-). You can add the new station either to the Allowed
Stations scroll list or to the Disallowed Station scroll list by selecting the
appropriate option in the Add Station to List dialog box that appears when
you click on the ADD button. That secondary dialog box provides an entry
Þeld for identiÞcation of the address for the new station, provides a mutually
exclusive selection between Allowed List and Disallowed List options, and
then lets you make a Þnal choice between Apply (which adds the entered
station address to the designated list) or Cancel (which exits from the
secondary dialog box without effecting any changes). Any recently added
station address will be accompanied by a ÒplusÓ symbol (+), which will remain
in effect until the addition is Þnalized by clicking on the Apply button in the
Modify Allowed Station List dialog box. Selecting a recently added that is
marked with a + symbol and then clicking on the DELETE button will
remove it from the scroll list.
DELETE
The DELETE button lets you remove the selected station (Refer to the
CAUTION note at the beginning of this section). You may remove any station
address except that address belonging to the bridging device itself, and except
for any station in the Allowed Stations scroll list that currently is set for an
Enable with Alarm security state. A minus symbol (-) accompanying an
address entry in either scroll list indicates that the station has been marked
for removal, and this symbol will remain in effect until the changes are
Þnalized by subsequent clicking on the Apply button, at which time the
station is actually removed from the scroll list. Selecting the station and
clicking on the ADD button will remove the minus symbol and unmark the
station for removal. This button will also remove a recently added station
marked with the + symbol.
Delete All Allowed Stations
The Delete All Allowed Stations button lets you remove all of the stations
in the Allowed Stations scroll list (Refer to the CAUTION at the beginning of
ConÞguration & Station Table Views
3-24
TRBMIM
Management Module Guide
Token Ring Device Model Information View
this section). A minus symbol (-) becomes added to all of the items in the scroll
list, indicating that the stations have been designated for removal, and this
condition will remain in effect until the changes become implemented by
subsequent activation of the Apply button, at which time the stations are
actually removed from the scroll list. This option will remove all station
addresses except that address belonging to the device itself. Selecting a
station and clicking on the ADD button will remove the minus symbol,
unmarking that station for removal.
Apply
The Apply button applies all changes made to the Allowed Stations and
Disallowed Stations scroll lists, writing the list from the Allowed Stations
scroll list to the device and writing the list from the Disallowed Stations
scroll list to SPECTRUM, and removing all interim indicator markings from
any modiÞed stations.
Read
The Read button updates the Allowed Stations and Disallowed Stations
scroll lists by reading the saved values from both the device and SPECTRUM.
This action resets any changes you made to either scroll list but did not apply.
Cancel
The Cancel button lets you exit you from the Modify Allowed Station List
dialog box. Only changes that have been applied by previous activation of the
Apply button will be saved.
Token Ring Device Model Information View
The Token Ring Device Model Information view provides attribute and
conÞguration information for the Token Ring Device Model, and lets you
modify the values of some Þelds.
Opening the Token Ring Device Model Information View
To open the Token Ring Device Model Information view from the Icon
Subviews in the Device view by Þrst selecting the Ring icon on the TRBMIM
and then selecting Model Information. You can also access this view by
clicking on the CtTokenRingApp, HubCSITR, or CtTokenRingMgt icon in the
Applications view and selecting Model Information from the Icon Subviews
menu.
9031251 E6
ConÞguration & Station Table Views
3-25
Token Ring Device Model Information View
Token Ring Device Model Information View Details
Token Ring Device Model Information View Details
The General Information area of the Token Ring Device Model Information
view provides general information pertaining to the Token Ring device model
including contact status values, model condition values, connector count
values, and rollup threshold values.
MM Name Ð The management moduleÕs name.
MM Version Number Ð The version number of the TRBMIM management
module.
Model Type Ð The type of SPECTRUM model (e.g., BdgCSITRBM).
Model Creation Time Ð The time and date that the Token Ring device
model was created.
Model Created By Ð The user identiÞcation of the user that created the
Token Ring device model.
Model State Ð The current state of the model. There are six possible values:
Initial, Active, Creating, Error, Destroyed, or Unknown.
Security String Ð The assigned SPECTRUM security level for this Token
Ring model.
Condition Ð The current contact condition of the TRBMIM model. There are
six possible values: Blue, Green, Yellow, Orange, Red, or Gray, having the
respective meanings deÞned in Table 3-4.
Condition Value Ð A value corresponding to the possible conditions. There
are seven possible values:
0 = Green, 1 = Yellow, 2 = Orange, 3 = Red, 4 = Blue, 5 = Gray, or 6 = Initial.
Contact Status Ð The status of the TRBMIM. There are three possible
values: Established, Lost, or Initial.
Lost Child Count Ð The number of subordinate models below another
model that have lost contact with their devices.
Value When Yellow Ð The value that will be assigned to the condition value
when the Token Ring device model has a yellow condition. You can change this
value.
Value When Orange Ð The value that will be assigned to the condition
value when the Token Ring device model has an orange condition. You can
change this value.
Value When Red Ð The value that will be assigned to the condition value
when the Token Ring device model has a red condition. You can change this
value.
ConÞguration & Station Table Views
3-26
TRBMIM
Management Module Guide
Token Ring Device Model Information View
Token Ring Device Model Information View Details
Table 3-4.
Contact Status Color DeÞnitions
Color
Contact Status
SigniÞcance of Color Designation
Blue
Initial
No contact with the TRBMIM has occurred.
Green
Device Contacted
Contact has been made with the TRBMIM, and the
device is operational. If Flashing Green has been
enabled for the device, the color ßashes, indicating
an alarm has occurred on the device and has been
cleared.
Yellow
Minor Alarm
A duplicate IP address and/or physical (Ethernet0)
address has been detected. Some traps may also
generate this alarm. For information on the cause
of any speciÞc alarm, go to the Alarms View for the
device.
Orange
Major Alarm
Information cannot be retrieved via the deviceÕs
local management software. Some traps may also
generate this alarm. For information on the cause
of any speciÞc alarm, go to the Alarms View for the
device.
Red
Lost Contact
SPECTRUM can no longer contact the TRBMIM.
Gray
Suppressed
SPECTRUM cannot contact the TRBMIM; the
device has unknown status because of a cable or
intermediate device failure, or polling has been
disabled.
The Communication Information area of the Model Information view
provides Device Communications Manager (DCM) time-out and retry values,
and the community name.
DCM Timeout Ð The time, in thousandths of a second, between retry
attempts to the Token Ring device that will be performed after a failure has
occurred. The default value is 3000 (hence, a 3-second interval).
DCM Retry Ð The number of times that the DCM will attempt to contact the
Token Ring device after a failure has occurred. The default value is 3.
Community Name Ð The SNMP community name that has been assigned
to the Token Ring device.
Mgmnt Protocol Ð The protocol that is being used to manage the TRBMIM
(SNMP, ICMP, or EPI).
The Poll/Log Information area of the Token Ring Device Model Information
view provides information on the modelÕs polling and attribute conÞguration.
Poll Interval Ð The time interval, in seconds, that SpectroSERVER will
read all attributes of the TRBMIM model that are ßagged as ÒPOLLED.Ó
9031251 E6
ConÞguration & Station Table Views
3-27
Token Ring Station Table Views
Polling Status
The Polling Status button allows an administrator to disable SpectroSERVER
polls of a device by setting Polling Status to FALSE. This is useful to disable
rollup conditions for minor network events such as a workstation power-down.
Last Successful Poll Ð The date and time that the SpectroSERVER last
successfully polled the Token Ring device model.
Log Ratio Ð The number of SpectroSERVER polls of a device that occur
prior to logging the poll results in the database.
The Attribute List area displays the attributes available for the TRBMIM
that can have their Attribute Extension Flags set to ÒLoggedÓ or ÒPolled.Ó For
information on this procedure, refer to the SPECTRUM Model Type Editor
Guide.
Token Ring Station Table Views
The TRBMIM device also provides an inter-related set of table views
pertaining to the stations on the ring. Most of these are modiÞcations of an
associated table view, but a few can be accessed independently. In general,
these table views have common features, including the common provision to
related dialog boxes, which can be accessed from any one of these views.
Consequently, the following discussion describes the Þrst such table view in
detail, with the descriptions for the other table views being limited to those
features which are unique to that particular table view.
Token Ring Station Table View
Opening the Token Ring Station Table View
To open the Token Ring Station Table view, you can highlight the R1 or R2
Spanning Tree Port Type label in the applicable Ring Management icon on the
Logical Device view, or the HubCSITR icon in the DevTop view, or either the
CtTokenRingApp icon or the HubCSITR icon in the Application view, and then
select the Icon Subviews > Stations option.
NOTE
If you try to open the Station view from the Ring-1 icon or the
CtTokenRingApp model when nothing is connected to the Station port, a
dialog box will appear, displaying an ÒError Invoking ActionÓ message.
ConÞguration & Station Table Views
3-28
TRBMIM
Management Module Guide
Token Ring Station Table Views
Token Ring Station Table View
Token Ring Station Table View Details
In addition to the general conÞguration information common to most generic
views, enclosed within the status border in the top part of the view, the Token
Ring Station Table view displays a Station Table containing information for
all stations directly connected to the TRBMIM device, control buttons to
manipulate the information in the table, and selection buttons to access other
views pertaining to related information.
A highlighted band located directly below the view name, and also common to
all of the related table views, provides the following information:
Ring Name Ð The ASCII name assigned to this ring. This name defaults to
Network n, where n is a unique integer value.
Ring Number Ð The number of the attached ring. If SPECTRUM cannot
determine the number of the ring, a zero is returned.
Ring Speed Ð The speed of the ring, which can have a value of 4 or 16
megabits.
Ring Status Ð The operational state of the ring.
In addition, the following Þeld appears below the just-discussed highlighted
band:
Active Monitor Ð This readout gives the MAC address of the active monitor
for the ring. (The station address of the monitor can be identiÞed in any of the
table views listings, regardless of whether the table is set for the MAC or
Canonical address formats, by the appearance of an asterisk (*) directly
following the address entry).
The blocked-off Station Table area in the lower half of the Token Ring
Station Table view provides the following information as column entries, with
each row associated with a speciÞc station. In each case, the column heading
for this information is designated by the readout of a selection button that you
can press to identify this column as the column of interest before using the
sort-function or Þlter-function buttons, as described below.
Station Address
The address of the station to which the information in the line entry pertains.
Station Name
The ASCII name assigned to the station to which the information in the line
entry pertains.
Frames
The total number of frames that have been received/generated by the station
to which the information in the line entry pertains.
9031251 E6
ConÞguration & Station Table Views
3-29
Token Ring Station Table Views
Token Ring Station Table View
Errors
The total number of errors that have been detected on the ring by the station
to which the information in the line entry pertains.
Module
The slot number of the token ring module connected to the station to which
the information in the line entry pertains.
Port
The number of the port on the token ring module connected to the station to
which the information in the line entry pertains.
The blocked-off Station Table area also includes Þve buttons, arranged
across the top of the table, that can affect the information being displayed in
the table at any given time:
Sort Up/Sort Down/Un-Sort
The button in the upper right corner of the blocked-off Station Table area is
a three-selection button that lets you sort the entries displayed in the table.
This button is inactive (grayed-out) until you click on one of the columnheading buttons at the top of the table, thereby designating the column in
which you are interested. When you click on this sort-function button after
selecting a column of interest, a pop-up menu displays three selection
possibilities: Sort Up, Sort Down, or Un-Sort. Whichever one you select
then becomes the new readout designator for that button, and the table
entries then become rearranged in accordance with whichever sorting
sequence you selected for the given column.
Set/Clear Filter
The button just to the left of the sort-function button is a two-selection button
that lets you establish or clear a character string to be used as a Þlter for
selecting speciÞc stations to be listed in the table. This button is inactive
(grayed-out) until you click on one of the column-heading buttons at the top of
the table, thereby designating the column in which you are interested. When
you click on this Þlter-function button after selecting a column of interest, a
pop-up menu displays two selection possibilities: Set Filter and Clear Filter.
Whichever one you select then becomes the new readout designator for that
button, and the table entries then become rearranged in accordance with
whatever Þlter setup has been. If you select the Clear Filter option, any
previously established Þlter mask is removed, allowing the table to list all
connected stations. If you select the Set Filter option, the system displays a
dialog box, named for whichever column heading you last selected, with a oneline entry Þeld soliciting your character string mask. You have a choice of
entering the desired character string and then clicking on the OK button to
initiate the Þlter setup or else clicking on the Cancel button to exit from this
Þlter-setup process without affecting the existing display.
ConÞguration & Station Table Views
3-30
TRBMIM
Management Module Guide
Token Ring Station Table Views
Token Ring Station Table View
Update
Clicking on the Update button, located in the upper left corner of the blockedoff Station Table area, causes the program to update the contents of the
Station Table.
Totals/Deltas
The button located directly to the right of the Update button in the upper left
corner of the blocked-off Station Table area, is a two-selection button that
affects the display of statistical information listed in the table. This is a
current-state display button, with the readout identifying whichever selection
is currently selected. Selecting Totals displays the Frames statistics as totals
since the TRBMIM was initialized. Selecting Deltas displays the difference
between the current totals value and the value at the time of the last update.
MAC/Canonical
The button located directly to the right of the Totals/Deltas button is a twoselection button that affects the display of the station addresses, toggling the
format between MAC (Physical) and Canonical (Ethernet) address formats.
This button is an alternate-state display button, with the readout identifying
whichever format is currently selected.
Each of these address formats consists of six pairs of BCD numbers, each pair
separated by a colon, with the whole representing an 89-bit binary value. The
distinction between these formats is that the Canonical address format sends
the binary bits low-order bit Þrst, while the MAC address format sends the
binary bits high-order bit Þrst. Consequently, a pair having a binary value of
10111000 will be represented by a Canonical address of B8, whereas the
MAC-format version of that same value will be read as a binary value of
00011101, listed as a MAC value of 1D.
In addition, there are three selection buttons located in the lower left corner of
the blocked-off table area. Each of these buttons provides access to a different
station-related function pertaining to whichever station entry in the table is
highlighted when the button is selected, as follows:
Station Detail
The Station Detail button opens the Station Detail view, which is described
in Token Ring Station Detail View, starting on page 3-38. (You can also open
this same view by double-clicking on a station entry in the table, itself.)
Station Alarms
The Station Alarms button opens the Station Alarms dialog box, which is
described in Station Alarms Dialog Box, starting on page 3-40.
9031251 E6
ConÞguration & Station Table Views
3-31
Token Ring Station Table Views
Token Ring Station Isolating Errors Table View
Remove Station
The Remove Station button opens the Remove Station dialog box, which lets
you remove the selected station (whichever station is associated with the
address entry that was highlighted when this button was selected) from the
ring. The Remove Station dialog box asks if you wish to remove the designated
station from the ring and provides only two choices: Yes or No. Selecting the
Yes button removes the addressed station from the ring and exits from the
dialog box; selection of the No button simply exits from the dialog box without
making any change to the ring.
Finally, two selection buttons located just above the blocked-off Station Table
area provide respective access to other table views, each of which then leads to
another view:
Isolating Errors Table
The Isolating Errors Table button opens the Token Ring Station Isolating
Errors Table view, which is described in Token Ring Station Isolating Errors
Table View, starting on page 3-32. That view in turn gives access to the Token
Ring Station Non-Isolating Errors Table view, which is described in Token
Ring Non-Isolating Errors Table View, starting on page 3-34.
Alarms Table
The Alarms Table button opens the Token Ring Station Alarm Thresholds
view, which is described in Token Ring Station Alarm Thresholds View,
starting on page 3-35. That view in turn gives access to the Token Ring
Station Alarm States view, which is described on page 3-37.
Token Ring Station Isolating Errors Table View
The Token Ring Station Isolating Errors Table view displays an Isolating
Errors Table containing information for all stations directly connected to the
TRBMIM device, buttons to manipulate the information in the table, and
buttons to access other views.
Opening the Token Ring Isolating Errors Table View
You can access the Token Ring Station Isolating Errors view by clicking on the
Isolating Errors button in the Token Ring Station Table view (refer to Token
Ring Station Table Views, starting on page 3-28). Alternatively, you can
highlight either the CtTokenRingApp icon or the HubCSITR icon in the
Applications view and then select the Station Errors option from the device
menu (if using the right mouse button) or by pulling down the File menu from
the menu bar and selecting the File > Icon Subviews > Station Errors
option if using the left mouse button.
ConÞguration & Station Table Views
3-32
TRBMIM
Management Module Guide
Token Ring Station Table Views
Token Ring Station Isolating Errors Table View
Token Ring Station Isolating Errors Table View Details
In addition to the general conÞguration information common to most generic
views, enclosed within the status border in the top part of the view, the Token
Ring Isolating Errors Table view displays the same Ring Name, Ring Number,
Ring Speed, Ring Status, and Active Monitor information as presented in the
Token Ring Station Table view (refer to descriptions of these Þelds on
page 3-29).
The blocked-off Station Isolating Errors Table area in the lower half of the
screen also uses the same tabular setup as the previously described Token
Ring Station Table view. This setup includes the same Station Address and
Station Name columns, the Update, Totals/Deltas, MAC/Canonical, Sort Up/
Sort Down/Un-Sort, and Set/Clear Filter control buttons across the top of the
table, and the same Station Detail, Station Alarms, and Remove Station
selection buttons below the table entries. For information on these controls,
refer to Token Ring Station Table View Details, starting on page 3-29.
What is different about the Station Isolating Errors Table is that it provides
Þve new columns of information pertaining to isolated errors with respect to
each station listed in the table, with each such column identiÞed by the
readout of a selection button utilized as the column heading. As with the
Station Address and Station Name column buttons, clicking on any of these
buttons selects that column as the column of interest for any subsequent
activation of the sort-function and Þlter function buttons. The added columns
are as follows:
Line
The number of line errors detected on the ring by the station to which the
information in the line entry pertains.
Burst
The number of burst errors detected on the ring by the station to which the
information in the line entry pertains.
A/C
The number of address/copied errors detected on the ring by the station to
which the information in the line entry pertains.
Abort
The number of abort sequences that have been sent by the station to which
the information in the line entry pertains.
Internal
The number of internal errors that have been detected by the station to which
the information in the line entry pertains.
9031251 E6
ConÞguration & Station Table Views
3-33
Token Ring Station Table Views
Token Ring Non-Isolating Errors Table View
Finally, two selection buttons located just above the blocked-off Station Table
area provide respective access to other table views, each of which then leads to
another view:
Non-Isolating Errors Table
The Non-Isolating Errors Table button, provided in place of the Isolating
Errors Table button appearing in this same location in the Token Ring Station
Table view, opens the Token Ring Station Non-Isolating Errors Table view,
which is described in Token Ring Non-Isolating Errors Table View, following.
Alarms Table
The Alarms Table button is the same as described for the Token Ring Station
Table view. Clicking on this button opens the Token Ring Station Alarm
Thresholds view, which is described in Token Ring Station Alarm Thresholds
View, starting on page 3-35. That view in turn gives access to the Token Ring
Station Alarm States view, which is described on page 3-37.
Token Ring Non-Isolating Errors Table View
Opening the Token Ring Non-Isolating Errors Table View
To open the Token Ring Non-Isolating Errors Table view, click on the NonIsolating Errors button in the Token Ring Station Isolating Errors view
(refer to Token Ring Station Isolating Errors Table View Details, starting on
page 3-33).
Token Ring Non-Isolating Errors Table View Details
In addition to the general conÞguration information common to most generic
views, enclosed within the status border in the top part of the view, the Token
Ring Isolating Errors Table view displays the same Ring Name, Ring Number,
Ring Speed, Ring Status, and Active Monitor information as presented in the
Token Ring Station Table view (refer to descriptions of these Þelds on
page 3-29).
The blocked-off Station Non-Isolating Errors Table area in the lower half
of the screen also uses the same tabular setup as the previously described
Token Ring Station Table view and the Token Ring Isolating Errors Table
view. This setup includes the same Station Address and Station Name
columns, the Update, Totals/Deltas, MAC/Canonical, Sort Up/Sort Down/UnSort, and Set/Clear Filter control buttons across the top of the table, and the
same Station Detail, Station Alarms, and Remove Station selection buttons
ConÞguration & Station Table Views
3-34
TRBMIM
Management Module Guide
Token Ring Station Table Views
Token Ring Station Alarm Thresholds View
below the table entries, as well as the Alarm Table selection button just above
the table. For information on these controls, refer to Token Ring Station Table
View Details, starting on page 3-29.
What is different about the Station Non-Isolating Errors Table is that it
provides Þve new columns of information pertaining to non-isolated errors
with respect to each station listed in the table, with each such column
identiÞed by the readout of a selection button utilized as the column heading.
As with the Station Address and Station Name column buttons, clicking on
any of these buttons selects that column as the column of interest for any
subsequent activation of the sort-function and Þlter function buttons. The
added columns are as follows:
LostFrames
The number of lost frames that have been detected on the ring by the station
to which the information in the line entry pertains.
Congestion
The number of congestion errors that have been detected on the ring by the
station to which the information in the line entry pertains.
FrameCopied
The number of frame-copied errors that have been detected on the ring by the
station to which the information in the line entry pertains.
Token
The number of token errors that have been detected on the ring while the
active monitor was the station to which the information in the line entry
pertains.
Frequency
The number of frequency errors that have been detected on the ring by the
station to which the information in the line entry pertains.
Token Ring Station Alarm Thresholds View
Opening the Token Ring Station Alarm Thresholds View
You can access the Token Ring Station Alarm Thresholds view by clicking on
the Alarms Table button in the Token Ring ConÞguration View (refer to
Token Ring ConÞguration View Details, starting on page 3-16) or by clicking
on the Alarms Table button located just above the station table area in any of
9031251 E6
ConÞguration & Station Table Views
3-35
Token Ring Station Table Views
Token Ring Station Alarm Thresholds View
the Token ring Station Table view, the Token Ring Station Isolating Errors
view, or the Token Ring Station Non-Isolating Errors view (refer to Token Ring
Station Table View Details, starting on page 3-29).
Token Ring Station Alarm Thresholds View Details
In addition to the general conÞguration information common to most generic
views, enclosed within the status border in the top part of the view, the Token
Ring Isolating Errors Table view displays the same Ring Name, Ring Number,
Ring Speed, Ring Status, and Active Monitor information as presented in the
Token Ring Station Table view (refer to descriptions of these Þelds on
page 3-29).
The blocked-off Station Alarm Thresholds Table area in the lower half of
the screen also uses the same tabular setup as the previously described Token
Ring Station Table view, with all but one of the columns having the same
button-readout headings, but the meanings are slightly different in this case,
as described below. In addition, this table setup includes the same Update,
Totals/Deltas, MAC/Canonical, Sort Up/Sort Down/Un-Sort, and Set/Clear
Filter control buttons across the top of the table, and the same Station Detail,
Station Alarms, and Remove Station selection buttons below the table entries.
For information on these Þelds and controls, refer to Token Ring Station Table
View Details, starting on page 3-29.
What is different about the Station Alarm Thresholds Table is that the data
columns identify the threshold settings for the different alarm conditions for
each station listed in the table. As with the other tables, each such column is
identiÞed by the readout of a selection button utilized as the column heading.
As with the Station Address and Station Name column buttons, which are the
same as on the Station Table, clicking on any of these buttons selects that
column as the column of interest for any subsequent activation of the sortfunction and Þlter function buttons. The added columns are as follows:
Line
The current alarm threshold setting for line errors to be detected on the ring
with respect to the station to which the information in the line entry pertains.
(The resulting number of detections will appear in the Line column of the
Station Isolating Errors Table.)
Burst
The current alarm threshold setting for burst errors with respect to the
station to which the information in the line entry pertains. (The resulting
number of detections will appear in the Burst column of the Station Isolating
Errors Table.)
ConÞguration & Station Table Views
3-36
TRBMIM
Management Module Guide
Token Ring Station Table Views
Token Ring Station Alarm States View
A/C
The current alarm threshold setting for address/copied errors with respect to
the station to which the information in the line entry pertains. (The resulting
number of detections will appear in the A/C column of the Station Isolating
Errors Table.)
Internal
The current alarm threshold setting for internal errors with respect to the
station to which the information in the line entry pertains. (The resulting
number of detections will appear in the Internal column of the Station
Isolating Errors Table.)
Congestions
The current alarm threshold setting for congestion errors with respect to the
station to which the information in the line entry pertains. (The resulting
number of detections will appear in the Congestions column of the Station
Non-Isolating Errors Table.)
Another difference between the Station Table and this Station Alarm
Thresholds Table is that there is only one button located above the table, to
the right of the Station Monitor Þeld:
Alarm States Table
Clicking on the Alarm States Table button opens the Token Ring Station
Alarm States view, which is described in Token Ring Station Alarm States
View, starting on page 3-37.
Token Ring Station Alarm States View
Opening the Token Ring Station Alarm States View
You can access the Station Alarm States view by clicking on the Alarm
States Table button in the Token Ring Station Alarm Threshold view (refer
to Token Ring Station Alarm Thresholds View Details, starting on page 3-36).
Token Ring Station Alarm States View Details
The information and controls available in the token ring Station Alarm States
view is exactly the same as described for the Token Ring Station Alarm
Thresholds view in the preceding subsection, except that the data-column
9031251 E6
ConÞguration & Station Table Views
3-37
Token Ring Station Table Views
Token Ring Station Detail View
entries in the Station Alarm êtates Table that appears in that view in place of
the Station Alarm Thresholds Table simply identiÞes whether the associated
alarm (Line, Burst, A/C, Internal, or Congestions) for each listed station is
Enabled or Disabled. For information pertaining to the alarms, refer to
Token Ring Station Alarm Thresholds View Details, starting on page 3-36. To
change the current state of any given alarm or combinaton of alarms for a
speciÞc station, yu can select the line entry pertaining to that station and then
click on the Station Alarms button at the bottom of the table; refer to ?? for
information pertaining to operation of the Station Alarms Dialogue dialog box.
Token Ring Station Detail View
Opening the Station Detail View
To open the Station Detail view for any desired station in the token ring
network, select the line entry pertaining to that station in any of the station
tables (in the Token Ring Station Table view, the Token Ring Station Isolating
Errors view, the Token Ring Station Non-Isolating Errors view, the Token
Ring Alarm Thresholds view, or the Token Ring Station Alarm States view)
and then either double-click on that line entry or else click on the Station
Detail button in the lower left corner of the table.
Station Detail View Details
In addition to the general conÞguration information common to most generic
views, enclosed within the status border in the top part of the view, the
Station Detail view displays basic information and alarm statistics for the
selected station, control buttons to manipulate the displayed statisitcs, and
selection buttons to access related dialog boxes.
A highlighted band located directly below the view name provides the
following information:
Station Address Ð The MAC address of the station to which the information
in this view pertains.
Station Name Ð The ASCII name assigned to this station.
Station Module Ð The slot number of the token ring module to which this
station is connected.
Station Port Ð The number of the port to which this station is connected on
the token ring module.
ConÞguration & Station Table Views
3-38
TRBMIM
Management Module Guide
Token Ring Station Table Views
Token Ring Station Detail View
Directly below this highlighted band are three other Þelds providing unique
information pertaining to this station:
Upstream Ð The MAC address of the device (neighbor) immediately
upstream of the TRBMIM on the ring.
Downstream Ð The MAC address of the device (neighbor) immediately
downstream of the TRBMIM on the ring.
Station Priority Ð The selected stationÕs maximum access priority.
Two selection buttons located to the right of the colored information band
provide selection options for alarm enablement and removal of the station
from the ring:
Station Removal
The Station Removal button lets you modify the removal state of the
station; the readout in this button displays the last request made for the given
station device. Clicking on this button displays a three-selection pop-up menu.
Selecting the Remove option causes the station to be removed from the ring.
Selecting the NotRemovable option disables removal from the ring. The
DoNotRemove option is the default setting; selecting this option does not
affect the station.
Configure Station Alarms
The ConÞgure Station Alarms button opens the Station Alarms
ConÞguration view, which lets you change both the threshold value and/or the
enablement state for the Line, Burst, A/C, Internal, and Received Congestion
errors with respect to the selected station.
The lower half of the Station Detail view provides detailed information on the
selected station. This presentation includes three color-coded pie charts giving
separate breakdowns of Token Ring application statistics for Frame
Breakdown, Isolating Errors, and Non-Isolating Errors. Each statistic is
presented both as a total amount (measured since the TRBMIM was
initialized) and also as a percentage of overall trafÞc. Table 3-5 provides
information on the statistics displayed by the Frame Breakdown pie chart.
Table 3-6 provides information on the statistics displayed by the Isolating
Errors pie chart. Table 3-7 provides information on the statistics displayed by
the Non-Isolating Errors pie chart.
Table 3-5.
Information in Frame Breakdown Pie Chart
Statistic
9031251 E6
DeÞnition
Frames
The total number of frames detected on this station or ring.
Errors
The total number of errors detected by this station or ring.
ConÞguration & Station Table Views
3-39
Token Ring Station Table Views
Station Alarms Dialog Box
Table 3-6.
Information in Isolating Errors Pie Chart
Statistic
Table 3-7.
DeÞnition
Line
The total number of line errors that have occurred on this ring.
Burst
The total number of burst errors that have occurred on this ring.
A/C
The total number of address/copied errors that have occurred on
this ring.
Abort
Sequence
The total number of abort sequences transmitted on this ring.
Internal
The total number of internal errors that have been detected by
any station on this ring.
Information in Non-Isolating Errors Pie Chart
Statistic
DeÞnition
Lost Frames
The total number of times a station has had its TRR timer expire
while trying to transmit.
Congestions
The total number of times a station recognizes a frame addressed
to it, but has no available buffer space.
Frame Copied
The total number of times a station recognizes a frame addressed
to it, and detects that the FS Þeld A bits are set to 1.
Token
The total number of times the station acting as active monitor
recognizes an error condition requiring a token be transmitted.
Frequency
The total number of frequency errors on this ring.
Below each of these pie charts, there is a set of three mutually exclusive
buttons (Total, Delta, and Accum); whichever button you select determines
the way in which the data is represented for that pie chart. A separate Clear
button in that same area works in conjunction with the Accum button. For
more information on the use of these buttons, refer to the SPECTRUM GIB
Editor Guide.
Station Alarms Dialog Box
Opening the Station Alarms Dialog Box
To open the Station Alarms dialog box for any desired station in the token ring
network, highlight the line entry pertaining to that station in any of the
ConÞguration & Station Table Views
3-40
TRBMIM
Management Module Guide
Token Ring Station Table Views
Station Alarms Dialog Box
station tables (in the Token Ring Station Table view, the Token Ring Station
Isolating Errors view, the Token Ring Station Non-Isolating Errors view, the
Token Ring Alarm Thresholds view, or the Token Ring Station Alarm States
view) and then select the Station Alarms button in the lower left corner of the
table.
Station Alarms dialog Box Details
The controls on the Station Alarms dialog box let you modify and/or read the
alarm settings for a single station or for any desired selection of stations on
the ring. (The Stations list initially displays the stations that were on the
ring at the time the dialog box was opened, but you can read and modify the
settings of a valid station that was added to the ring after the view was
opened by entering its address in the Station Þeld.) The Station Alarms
dialog box provides the following information:
Station Ð The address of the current station (initially, the station identiÞed
by whichever line entry was highlighted on the station table in the view from
which you activated the dialog . You can enter the address of any valid station
in this Þeld to make it the current station.
Alarm Ð The threshold alarms that can be manipulated. The alarms in this
column include Line, Internal, Burst, A/C, and Congestion.
Threshold Ð The current setting for each corresponding alarm threshold.
You can change the values by selecting the Þeld and editing the number.
State Ð The state of each corresponding alarm threshold (Enable or
Disable), as determined by whichever mutually exclusive button was last
slelected
Stations Ð The MAC addresses of all stations in the ring at the time the
dialog box was opened, except the current station, which is displayed in the
Apply Settings to list. Double-clicking on an address in this list moves it to the
Apply Settings to list. Alternatively, you can highlight any desired station
address in that list and then click on the > button to move that station address
to the Apply Settings to Þeld.
Apply Settings to Ð The MAC addresses of all stations to which the
threshold settings may be applied. When the dialog box is intially opened, this
list will contain the current stationÕs MAC address, but you can move any
desired combination of addresses from the Stations list to this Þeld. Doubleclicking on an address in this list moves it to the Stations list. Alternatively,
you can highlight any desired station address in this Apply Settings to list
and then click on the < button to move that station address to the Stations
Þeld.
9031251 E6
ConÞguration & Station Table Views
3-41
Token Ring Station Table Views
Station Alarms Dialog Box
>
The > button moves the selected item from the Stations list to the Apply
Settings to list.
<
The < button moves the selected item from the Apply Settings to list to the
Stations list.
>>
The >> button moves all of the stations from the Stations list to the Apply
Settings to list. The current station remains at the top of the Apply Settings
to list if it is a valid station.
<<
The << button moves all of the stations from the Apply Settings to list to the
Stations list. The current station remains at the top of the Apply Settings to
list if it is a valid station.
Apply
The Apply button applies the threshold settings to the stations listed in the
Apply Settings to list Ñ or to the station currently identiÞed in the Station
Þeld if that list is empty.
Read
The Read button initiates a read of the threshold settings for the selected
station Ñ or to the station currently identiÞed in the Station Þeld if that list
is empty.
Cancel
The Cancel button lets you exit from the dialog box; this exit does no0t affect
the conditioin of any stations, which are directed to accept any value
modiÞcations ohly when you click on the Apply button.
Modifying Threshold Settings
To change the threshold settings for one or more stations, proceed as follows:
1. Move the addresses of all the stations to be modiÞed to the Apply
Settings to list. If you are only modifying the current station, as
identiÞed in the Station Þeld, this step is not necessary. If you wish to
modify a valid station that does not appear in the Apply Settings to list,
enter the MAC address of that station into the Station Þeld. For
ConÞguration & Station Table Views
3-42
TRBMIM
Management Module Guide
Token Ring Station Table Views
Station Alarms Dialog Box
information on how to move addresses between lists, refer to the button
descriptions in the preceding subsection.
2. Select the desired settings to be applied to the current station and all
stations in the Apply Settings to list by clicking on Enable or Disable
for each alarm threshold, and/or typing any new desiored value into one or
more Threshold Þelds.
3. Click on the Apply button.
If the new alarm thresholds cannot be written to the device, because of the
device being down, the system will display an error message and you should
try again later.
Reading Thresholds from a Station
To read the current threshold settings from any station, proceed as follows:
1. Select the station to be read from the Apply Settings to list, moving the
station address to that list if necessary. If you wish to modify a valid
station that does not appear in either list, enter its MAC address into the
Station Þeld.
2. Click on the Read button. The threshold settings for the selected station
are read from the device, appearing in the applicable Threshold Þelds.
9031251 E6
ConÞguration & Station Table Views
3-43
Token Ring Station Table Views
Station Alarms Dialog Box
ConÞguration & Station Table Views
3-44
TRBMIM
Management Module Guide
Chapter 4
Event and Alarm Messages
What is in this Chapter
This chapter deÞnes the types of events and alarms generated by the
TRBMIM function and provides the corresponding probably cause message (if
any) corresponding to those alarms.
TRBMIM Events and Alarms
SPECTRUM has been coded to respond to certain predictable events
pertaining to the TRBMIM module and/or to token-ring operations by
displaying corresponding event/alarm messages from the Spectrum/SGSupport/CsEvFormat directory, as listed in the left-hand column of Table 4-1,
along with activating appropriate visual alarm indications. In addition, many
of these event/alarm situations cause the system to display a corresponding
probable cause message in the Enterprise Alarm Manager view from the
Spectrum/SG-Support/CsPCause directory, as listed here for your convenience
in the right-hand column of Table 4-1. If the triggering event does not
constitute an alarm condition, no probable-case message appear, as also
designated in the table. When the system displays these messages, the coded
items designated in Table 4-1 are replaced by applicable values from the
Spectrum/SS/CsVendor/Ctron_TRBMIM/BdgCSITRBMIM/AlertMap Þle,
thereby identifying the applicable port(s), channel(s), device(s), etc.
9031251 E6
4-1
TRBMIM Events and Alarms
Table 4-1.
TRBMIM Events and Alarms (Sheet 1 of 23)
System Event Log Message
Source and Text
Alarm View Probable Cause Message
Source and Text
CsEvFormat/Event000d0001
CsPCause/Prob000d0001
{d Ò%w- %d %m-, %Y - %TÓ} {m} of type {t} has
reported a root change (event [{e}]).
This bridge has become the new root of the
Spanning Tree.
CsEvFormat/Event000d0002
CsPCause/Prob000d0002
{d Ò%w- %d %m-, %Y - %TÓ} {m} of type {t} has
reported a network topology change (event [{e}]).
A port has transitioned from the Learning state to
the Forwarding state, or from the Forwarding
state to the Blocking state.
CsEvFormat/Event00010810
CsPCause/Prob00010810
{d Ò%w- %d %m-, %Y - %TÓ} - RMON rising
threshold trap received from model {m} of type {t}.
AlarmIndex {I 1}, AlarmVariable {O 2},
AlarmSampleType {I 3}, AlarmValue {I 4} and
AlarmRisingThreshold {I 5}. (event [{e}])
Remote Monitor Rising Alarm Threshold
Exceeded
CsEvFormat/Event00010811
CsPCause/Prob00010811
{d Ò%w- %d %m-, %Y - %TÓ} - RMON falling
threshold trap received from model {m} of type {t}.
AlarmIndex {I 1}, AlarmVariable {O 2},
AlarmSampleType {I 3}, AlarmValue {I 4} and
AlarmFallingThreshold {I 5}. (event [{e}])
Remote Monitor Falling Alarm Threshold
Exceeded
CsEvFormat/Event00010812
CsPCause/Prob00010812
{d Ò%w- %d %m-, %Y - %TÓ} - RMON packet
match trap received from model {m} of type {t}.
Channel description: {S 3}. Channel had {I 2}
matches. (event [{e}])
Packet Match Trap
This trap will be generated when the value of the
trap exceeds the rising threshold for the alarm.
This trap will be generated when the value of the
trap exceeds the falling threshold for the alarm.
This trap will be generated when a packet is
captured by a channel that is conÞgured for
sending SNMP traps.
CsEvFormat/Event00010306
No probable cause message.
{d Ò%w- %d %m-, %Y - %TÓ} - A(n) {t} device,
named {m}, has been cold started. (event [{e}])
CsEvFormat/Event00010307
No probable cause message.
{d Ò%w- %d %m-, %Y - %TÓ} A(n) {t} device, named
{m} has been warm started. (event [{e}])
CsEvFormat/Event00010308
CsPCause/Prob00010308
{d Ò%w- %d %m-, %Y - %TÓ} A(n) {t} device, named Communication link is down.
{m}, has detected a communication Link Down.
(event [{e}])
Event and Alarm Messages
4-2
TRBMIM
Management Module Guide
TRBMIM Events and Alarms
Table 4-1.
TRBMIM Events and Alarms (Sheet 2 of 23)
System Event Log Message
Source and Text
CsEvFormat/Event00010309
Alarm View Probable Cause Message
Source and Text
CsEvFormat/Event00010309
{d Ò%w- %d %m-, %Y - %TÓ} A(n) {t} device, named {d Ò%w- %d %m-, %Y - %TÓ} A(n) {t} device, named
{m}, has detected a communication Link Up.
{m}, has detected a communication Link Up.
(event [{e}])
(event [{e}])
CsEvFormat/Event0001030a
CsPCause/Prob0001030a
{d Ò%w- %d %m-, %Y - %TÓ} A(n) {t} device, named Authorization failure. Other user is trying to
connect to device with an invalid community
{m}, has detected an Authentication Failure.
string.
(event [{e}])
CsEvFormat/Event0001030b
CsPCause/Prob0001030b
{d Ò%w- %d %m-, %Y - %TÓ} A(n) {t} device, named Lost contact with EGP neighbor.
{m}, has detected an EGP Neighbor Loss. EGP
Neighbor IP address is {O 1}. (event [{e}])
CsEvFormat/Event00420107
CsPCause/Prob00420107
{d Ò%w- %d %m-, %Y - %TÓ} - MODULE
REMOVAL - Device {m} of Type {t} reported that
Module {I 1} has been Removed. - (event [{e}])
MODULE REMOVAL
CsEvFormat/Event00420108
CsPCause/Prob00420108
SYMPTOMS:
A Module within this Chassis has been Removed
or has Failed.
MODULE INSERTION
{d Ò%w- %d %m-, %Y - %TÓ} - MODULE
INSERTION - Device {m} of Type {t} reported that
SYMPTOMS:
a Module has been Inserted into Slot {I 1}. A Module has been Inserted into this Chassis.
(event [{e}])
CsEvFormat/Event00420119
CsPCause/Prob00420119
{d Ò%w- %d %m-, %Y - %TÓ} - TEMPERATURE
WARM - Device {m} of Type {t} reported that the
Module {I 1} Temperature is Warm. - (event [{e}])
TEMPERATURE WARM
SYMPTOMS:
The Module may be defective or a fan has failed in
the Chassis.
RECOMMENDED ACTIONS:
1) Verify that Module is not defective.
2) Check for fans failures in the Chassis and
repair as needed.
9031251 E6
Event and Alarm Messages
4-3
TRBMIM Events and Alarms
Table 4-1.
TRBMIM Events and Alarms (Sheet 3 of 23)
System Event Log Message
Source and Text
Alarm View Probable Cause Message
Source and Text
CsEvFormat/Event0042011a
CsPCause/Prob0042011a
{d Ò%w- %d %m-, %Y - %TÓ} - TEMPERATURE
HOT - Device {m} of Type {t} reported that the
Module {I 1} Temperature is Hot. - (event [{e}])
TEMPERATURE HOT
SYMPTOMS:
A Module may be defective or a fan has failed in
the Chassis. A serious heat condition is present
and should be addressed immediately.
RECOMMENDED ACTIONS:
1) Verify that Module is not defective.
2) Check for fans failures in the Chassis and
repair as needed.
CsEvFormat/Event0042011b
CsPCause/Prob0042011b
{d Ò%w- %d %m-, %Y - %TÓ} - VOLTAGE LOW Device {m} of Type {t} reported that the Slot {I 1}
Power Supply Voltage is Low. - (event [{e}])
VOLTAGE LOW
SYMPTOMS:
The internal voltage of the Power Supply Module
is Low.
PROBABLE CAUSES:
1) The Power Supply unit is defective.
2) An AC Power Failure has occurred in the Power
Supply.
RECOMMENDED ACTIONS:
1) Check the Power Supply unit on device.
2) Check Power source to device.
CsEvFormat/Event0042011c
No probable cause message.
{d Ò%w- %d %m-, %Y - %TÓ} - TEMPERATURE
NORMAL - Device {m} of Type {t} reported that
the Module {I 1} Temperature is Normal. - (event
[{e}])
CsEvFormat/Event0042011d
No probable cause message.
{d Ò%w- %d %m-, %Y - %TÓ} - VOLTAGE
NORMAL - Device {m} of Type {t} reported that
the Slot {I 1} Power Supply Voltage is Normal. (event [{e}])
Event and Alarm Messages
4-4
TRBMIM
Management Module Guide
TRBMIM Events and Alarms
Table 4-1.
TRBMIM Events and Alarms (Sheet 4 of 23)
System Event Log Message
Source and Text
CsEvFormat/Event0042011e
Alarm View Probable Cause Message
Source and Text
CsPCause/Prob0042011e
{d Ò%w- %d %m-, %Y - %TÓ} - FAN ABNORMAL - FAN ABNORMAL
Device {m} of Type {t} reported that a Fan in the
Chassis has Failed or is operating at an abnormal SYMPTOMS:
A problem has been detected with a Cooling Fan
RPM rate. - (event [{e}])
or the Fan Tray Assembly for this device.
RECOMMENDED ACTION:
This failure should be addressed before
overheating causes damage to the device. Check
for fan failures in the Chassis and repair as
needed.
CsEvFormat/Event0042011f
No probable cause message.
{d Ò%w- %d %m-, %Y - %TÓ} - FAN NORMAL Device {m} of Type {t} reported that a Fan in the
Chassis has resumed Normal Operation. - (event
[{e}])
CsEvFormat/Event00420125
CsPCause/Prob00420125
{d Ò%w- %d %m-, %Y - %TÓ} - VOLTAGE LOW Device {m} of Type {t} reported that the System
Power Supply Voltage is Low. - (event [{e}])
VOLTAGE LOW
SYMPTOMS:
The internal voltage of the System Power Supply
is Low.
PROBABLE CAUSES:
1) The Power Supply unit is defective.
2) An AC Power Failure has occurred in the
System Power Supply.
RECOMMENDED ACTIONS:
1) Check the System Power Supply unit on the
device.
2) Check Power source to device.
CsEvFormat/Event00420126
No probable cause message.
{d Ò%w- %d %m-, %Y - %TÓ} - VOLTAGE
NORMAL - Device {m} of Type {t} reported that
the System Power Supply Voltage has returned to
Normal. - (event [{e}])
9031251 E6
Event and Alarm Messages
4-5
TRBMIM Events and Alarms
Table 4-1.
TRBMIM Events and Alarms (Sheet 5 of 23)
System Event Log Message
Source and Text
CsEvFormat/Event00420136
Alarm View Probable Cause Message
Source and Text
CsPCause/Prob00420136
MODULE INSERTION
{d Ò%w- %d %m-, %Y - %TÓ} - MODULE
INSERTION - Device {m} of Type {t} reported that
SYMPTOMS:
a Module has been Inserted into Slot {I 1}. A Module has been Inserted into this Chassis.
(event [{e}])
CsEvFormat/Event00420201
No probable cause message.
{d Ò%w- %d %m-, %Y - %TÓ} - PORT INSERTED Device {m} of Type {t} reported that a Station has
been Inserted into Port {I 2} in Module {I 1}.(event [{e}])
CsEvFormat/Event00420202
No probable cause message.
{d Ò%w- %d %m-, %Y - %TÓ} - PORT
DEINSERTED - Device {m} of Type {t} reported
that a Station has been DeInserted from Port {I 2}
in Module {I 1}. - (event [{e}])
CsEvFormat/Event00420203
CsPCause/Prob00420203
{d Ò%w- %d %m-, %Y - %TÓ} - RING SPEED
FAULT - Device {m} of Type {t} reported that
Module {I 1} has entered the Ring Speed Fault
State. - (event [{e}])
RING SPEED FAULT
SYMPTOMS:
A Token Ring Module has entered the Ring Speed
Fault State.
PROBABLE CAUSES:
1) A Station or Ring Port attaching with a
different speed than this Module is conÞgured for.
RECOMMENDED ACTIONS:
1) Detach the Station or Ring Port from the
Module.
2) Re-conÞgure the Station or Ring Port speed to
match the speed of the affected Module.
3) Re-attach the Station or Ring Port to the
Module.
CsEvFormat/Event00420204
No probable cause message.
{d Ò%w- %d %m-, %Y - %TÓ} - RING SPEED
FAULT CLEARED - Device {m} of Type {t}
reported that Module {I 1} has left the Ring Speed
Fault State. - (event [{e}])
Event and Alarm Messages
4-6
TRBMIM
Management Module Guide
TRBMIM Events and Alarms
Table 4-1.
TRBMIM Events and Alarms (Sheet 6 of 23)
System Event Log Message
Source and Text
Alarm View Probable Cause Message
Source and Text
CsEvFormat/Event00420205
CsPCause/Prob00420205
{d Ò%w- %d %m-, %Y - %TÓ} - RING PORT
FAULTED - Device {m} of Type {t} reported that
Ring Port {I 2} in Module {I 1} has entered the
Wrapped State while its Management State was
Enabled. - (event [{e}])
RING PORT FAULTED
SYMPTOMS:
A Ring Port has entered the Wrapped State while
its Management State was Enabled.
PROBABLE CAUSES:
1) Bad cable connected to affected Port.
2) Device is down at other end of the cable.
3) Device connection is bad at other end of the
cable.
RECOMMENDED ACTIONS:
1) Check cable connected to affected Port.
2) Power up Device at other end of the cable.
3) Check Device connection at other end of the
cable.
CsEvFormat/Event00420206
No probable cause message.
{d Ò%w- %d %m-, %Y - %TÓ} - RING PORT FAULT
CLEARED - Device {m} of Type {t} reported that
Ring Port {I 2} in Module {I 1} has left the
Wrapped State. - (event [{e}])
9031251 E6
Event and Alarm Messages
4-7
TRBMIM Events and Alarms
Table 4-1.
TRBMIM Events and Alarms (Sheet 7 of 23)
System Event Log Message
Source and Text
CsEvFormat/Event00420207
Alarm View Probable Cause Message
Source and Text
CsPCause/Prob00420207
{d Ò%w- %d %m-, %Y - %TÓ} - BEACON STATE - BEACON STATE
Device {m} of Type {t} reported that a Beacon
State has been detected. The Upstream Neighbor SYMPTOMS:
A Station attached to this Device has detected a
Station is {X 3}. - (event [{e}])
new Beacon on the Ring while the Ring was in
Operational State.
PROBABLE CAUSES:
1) The cable between this Station and its
Upstream Neighbor.
2) The Token Ring Card in the Upstream Neighbor
Station is Bad.
3) This StationÕs Token Ring Card is Bad.
RECOMMENDED ACTIONS:
1) Check the cable between this Station and its
Upstream Neighbor.
2) Check the Token Ring Card in the Upstream
Neighbor Station.
3) Check this StationÕs Token Ring Card.
CsEvFormat/Event00420208
No probable cause message.
{d Ò%w- %d %m-, %Y - %TÓ} - BEACON STATE
CLEARED - Device {m} of Type {t} reported that
the Last Beacon of Type has been cleared.
CsEvFormat/Event00420209
CsPCause/Prob00420209
{d Ò%w- %d %m-, %Y - %TÓ} - STATION ADDED - RING SECURITY BREACH - STATION ADDED
Device {m} of Type {t} reported that Station {X 1}
An Unauthorized Station has become attached to
has been Added to the Allowed Station List. the Ring.
(event [{e}])
CsEvFormat/Event0042020a
CsPCause/Prob0042020a
RING SECURITY BREACH - STATION
{d Ò%w- %d %m-, %Y - %TÓ} - STATION
REMOVED - Device {m} of Type {t} reported that REMOVED
Station {X 1} has been Removed from the Allowed
Unauthorized Station has attempted to attach
Station List. - (event [{e}])
itself to the Ring.
Station was successfully removed from the Ring.
Event and Alarm Messages
4-8
TRBMIM
Management Module Guide
TRBMIM Events and Alarms
Table 4-1.
TRBMIM Events and Alarms (Sheet 8 of 23)
System Event Log Message
Source and Text
Alarm View Probable Cause Message
Source and Text
CsEvFormat/Event0042020b
No probable cause message.
{d Ò%w- %d %m-, %Y - %TÓ} - RING
CONFIGURATION CHANGED - Device {m} of
Type {t} reported that its Ring ConÞguration has
changed. - (event [{e}])
CsEvFormat/Event0042020c
CsPCause/Prob0042020c
{d Ò%w- %d %m-, %Y - %TÓ} - PORT REMOVED
DURING FAULT RECOVERY - Device {m} of
Type {t} reported that Port {I 1} in Module {I 2}
was Removed from the Ring during a Fault
Recovery Condition. - (event [{e}])
PORT REMOVED DURING FAULT RECOVERY
SYMPTOMS:
A Port was Removed from the Ring during a Fault
Recovery Condition.
PROBABLE CAUSES:
1) Bad cable connected to Removed Port.
2) Device connection is bad at other end of the
cable.
RECOMMENDED ACTIONS:
1) Check cable connected to Removed Port.
2) Check Device connection at other end of the
cable.
3) After problem is resolved, Enable the Removed
Port.
9031251 E6
Event and Alarm Messages
4-9
TRBMIM Events and Alarms
Table 4-1.
TRBMIM Events and Alarms (Sheet 9 of 23)
System Event Log Message
Source and Text
CsEvFormat/Event0042020d
Alarm View Probable Cause Message
Source and Text
CsPCause/Prob0042020d
{d Ò%w- %d %m-, %Y - %TÓ} - BOARD BYPASSED BOARD BYPASSED DURING FAULT
RECOVERY
DURING FAULT RECOVERY - Device {m} of
Type {t} reported that Module {I 1} was Bypassed
during a Fault Recovery Condition. - (event [{e}]) SYMPTOMS:
A Module was Bypassed during a Fault Recovery
Condition.
PROBABLE CAUSES:
1) This Module is conÞgured with a different Ring
Speed than the Hub.
RECOMMENDED ACTIONS:
1) Pull out the Bypassed Module from the Hub.
2) Re-conÞgure this ModuleÕs Ring Speed to match
that of the Hub.
3) Physically insert the Module back into the Hub.
4) Set this ModuleÕs Bypass State to Inserted.
CsEvFormat/Event0042020e
CsPCause/Prob0042020e
{d Ò%w- %d %m-, %Y - %TÓ} - PORT VIOLATION
- Device {m} of Type {t} reported that Port {I 2} in
Module {I 1} has detected a Link while the PortÕs
Management State was Disabled. - (event [{e}])
PORT VIOLATION
SYMPTOMS:
A Link has been detected for a Port while its
Management State was Disabled.
PROBABLE CAUSES:
1) A Physical connection has been made between a
Station and a Port while the PortÕs Management
State was Disabled.
RECOMMENDED ACTIONS:
1) If the Station belongs on this Ring, then Enable
the PortÕs Management State.
2) If the Station does not belong on this Ring, then
physically disconnect the Intruding Station from
the Port.
Event and Alarm Messages
4-10
TRBMIM
Management Module Guide
TRBMIM Events and Alarms
Table 4-1.
TRBMIM Events and Alarms (Sheet 10 of 23)
System Event Log Message
Source and Text
Alarm View Probable Cause Message
Source and Text
CsEvFormat/Event0042020f
No probable cause message.
{d Ò%w- %d %m-, %Y - %TÓ} - PORT VIOLATION
CLEARED - Device {m} of Type {t} reported that
Port {I 2} in Module {I 1} has detected an Unlink
while the PortÕs Management State was Disabled.
- (event [{e}])
CsEvFormat/Event00420210
CsPCause/Prob00420210
{d Ò%w- %d %m-, %Y - %TÓ} - FAULT RECOVERY FAULT RECOVERY OSCILLATION
OSCILLATION - Device {m} of Type {t} reported
SYMPTOMS:
that the Ring is oscillating. - (event [{e}])
The Ring is oscillating. Oscillation occurs when
the Ring fails a short time after recovery.
CsEvFormat/Event00420211
CsPCause/Prob00420211
{d Ò%w- %d %m-, %Y - %TÓ} - RING PURGE
THRESHOLD EXCEEDED - Device {m} of Type
{t} reported that the Ring Purge Threshold Value
of {I 1} has been Exceeded within the Timebase
Value of {I 2}. - (event [{e}])
RING PURGE THRESHOLD EXCEEDED
SYMPTOMS:
The Ring Purge Threshold Value has been
Exceeded. A Ring Purge is used to make the Ring
return to a normal condition.
PROBABLE CAUSE:
An Active Monitor will initiate the Ring Purge
process when:
1) A Token Error condition is detected by the
Active Monitor.
2) An adapter becomes the Active Monitor in the
Monitor Contention Process.
9031251 E6
Event and Alarm Messages
4-11
TRBMIM Events and Alarms
Table 4-1.
TRBMIM Events and Alarms (Sheet 11 of 23)
System Event Log Message
Source and Text
Alarm View Probable Cause Message
Source and Text
CsEvFormat/Event00420212
CsPCause/Prob00420212
{d Ò%w- %d %m-, %Y - %TÓ} - RING ACTIVE
MONITOR ERRORS THRESHOLD EXCEEDED
- Device {m} of Type {t} reported that the Ring
Active Monitor Errors Threshold Value of {I 1}
has been Exceeded within the Timebase Value of
{I 2}. - (event [{e}])
RING ACTIVE MONITOR ERRORS
THRESHOLD EXCEEDED
SYMPTOMS:
The Ring Active Monitor Errors Threshold Value
has been Exceeded.
PROBABLE CAUSES:
1) The Active Monitor may have received a Ring
Purge or an Active Monitor Present frame that it
did not transmit.
2) The Active Monitor may have received a Claim
Token MAC frame which indicates that a
duplicate Active Monitor or another Station has
detected an error within the Active Monitor.
CsEvFormat/Event00420213
CsPCause/Prob00420213
{d Ò%w- %d %m-, %Y - %TÓ} - RING TOKEN
ERRORS THRESHOLD EXCEEDED - Device
{m} of Type {t} reported that the Ring Token
Errors Threshold Value of {I 1} has been Exceeded
within the Timebase Value of {I 2}. - (event [{e}])
RING TOKEN ERRORS THRESHOLD
EXCEEDED
SYMPTOMS:
The Ring Token Errors Threshold Value has been
Exceeded.
PROBABLE CAUSE:
The Active Monitor has recognized an error
condition that requires a Token to be transmitted.
This occurs when the timer for a valid
transmission expires (10ms).
CsEvFormat/Event00420214
CsPCause/Prob00420214
{d Ò%w- %d %m-, %Y - %TÓ} - RING CLAIM
TOKEN THRESHOLD EXCEEDED - Device {m}
of Type {t} reported that the Ring Claim Token
Threshold Value of {I 1} has been Exceeded within
the Timebase Value of {I 2}. - (event [{e}])
RING CLAIM TOKEN THRESHOLD
EXCEEDED
SYMPTOMS:
The Ring Claim Token Threshold Value has been
Exceeded.
PROBABLE CAUSES:
When a Station in Standby Monitor state has
determined that there is no Active Monitor
operating on the Ring. If the Station claims the
Token, it becomes the new Active Monitor for the
Ring.
Event and Alarm Messages
4-12
TRBMIM
Management Module Guide
TRBMIM Events and Alarms
Table 4-1.
TRBMIM Events and Alarms (Sheet 12 of 23)
System Event Log Message
Source and Text
Alarm View Probable Cause Message
Source and Text
CsEvFormat/Event00420215
CsPCause/Prob00420215
{d Ò%w- %d %m-, %Y - %TÓ} - RING LOST
FRAMES THRESHOLD EXCEEDED - Device
{m} of Type {t} reported that the Ring Lost
Frames Threshold Value of {I 1} has been
Exceeded within the Timebase Value of {I 2}. (event [{e}])
RING LOST FRAMES THRESHOLD
EXCEEDED
SYMPTOMS:
The Ring Lost Frames Threshold Value has been
Exceeded.
PROBABLE CAUSE:
The Ring Lost Frame Error occurs when a Station
is transmitting and its timer for return expires.
The Lost Frame count keeps track of how many
frames transmitted by a Station fail to return. If a
frame becomes lost the Active Monitor will issue a
new Token.
CsEvFormat/Event00420216
CsPCause/Prob00420216
{d Ò%w- %d %m-, %Y - %TÓ} - RING BEACON
STATE THRESHOLD EXCEEDED - Device {m}
of Type {t} reported that the Ring Beacon State
Threshold Value of {I 1} has been Exceeded within
the Timebase Value of {I 2}. - (event [{e}])
RING BEACON STATE THRESHOLD
EXCEEDED
SYMPTOMS:
The Ring Beacon State Threshold Value has been
Exceeded.
PROBABLE CAUSE:
When a Station determines that a serious Ring
failure has occurred it will generate a Beacon
MAC frame.
CsEvFormat/Event00420217
CsPCause/Prob00420217
{d Ò%w- %d %m-, %Y - %TÓ} - RING FRAME
COUNT THRESHOLD EXCEEDED - Device {m} RING FRAME COUNT THRESHOLD
of Type {t} reported that the Ring Frame Count
EXCEEDED
Threshold Value of {I 1} has been Exceeded within
the Timebase Value of {I 2}. - (event [{e}])
SYMPTOMS:
The Ring Frame Count Threshold Value has been
Exceeded.
CsEvFormat/Event00420218
No probable cause message.
{d Ò%w- %d %m-, %Y - %TÓ} - STATION LINE
ERRORS THRESHOLD EXCEEDED - Device
{m} of Type {t} reported that Station {X 3} has
Exceeded the Line Errors Threshold Value of {I 1}
within the Timebase Value of {I 2}. - (event [{e}])
9031251 E6
Event and Alarm Messages
4-13
TRBMIM Events and Alarms
Table 4-1.
TRBMIM Events and Alarms (Sheet 13 of 23)
System Event Log Message
Source and Text
Alarm View Probable Cause Message
Source and Text
CsEvFormat/Event00420219
No probable cause message.
{d Ò%w- %d %m-, %Y - %TÓ} - STATION
INTERNAL ERRORS THRESHOLD
EXCEEDED - Device {m} of Type {t} reported that
Station {X 3} has Exceeded the Internal Errors
Threshold Value of {I 1} within the Timebase
Value of {I 2}. - (event [{e}])
CsEvFormat/Event0042021a
No probable cause message.
{d Ò%w- %d %m-, %Y - %TÓ} - STATION BURST
ERRORS THRESHOLD EXCEEDED - Device
{m} of Type {t} reported that Station {X 3} has
Exceeded the Burst Errors Threshold Value of {I
1} within the Timebase Value of {I 2}. - (event
[{e}])
CsEvFormat/Event0042021b
No probable cause message.
{d Ò%w- %d %m-, %Y - %TÓ} - STATION A/C
ERRORS THRESHOLD EXCEEDED - Device
{m} of Type {t} reported that Station {X 3} has
Exceeded the A/C Errors Threshold Value of {I 1}
within the Timebase Value of {I 2}. - (event [{e}])
CsEvFormat/Event0042021c
No probable cause message.
{d Ò%w- %d %m-, %Y - %TÓ} - STATION
RECEIVER CONGESTION THRESHOLD
EXCEEDED - Device {m} of Type {t} reported that
Station {X 3} has Exceeded the Receiver
Congestion Threshold Value of {I 1} within the
Timebase Value of {I 2}. - (event [{e}])
CsEvFormat/Event0042021d
CsPCause/Prob0042021d
{d Ò%w- %d %m-, %Y - %TÓ} - STATION REMOVE RING SECURITY BREACH - STATION REMOVE
FAILURE
FAILURE - Device {m} of Type {t} reported that
Station {X 1} could not be Removed from the Ring
Unauthorized Station has attempted and
after three attempts.
succeeded in attaching itself to the Ring. After 3
consecutive tries, the Station was not successfully
removed from the Ring.
Event and Alarm Messages
4-14
TRBMIM
Management Module Guide
TRBMIM Events and Alarms
Table 4-1.
TRBMIM Events and Alarms (Sheet 14 of 23)
System Event Log Message
Source and Text
Alarm View Probable Cause Message
Source and Text
CsEvFormat/Event0042021e
CsPCause/Prob0042021e
{d Ò%w- %d %m-, %Y - %TÓ} - RING SPEED
FAULT - Device {m} of Type {t} reported that
Module {I 1}, Port {I 2} has entered the Ring
Speed Fault State. - (event [{e}])
RING SPEED FAULT
SYMPTOMS:
A Token Ring Module has entered the Ring Speed
Fault State.
PROBABLE CAUSES:
A Station or Ring Port attaching with a different
speed than this Module is conÞgured for.
RECOMMENDED ACTIONS:
1) Detach the Station or Ring Port from the
Module.
2) Re-conÞgure the Station or Ring Port speed to
match the speed of the affected Module.
3) Re-attach the Station or Ring Port to the
Module.
CsEvFormat/Event0042021f
No probable cause message.
{d Ò%w- %d %m-, %Y - %TÓ} - RING SPEED
FAULT CLEARED - Device {m} of Type {t}
reported that Module {I 1}, Port {I 2} has left the
Ring Speed Fault State. - (event [{e}])
CsEvFormat/Event00420220
No probable cause message.
{d Ò%w- %d %m-, %Y - %TÓ} - PORT INSERTED Device {m} of Type {t} reported that a Station has
been Inserted into Board {I 1}, Port Group {I 2},
Port {I 3}. - (event [{e}])
CsEvFormat/Event00420221
No probable cause message.
{d Ò%w- %d %m-, %Y - %TÓ} - PORT
DEINSERTED - Device {m} of Type {t} reported
that a Station has been DeInserted from Board {I
1}, Port Group {I 2}, Port {I 3}. - (event [{e}])
9031251 E6
Event and Alarm Messages
4-15
TRBMIM Events and Alarms
Table 4-1.
TRBMIM Events and Alarms (Sheet 15 of 23)
System Event Log Message
Source and Text
Alarm View Probable Cause Message
Source and Text
CsEvFormat/Event00420222
CsPCause/Prob00420222
{d Ò%w- %d %m-, %Y - %TÓ} - RING SPEED
FAULT - Device {m} of Type {t} reported that
Board {I 1} has entered the Ring Speed Fault
State. - (event [{e}])
RING SPEED FAULT
SYMPTOMS:
A Token Ring Module has entered the Ring Speed
Fault State.
PROBABLE CAUSES:
A Station or Ring Port attaching with a different
speed than this Module is conÞgured for.
RECOMMENDED ACTIONS:
1) Detach the Station or Ring Port from the
Module.
2) Re-conÞgure the Station or Ring Port speed to
match the speed of the affected Module.
3) Re-attach the Station or Ring Port to the
Module.
CsEvFormat/Event00420223
No probable cause message.
{d Ò%w- %d %m-, %Y - %TÓ} - RING SPEED
FAULT CLEARED - Device {m} of Type {t}
reported that Board {I 1} has left the Ring Speed
Fault State. - (event [{e}])
Event and Alarm Messages
4-16
TRBMIM
Management Module Guide
TRBMIM Events and Alarms
Table 4-1.
TRBMIM Events and Alarms (Sheet 16 of 23)
System Event Log Message
Source and Text
Alarm View Probable Cause Message
Source and Text
CsEvFormat/Event00420224
CsPCause/Prob00420224
{d Ò%w- %d %m-, %Y - %TÓ} - RING PORT
FAULTED - Device {m} of Type {t} reported that
Board {I 1}, Port Group {I 2}, Port {I 3} has
entered the Wrapped State while its Management
State was Enabled. - (event [{e}])
RING PORT FAULTED
SYMPTOMS:
A Ring Port has entered the Wrapped State while
its Management State was Enabled.
PROBABLE CAUSES:
1) Bad cable connected to affected Port.
2) Device is down at other end of the cable.
3) Device connection is bad at other end of the
cable.
RECOMMENDED ACTIONS:
1) Check cable connected to affected Port.
2) Power up Device at other end of the cable.
3) Check Device connection at other end of the
cable.
CsEvFormat/Event00420225
No probable cause message.
{d Ò%w- %d %m-, %Y - %TÓ} - RING PORT FAULT
CLEARED - Device {m} of Type {t} reported that
Board {I 1}, Port Group {I 2}, Port {I 3} has left the
Wrapped State. - (event [{e}])
9031251 E6
Event and Alarm Messages
4-17
TRBMIM Events and Alarms
Table 4-1.
TRBMIM Events and Alarms (Sheet 17 of 23)
System Event Log Message
Source and Text
Alarm View Probable Cause Message
Source and Text
CsEvFormat/Event00420226
CsPCause/Prob00420226
{d Ò%w- %d %m-, %Y - %TÓ} - BEACON STATE Device {m} of Type {t} reported that Beacon Type
{I 8} has been detected on Ring {I 1} from station
{T string 2}, address {X 3}. The Upstream
Neighbor Station is {X 4}, Board {I 5}, Port Group
{I 6}, Port {I 7}. - (event [{e}])
BEACON STATE
SYMPTOMS:
A Station attached to this Device has detected a
new Beacon on the Ring while the Ring was in
Operational State.
PROBABLE CAUSES:
1) The cable between this Station and its
Upstream Neighbor.
2) The Token Ring Card in the Upstream Neighbor
Station is Bad.
3) This StationÕs Token Ring Card is Bad.
RECOMMENDED ACTIONS:
1) Check the cable between this Station and its
Upstream Neighbor.
2) Check the Token Ring Card in the Upstream
Neighbor Station.
3) Check this StationÕs Token Ring Card.
CsEvFormat/Event00420227
No probable cause message.
{d Ò%w- %d %m-, %Y - %TÓ} - BEACON STATE
CLEARED - Device {m} of Type {t} reported that
the Last Beacon on Ring {I 1} has been cleared.
CsEvFormat/Event00420228
CsPCause/Prob00420228
{d Ò%w- %d %m-, %Y - %TÓ} - STATION ADDED - RING SECURITY BREACH - STATION ADDED
Device {m} of Type {t} reported that Station {X 2}
Unauthorized Station has become attached to the
on Ring {I 1} has been Added to the Allowed
Ring.
Station List. - (event [{e}])
CsEvFormat/Event00420229
CsPCause/Prob00420229
RING SECURITY BREACH - STATION
{d Ò%w- %d %m-, %Y - %TÓ} - STATION
REMOVED - Device {m} of Type {t} reported that REMOVED
Station {X 2} on Ring {I 1} has been Removed from
Unauthorized Station has attempted to attach
the Allowed Station List. - (event [{e}])
itself to the Ring.
Station was successfully removed from the Ring.
Event and Alarm Messages
4-18
TRBMIM
Management Module Guide
TRBMIM Events and Alarms
Table 4-1.
TRBMIM Events and Alarms (Sheet 18 of 23)
System Event Log Message
Source and Text
Alarm View Probable Cause Message
Source and Text
CsEvFormat/Event0042022c
CsPCause/Prob0042022c
{d Ò%w- %d %m-, %Y - %TÓ} - PORT REMOVED
DURING FAULT RECOVERY - Device {m} of
Type {t} reported that Board {I 1}, Port Group {I
2}, Port {I 3} was Removed from the Ring during a
Fault Recovery Condition. - (event [{e}])
PORT REMOVED DURING FAULT RECOVERY
SYMPTOMS:
A Port was Removed from the Ring during a Fault
Recovery Condition.
PROBABLE CAUSES:
1) Bad cable connected to Removed Port.
2) Device connection is bad at other end of the
cable.
RECOMMENDED ACTIONS:
1) Check cable connected to Removed Port.
2) Check Device connection at other end of the
cable.
3) After problem is resolved, Enable the Removed
Port.
CsEvFormat/Event0042022e
CsPCause/Prob0042022e
{d Ò%w- %d %m-, %Y - %TÓ} - BOARD BYPASSED BOARD BYPASSED DURING FAULT
DURING FAULT RECOVERY - Device {m} of
RECOVERY
Type {t} reported that Board {I 1} was Bypassed
during a Fault Recovery Condition. - (event [{e}]) SYMPTOMS:
A Module was Bypassed during a Fault Recovery
Condition.
PROBABLE CAUSES:
1) This Module is conÞgured with a different Ring
Speed than the Hub.
RECOMMENDED ACTIONS:
1) Pull out the Bypassed Module from the Hub.
2) Re-conÞgure this ModuleÕs Ring Speed to match
that of the Hub.
3) Physically insert the Module back into the Hub.
4) Set this ModuleÕs Bypass State to Inserted.
9031251 E6
Event and Alarm Messages
4-19
TRBMIM Events and Alarms
Table 4-1.
TRBMIM Events and Alarms (Sheet 19 of 23)
System Event Log Message
Source and Text
Alarm View Probable Cause Message
Source and Text
CsEvFormat/Event0042022f
No probable cause message.
{d Ò%w- %d %m-, %Y - %TÓ} - PORT VIOLATION
- Device {m} of Type {t} reported that Board {I 1},
Port Group {I 2}, Port {I 3} has detected a Link
while the PortÕs Management State was Disabled.
- (event [{e}])
CsEvFormat/Event00420230
No probable cause message.
{d Ò%w- %d %m-, %Y - %TÓ} - PORT VIOLATION
CLEARED - Device {m} of Type {t} reported that
Board {I 1}, Port Group {I 2} in Port {I 3} has
detected an Unlink while the PortÕs Management
State was Disabled. - (event [{e}])
CsEvFormat/Event00420231
CsPCause/Prob00420231
{d Ò%w- %d %m-, %Y - %TÓ} - RING PURGE
THRESHOLD EXCEEDED - Device {m} of Type
{t} reported that the Ring Purge Threshold Value
of {I 2} has been Exceeded within the Timebase
Value of {I 3} for Ring {I 1}. - (event [{e}])
RING PURGE THRESHOLD EXCEEDED
SYMPTOMS:
The Ring Purge Threshold Value has been
Exceeded. A Ring Purge is used to make the Ring
return to a normal condition.
PROBABLE CAUSE:
An Active Monitor will initiate the Ring Purge
process when:
1) A Token Error condition is detected by the
Active Monitor.
2) An adapter becomes the Active Monitor in the
Monitor Contention Process.
Event and Alarm Messages
4-20
TRBMIM
Management Module Guide
TRBMIM Events and Alarms
Table 4-1.
TRBMIM Events and Alarms (Sheet 20 of 23)
System Event Log Message
Source and Text
Alarm View Probable Cause Message
Source and Text
CsEvFormat/Event00420232
CsPCause/Prob00420232
{d Ò%w- %d %m-, %Y - %TÓ} - RING ACTIVE
MONITOR ERRORS THRESHOLD EXCEEDED
- Device {m} of Type {t} reported that the Ring
Active Monitor Errors Threshold Value of {I 2}
has been Exceeded within the Timebase Value of
{I 3} for Ring {I 1}. - (event [{e}])
RING ACTIVE MONITOR ERRORS
THRESHOLD EXCEEDED
SYMPTOMS:
The Ring Active Monitor Errors Threshold Value
has been Exceeded.
PROBABLE CAUSES:
1) The Active Monitor may have received a Ring
Purge or an Active Monitor Present frame that it
did not transmit.
2) The Active Monitor may have received a Claim
Token MAC frame which indicates that a
duplicate Active Monitor or another Station has
detected an error within the Active Monitor.
CsEvFormat/Event00420233
CsPCause/Prob00420233
{d Ò%w- %d %m-, %Y - %TÓ} - RING TOKEN
ERRORS THRESHOLD EXCEEDED - Device
{m} of Type {t} reported that the Ring Token
Errors Threshold Value of {I 2} has been Exceeded
within the Timebase Value of {I 3} for Ring {I 1}. (event [{e}])
RING TOKEN ERRORS THRESHOLD
EXCEEDED
SYMPTOMS:
The Ring Token Errors Threshold Value has been
Exceeded.
PROBABLE CAUSE:
The Active Monitor has recognized an error
condition that requires a Token to be transmitted.
This occurs when the timer for a valid
transmission expires (10ms).
CsEvFormat/Event00420234
CsPCause/Prob00420234
{d Ò%w- %d %m-, %Y - %TÓ} - RING CLAIM
TOKEN THRESHOLD EXCEEDED - Device {m}
of Type {t} reported that the Ring Claim Token
Threshold Value of {I 2} has been Exceeded within
the Timebase Value of {I 3} for Ring {I 1}. - (event
[{e}])
RING CLAIM TOKEN THRESHOLD
EXCEEDED
SYMPTOMS:
The Ring Claim Token Threshold Value has been
Exceeded.
PROBABLE CAUSE:
When a Station in Standby Monitor state has
determined that there is no Active Monitor
operating on the Ring. If the Station claims the
Token, it becomes the new Active Monitor for the
Ring.
9031251 E6
Event and Alarm Messages
4-21
TRBMIM Events and Alarms
Table 4-1.
TRBMIM Events and Alarms (Sheet 21 of 23)
System Event Log Message
Source and Text
Alarm View Probable Cause Message
Source and Text
CsEvFormat/Event00420235
CsPCause/Prob00420235
{d Ò%w- %d %m-, %Y - %TÓ} - RING LOST
FRAMES THRESHOLD EXCEEDED - Device
{m} of Type {t} reported that the Ring Lost
Frames Threshold Value of {I 2} has been
Exceeded within the Timebase Value of {I 3} for
Ring {I 1}. - (event [{e}])
RING LOST FRAMES THRESHOLD
EXCEEDED
SYMPTOMS:
The Ring Lost Frames Threshold Value has been
Exceeded.
PROBABLE CAUSE:
The Ring Lost Frame Error occurs when a Station
is transmitting and its timer for return expires.
The Lost Frame count keeps track of how many
frames transmitted by a Station fail to return. If a
frame becomes lost the Active Monitor will issue a
new Token.
CsEvFormat/Event00420236
CsPCause/Prob00420236
{d Ò%w- %d %m-, %Y - %TÓ} - RING FRAME
COUNT THRESHOLD EXCEEDED - Device {m}
of Type {t} reported that the Ring Frame Count
Threshold Value of {I 2} has been Exceeded within
the Timebase Value of {I 3} for Ring {I 1}. - (event
[{e}])
RING FRAME COUNT THRESHOLD
EXCEEDED
CsEvFormat/Event00420237
CsPCause/Prob00420237
{d Ò%w- %d %m-, %Y - %TÓ} - STATION LINE
ERRORS THRESHOLD EXCEEDED - Device
{m} of Type {t} reported that Station {X 4} has
Exceeded the Line Errors Threshold Value of {I 2}
within the Timebase Value of {I 3} for Ring {I 1}. (event [{e}])
LINE ERRORS THRESHOLD EXCEEDED
CsEvFormat/Event00420238
CsPCause/Prob00420238
{d Ò%w- %d %m-, %Y - %TÓ} - STATION
INTERNAL ERRORS THRESHOLD
EXCEEDED - Device {m} of Type {t} reported that
Station {X 4} has Exceeded the Internal Errors
Threshold Value of {I 2} within the Timebase
Value of {I 3} for Ring {I 1}. - (event [{e}])
LOST INTERNAL ERRORS THRESHOLD
EXCEEDED
CsEvFormat/Event00420239
CsPCause/Prob00420239
{d Ò%w- %d %m-, %Y - %TÓ} - STATION BURST
ERRORS THRESHOLD EXCEEDED - Device
{m} of Type {t} reported that Station {X 4} has
Exceeded the Burst Errors Threshold Value of {I
2} within the Timebase Value of {I 3} for Ring {I
1}. - (event [{e}])
LOST BURST ERRORS THRESHOLD
EXCEEDED
Event and Alarm Messages
4-22
SYMPTOMS:
The Ring Frame Count Threshold Value has been
Exceeded.
SYMPTOMS:
The Line Errors Threshold Value has been
Exceeded.
SYMPTOMS:
The Lost Internal Errors Threshold Value has
been Exceeded.
SYMPTOMS:
The Lost Burst Errors Threshold Value has been
Exceeded.
TRBMIM
Management Module Guide
TRBMIM Events and Alarms
Table 4-1.
TRBMIM Events and Alarms (Sheet 22 of 23)
System Event Log Message
Source and Text
Alarm View Probable Cause Message
Source and Text
CsEvFormat/Event0042023a
CsPCause/Prob0042023a
{d Ò%w- %d %m-, %Y - %TÓ} - STATION A/C
ERRORS THRESHOLD EXCEEDED - Device
{m} of Type {t} reported that Station {X 4} has
Exceeded the A/C Errors Threshold Value of {I 2}
within the Timebase Value of {I 3} for Ring {I 1}. (event [{e}])
ADDRESS/COPIED ERRORS THRESHOLD
EXCEEDED
CsEvFormat/Event0042023b
CsPCause/Prob0042023b
{d Ò%w- %d %m-, %Y - %TÓ} - STATION
RECEIVER CONGESTION THRESHOLD
EXCEEDED - Device {m} of Type {t} reported that
Station {X 4} has Exceeded the Receiver
Congestion Threshold Value of {I 2} within the
Timebase Value of {I 3} for Ring {I 1}. - (event
[{e}])
RECEIVER CONGESTION ERRORS
THRESHOLD EXCEEDED
SYMPTOMS:
The Address/Copied Errors Threshold Value has
been Exceeded.
SYMPTOMS:
The Receiver Congestion Errors Threshold Value
has been Exceeded.
CsEvFormat/Event0042023c
No probable cause message.
{d Ò%w- %d %m-, %Y - %TÓ} - RING SPEED
FAULT - Device {m} of Type {t} reported that
Board {I 1}, Port Group {I 2}, Port {I 3} has
entered the Ring Speed Fault State. - (event [{e}])
CsEvFormat/Event0042023d
No probable cause message.
{d Ò%w- %d %m-, %Y - %TÓ} - RING SPEED
FAULT CLEARED - Device {m} of Type {t}
reported that Board {I 1}, Port Group, {I 2}, Port {I
3} has left the Ring Speed Fault State. - (event
[{e}])
CsEvFormat/Event0042023e
No probable cause message.
{d Ò%w- %d %m-, %Y - %TÓ} - TR TPIM
INSTALLED - Device {m} of Type {t} reported a
TPIM was inserted on Board {I 1}, Port Group {I
2}, Port {I 3}. - (event [{e}])
CsEvFormat/Event0042023f
No probable cause message.
{d Ò%w- %d %m-, %Y - %TÓ} - TR TPIM
REMOVED - Device {m} of Type {t} reported a
TPIM was removed on Board {I 1}, Port Group {I
2}, Port {I 3}. - (event [{e}])
9031251 E6
Event and Alarm Messages
4-23
TRBMIM Events and Alarms
Table 4-1.
TRBMIM Events and Alarms (Sheet 23 of 23)
System Event Log Message
Source and Text
Alarm View Probable Cause Message
Source and Text
CsEvFormat/Event00420240
No probable cause message.
{d Ò%w- %d %m-, %Y - %TÓ} - NEIGHBOR
NOTIFICATION FAILED - Device {m} of Type {t}
reported that neighbor notiÞcation process has
not completed on Ring {I 1}. - (event [{e}])
CsEvFormat/Event00420241
CsPCause/Prob00420241
{d Ò%w- %d %m-, %Y - %TÓ} - FAULT RECOVERY FAULT RECOVERY OSCILLATION
OSCILLATION - Device {m} of Type {t} reported
SYMPTOMS:
that Ring {I 1} is oscillating. - (event [{e}])
The Ring is oscillating. Oscillation occurs when
the Ring fails a short time after recovery.
Event and Alarm Messages
4-24
TRBMIM
Management Module Guide
Index
Symbols
Audience xi
< Button 3-24, 3-42
<< Button 3-42
> Button 3-23, 3-42
>> Button 3-42
B
A
A/C 3-39, 3-40, 3-41
A/C (address/copied) Errors 3-33, 3-37
Abort
Sequence 3-40
Abort Errors 3-33
Access Community Name 3-7
Accum 3-40
Acquired Database 3-15
Actions 1-1
Active 3-26
Monitor 3-19, 3-29, 3-33, 3-34, 3-36
Error 3-19
Stations 3-19
ADD Button 3-24
Address
Station 3-29
Administration State 3-21
Alarm 3-41
Alarms 2-13, 2-15, 2-16, 2-20
Table Button 3-32, 3-34, 3-37
View 2-13, 2-15, 2-16, 2-20
alarms 4-1
Alarms Table 3-35, 3-37
AlertMap Þle 4-1
All Paths Explorer Frames 3-10, 3-12
Allowed Station Address 3-22
Allowed Stations 3-23
AMP Errors 3-19
Apply
Button 3-25, 3-42
Settings to 3-41
Associations 1-1
Attribute 1-1
Attribute List area 3-28
BdgCSITRBM 3-26
Beacon
Recovery 3-19
State 3-20
Blocking 3-15
Blue 3-26
Bridge
Number 3-10
Bridge Management status 3-4
Bridge Number 3-11
Bridge Port Model Information View 2-17
Bridging Performance Access Icon
Components 2-14
Bridging Performance Access Label 2-13
Bridging Performance Access Label
Component (Þgure) 2-14
Broken 3-15
Burst 3-39, 3-40, 3-41
Burst Errors 3-33, 3-36
C
Cabletron 1-2
Cabletron Bridging MIB 1-2
Cabletron Chassis MIB 1-2
Cabletron Dot5 MIB 1-2
Cabletron DownLoad MIB 1-2
Cabletron Token Ring FNB MIB 1-2
Cancel Button 3-25, 3-42
Canonical Button 3-21, 3-31
Claim Token Errors 3-19
Clear 3-40
Filter Button 3-21, 3-30
Communication Information area 3-27
Community Name 3-27
Compnent Name 3-7
Component Table 3-6
Field DeÞnitions 3-7
9031251 E6
1
C (Continued)
Condition 3-26
Value 3-26
ConÞguration 2-20
ConÞgure Station Alarms Button 3-39
congestion 3-35
Congestion Errors 3-35
Congestions 3-40, 3-41
Connecting
Bridge 3-22
Connector Count Values 3-26
Contact
Status 3-26
Values 3-26
Conventions xii
Creating 3-26
CsEvFormat directory 4-1
CsPCause directory 4-1
D
DCM 3-27
Retry 3-27
Timeout 3-27
Delete All Allowed Stations Button 3-24
DELETE Button 3-24
Delta 3-40
Deltas Button 3-31
Designated Bridge 3-14
Designated Cost 3-14
Designated Port 3-14
Designated Root 3-14
Destroyed 3-26
Device
Communications Manager 3-27
ConÞguration
View 3-3
Label 2-12
Models 1-3
Device ConÞguration View 2-13
Device Icon Detail 2-12
Device menu 2-13
Device View
Physical
Bridging Only (Þgure) 2-4, 2-5, 2-8
Bridging-and-Management
(Þgure) 2-9
Disable 3-23, 3-41
Disabled 3-13, 3-15, 3-19, 3-21
Index
2
Disallowed Stations 3-23
DoNotRemove 3-39
DownLoad
Application (SPMA) 3-7
Dynamic
Representation 2-1
E
Enable 3-17, 3-41
All
Ring Ports 3-18
Station Ports 3-17
with
Alarm 3-23
Remove and Alarm 3-23
Enabled 3-13, 3-19
EnabledWithAlarms 3-21
EnabledWithRemoveAndAlarm 3-21
EPI 3-27
Error 3-26
Errors 3-30, 3-39
A/C (address/copied) 3-33, 3-37
Abort 3-33
Burst 3-33, 3-36
Congestion 3-35
Frame-Copied 3-35
Frequency 3-35
Internal 3-33, 3-37
Line 3-33, 3-36
Lost Frames 3-35
Token 3-35
Ethernet 3-21, 3-31
events 4-1
F
Filtering Database 3-15
Firmware
Revision 3-3
Forward Transitions 3-15
Forwarding 3-15
Frame
Breakdown Pie Chart 3-39
Copied 3-40
Count 3-20
Frame-Copied Errors 3-35
Frames 3-29, 3-39
Button 3-29
TRBMIM
Management Module Guide
F (Continued)
Frequency 3-40
Frequency Errors 3-35
G
Gauges 2-6
General Information area 3-26
Generic Bridge Port Model Information
View 2-17
Getting Help xiii
Gray 3-26
Green 3-26
H
Hardware Requirements xi
Hardware Revision 3-3
Hop Count 3-10, 3-12
I
ICMP 3-27
ID 3-7
IETF Bridging MIB 1-2
Initial 3-26
Interface 3-21
Interface Dedtail View dialog box 3-6
Interface Detail button 3-6
Interface Status 2-17
Internal 3-39, 3-40, 3-41
Internal Errors 3-33, 3-37
Internet MIB-II (RFC 1213) 1-2
Isolating Errors 3-32
Pie Chart 3-40
Table Button 3-32
L
Largest
Frame 3-10
Last
Successful Poll 3-28
Learning 3-15
Line 3-39, 3-40, 3-41
Line Errors 3-33, 3-36
Listening 3-15
Log
9031251 E6
Ratio 3-28
Logical
Device
Icon 2-10
Components 2-11
Station Port Icon 2-15
Components 2-17
Lost
Child Count 3-26
Frames 3-19, 3-40
Lost Frame Errors 3-35
M
MAC Button 3-21, 3-31
Management
Information Base 1-1, 1-2
Management Ring Icon 2-17
Management Ring Icon Detail 2-19
Maximum Hop Count 3-12
Mgmnt Protocol 3-27
Mgmt_Disabled 3-4
Mgmt_Enabled 3-4
MIB 1-1, 1-2
MM
Name 3-26
Version Number 3-26
Model
Condition Values 3-26
Created By 3-26
Creation Time 3-26
State 3-26
Type 3-26
Name 1-1
Model Informaiton View 2-13
Model Information 2-20
Modify
Allowed Station List
View 3-21, 3-22
Modify Allowed Station List
View 3-1, 3-22
Modifying the Threshold Settings 3-42
Module 3-30
Number 2-12
Index
3
N
Name
Station 3-29
Navigate 2-13, 2-15, 2-16, 2-19
Navigator 2-13, 2-15, 2-16, 2-19
Network
ConÞguration Information 3-1
Error Rates 3-1
Management xi
TrafÞc
Flow 3-1
NoEnable 3-17
Non-Isolating Errors 3-34
Pie Chart 3-40
Table Button 3-34
Notes 2-13, 2-15, 2-16, 2-20
Notice i
NotRemovable 3-39
O
Orange 3-26
Organization xi
P
Performance Access Label 2-14
Performance View 2-17
Physical 3-21, 3-31
Physical Device View
Bridging-Only 2-4, 2-5
Poll
Information 3-27
Interval 3-27
Poll/Log Information area 3-27
Polling
Status 3-28
Port 3-9, 3-30
Status 3-13
Port ConÞguration 2-17
Port ConÞguration View 2-17
Port Icon Detail 2-16
Port Model Information 2-17
Port Model Information View 2-17
Port Number 3-11, 3-13
Port Path Cost 3-14
Port Performance 2-17
Port Priority 3-13
Port State 3-14
Index
4
Port Status Label 2-17
Port Type Label 2-17
Primary
Application
Concept 1-3
R
Read Button 3-25, 3-42
Reading Thresholds from a Station 3-43
Read-Only 3-7
Read-Write 3-7
Receive
Congestion 3-39
Red 3-26
Related Reading xii
Remove 3-39
Station Button 3-32
Restricted Rights Notice ii
Ring
Alarm 3-19
In
Port 2-6
In Number 3-10
Name 3-17, 3-19, 3-20, 3-29, 3-33, 3-34,
3-36
Number 3-17, 3-19, 3-20, 3-29, 3-33,
3-34, 3-36
Out Number 3-10, 3-12
Port 2-6
ON Out Of 3-17
Purges 3-19
Ring ConÞguration
View 3-18
Speed 3-17, 3-19, 3-20, 3-29, 3-33, 3-34,
3-36
Status 3-17, 3-19, 3-20, 3-29, 3-33,
3-34, 3-36
Timebase 3-20
ring
conÞguration 3-18
Ring Alarm/Threshold/State section 3-19
Ring ConÞguration section 3-18
Ring In Number 3-11
Ring Management Icon Component 2-18
Rollup
Threshold Values 3-26
TRBMIM
Management Module Guide
S
Security
Administration State 3-22
ConÞguration View 3-20
String 3-26
Set
Filter Button 3-21, 3-30
SNMP 1-1, 3-27
Sort
Down Button 3-21, 3-30
Up Button 3-21, 3-30
Source
Route
Management Information 3-9, 3-11
Source Route Bridge ConÞguration View 3-8
Source Route ConÞguration 2-15
Source Route Statistics 2-15
Spanning Tree 2-15
Explorer Frames 3-10, 3-12
Spanning Tree Access Label 2-17
Spanning Tree Port ConÞguration View 3-12
Spanning Tree Port States and
DeÞnitions 3-15
SPECTRUM
Portable Management Applications
(SPMAs) 1-3
SPMA tools 1-3
State 3-41
Station 3-41
A/C (address/copied) Errors 3-33, 3-37
Abort Errors 3-33
Address 3-29, 3-38
Button 3-29
Alarm Thresholds View 3-35, 3-37
Alarms
Button 3-31
Dialog Box 3-40
Burst Errors 3-33, 3-36
Congestion Errors 3-35
Detail
Button 3-31
View 3-38
Errors 3-30
Button 3-30
Frame-Copied Errors 3-35
Frames 3-29
Button 3-29
Frequency Errors 3-35
Internal Errors 3-33, 3-37
9031251 E6
Line Errors 3-33, 3-36
Lost Frame Errors 3-35
Module 3-38
Module Button 3-30
Name 3-29, 3-38
Button 3-29
Port 2-6, 3-30, 3-38
Button 3-30
ON Out Of 3-17
Priority 3-39
Removal 3-39
Table Views 3-1
Token Errors 3-35
Token Ring Module 3-30
Station Errors 2-20
Stations 2-20, 3-41
STE Span Mode 3-10, 3-12
Supported Firmware Revisions 1-3
T
Target Segment 3-10, 3-12
TCP/IP
Based Networks xii
Threshold 3-41
Token 3-40
Errors 3-20
Ring
Isolating Errors Table 3-32
Non-Isolating Errors Table
View 3-34
Station Table
View 3-28
Token Errors 3-35
Token Ring ConÞguration View 3-15
Token Ring Device
Model Information View 3-1
Token Ring Device Model Information
View 3-25
Token Ring Ring ConÞguration view 3-18
Token Ring Security ConÞguration
view 3-18
Token Ring Station Alarm Thresholds Table
view 3-18
Token Ring Station Detail View 3-38
Total 3-40
Allowed Stations 3-22
Totals Button 3-31
Trademarks i
Index
5
T (Continued)
Trap Table
Application (SPMA) 3-7
U
Unknown 3-26
Un-Sort Button 3-21, 3-30
Update
Button 3-21, 3-31
Update button
Interface ConÞguration Table 3-5
Update button (Source Route Bridge
ConÞguration) 3-10
Utilities 2-13, 2-15, 2-16, 2-20
V
Value When
Orange 3-26
Red 3-26
Yellow 3-26
Virus Disclaimer i
Y
Yellow 3-26
Index
6
TRBMIM
Management Module Guide