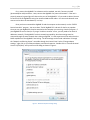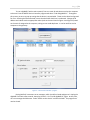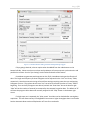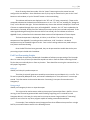
1
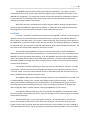
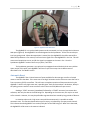
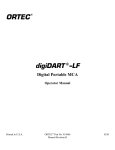
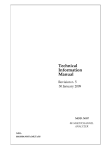
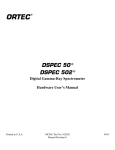
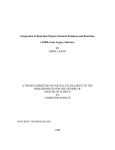
Page |1
User Manual
Introduction
The digiBASE-E is ORTEC’s latest in a line of small endcaps that provide all the electronics
required to acquire spectral data from a sodium iodide detector. Powered by Power-over-Ethernet
(PoE), which also provides all communications with the computer, these soda-can-sized devices greatly
simplify the detector setup.
A powerful feature of the digiBASE-E is its list mode. This does not produce a familiar spectrum,
but a time stamped list of events as experienced by the detector. This list can then be used to generate
those familiar spectra for any arbitrary time span during acquisition. This allows coordination with other
data types such as video or accelerometer data without manual start-stop control at acquisition time.
CraneWow is a program designed to facilitate the gathering of list mode data, providing easy
access to options and information relevant to list mode acquisition. Calibration is best handled using
conventional spectral software (MAESTRO/GammaVision); once an instrument has been calibrated, the
voltage can be toggled within CraneWow.
CraneWow can generate text-based histograms while collecting data (on-the-fly) which can be
opened by programs like Excel and Notepad. The data file recorded from the digiBASE-E data stream
can be processed after acquisition by a number of supplementary Perl scripts, including histogram
generation and conversion to other formats. These scripts require Perl version 5.14.2 or greater.
Installation and Use
Initial Steps
Install the latest Connections-32 software from ORTEC. This software should come with the
digiBASE-E hardware. Once this has been completed, CraneWow.exe can be placed anywhere on the
hard drive. Please be aware that a “data” folder will be created in the same location as the CraneWow
executable. The Perl scripts should be placed in a handy location, as they will be copied and moved
frequently by the user.
The first step in using the digiBASE-E with the CraneWow program is to properly connect them
to the network, and to each other.
The digiBASE-E uses Power over Ethernet (PoE) connections for both the voltage required for
the detector and for communications. This uses the familiar cat5-e cables with 8P8C connectors found
in most wired computer networks. The power must be supplied by some sort of injector, which uses
two of the ethernet wires as DC power; this can be either a single port injector, or by a router/switch
that supplies multiple ports.
Page |2
First, connect the digiBASE-E to a detector with a standard, two-inch, fourteen-pin PMT
(photomultiplier tube) connector. Next, connect the digiBASE-E to power and network. If the unit is
properly powered, a green light will show on the port of the digiBASE-E. If sync mode is desired, be sure
to connect all of the digiBASE-Es using the miniature SMA coaxial cables. Port A on each detector must
connect to Port B on the next detector, in a loop.
Once you have connected the digiBASE-Es and the computer to the network, run the “ORTEC
Device Controller” program. You must select “find all digiBASE-Es” and wait for the list to populate.
Once you see your digiBASE-Es listed as attached to the computer you are using, close the program. If
your digiBASE-Es are not listed, or if you get “unable to connect” errors, you may need to set static IP
addresses manually. The digiBASE-E has basic networking capability, but these settings must be
accessed through the same network that is being configured. It is the experience of the author that the
DHCP capabilities of the digiBASE-E are lacking. The IPv4 settings can be found in Windows 7 through
the “Network and Sharing Center” accessible through the Control Panel. Select “Change adapter
settings,” right click on your Ethernet adapter, and select Properties. Double click on “Internet Protocol
Version 4 (TCP/IPv4)” and you will see the dialog as shown in Figure 1.
Figure 1 - Windows TCP/IPv4 settings dialog.
Page |3
To use a digiBASE-E with a static network, first set a static IP and subnet mask to the computer
to be used. Run the ORTEC Device Controller program and select “Find all digiBASE-Es”. Throughout
this process, errors may pop up stating that the device is unreachable. These can be closed and ignored
for now. Selecting the device desired, ensure that the DHCP check box is unselected. Change the IP
address and subnet mask to appropriate values (such as the ones listed in Figure 1 and Figure 2) based
on the static IP assigned to the computer, taking care to avoid duplicates. It can be useful to set the
computer as the gateway.
Figure 2 - "Ortec Device Controller" program.
Hitting SAVE will cause more error messages, which should be closed and ignored. Unplug the
digiBASE-E and wait a few seconds, then plug it back in. Hit “Find all digiBASE-Es” again. At this point,
no error message should be seen. Select “Attach to this device” and then hit SAVE. The program can
now be closed.
Page |4
Figure 3 - "MCB Configuration" program.
Once the detectors are connected and the digiBASE-Es are attached to the computer, you must
construct the master detector list. This is done with the “MCB Configuration” utility from ORTEC (Figure
3). The program will take some time to generate the list. Once it has been generated, you may need to
renumber the detectors, as overlapping numbers are not permitted. Simply click the “Renumber All”
button to automatically assign unique numbers to each detector. The numbers themselves are not
important to the functionality of CraneWow, but other programs may use them to refer to detectors,
whether in the program itself or in file names. Thus, it may be worthwhile to note the numbers. If MCB
Configuration contains duplicate entries for each detector on the list, simply proceed as normal. This is
a known occurrence and does not impact the actual function of the software.
Please note that CraneWow does not have an easy way to perform energy calibration for a
detector. If the digiBASE-Es are not properly calibrated for the detectors to which they are attached,
this should be done using the MAESTRO or GammaVision software included with the Connections-32
package supplied by ORTEC.
Page |5
CraneWow
Figure 4 - CraneWow Master Box.
Once this has been completed, run CraneWow. You will see a small window with three options
(Figure 4). Selecting the check box to “save sum histo” will cause summed histograms of all detectors to
be saved on-the-fly, in addition to any individual on-the-fly histograms. Select “spawn” to spawn a main
CraneWow detector window.
Figure 5 - CraneWow Detector Window, unselected.
Page |6
There are many options and indicators in the CraneWow detector window (Figure 5). The first
step is to choose a detector from the drop-down at the top. You will see in this drop-down a full
detector list identical to the one recently created with MCB Configuration. Once you have selected a
detector, information including the serial number and status will appear in the window (Figure 6).
Figure 6 - CraneWow Detector Window, selected.
Figure 6 shows the detector window for a digiBASE-E titled “Small”. The List Mode and high
voltage are both off, as indicated by the check boxes to the right. Make sure your detector is in List
Mode and has high voltage turned ON with the associated check boxes (Figure 7). The program will
automatically suggest a file name beginner based on your detector name. If another filename is desired,
enter it in the box given. The description can be edited by changing the description and hitting SEND.
Note that when this is done, any commands typed into the command window will also be sent. A
selection of these commands is included in this manual, and a complete list is available in the ORTEC
digiBASE-E manual.
Page |7
Figure 7 - CraneWow Detector Dialog, List Mode and High Voltage engaged.
If Sync gating is desired, select an option other than NONE from the radio buttons on the
bottom left side. Please note that more than one SyncMaster will cause uncertain synchronization and
possible loss of data. See the “Sync Gating” section below for details of this feature.
CraneWow can generate text histograms on-the-fly for immediate viewing and verification of
data. The length and frequency of these histograms can be adjusted via the “size” and “every” fields,
respectively. Note that uncertain timing will result from settings requiring more than one overlapping
histogram at a time. Thus, please do not have “size” set to less than twice the value of “every” before
beginning. If no on-the-fly histograms are desired, uncheck the “Save Histo” box at the bottom right.
“Max” will set the number of seconds (as measured by the computer) to gather data. The default of “0”
will have the program collect data until manually stopped via the “Stop” button in the bottom right
corner.
If a high count rate is expected, the “allow resets” check box can be checked after starting data
acquisition. This will allow recovery if the digiBASE-E encounters a higher throughput than it can handle.
See the Automatic Reset section of Explanation of Terms for more details.
Page |8
Once all settings have been made, click the “spawn” button again on the master box and
configure the next detector. Once all detectors are set, they may be started one-by-one via the “start”
button on each window, or by the “StartAll” button on the master dialog.
The realtime and livetime are displayed in the “RT” and “LT” boxes, respectively. These can be
compared to determine the dead time of the detector as it runs. The “HT” box, standing for “Histogram
Time,” can be found to the right. This box should be very close to the realtime as displayed. The RT and
LT boxes are updated through direct query of the digiBASE-E. However, the “HT” box is updated as the
data stream is retrieved, directly from the realtime time stamps as they are read and interpreted. If this
value lags behind significantly (more than one half of one second), this can indicate an imminent
digiBASE-E crash, as described in the Automatic Reset section of the Explanations of Terms chapter.
The board temperature is displayed, in Celsius, in the BT box. The maximum operating
temperature of the digiBASE-E, according to the manufacturer, is 60 °C ambient – the board
temperature may be somewhat higher than this. Fans or other cooling solutions may need to be put
into place to avoid overheating.
Once the DAT files have been generated, they can be processed into usable data via the postprocessing scripts included with CraneWow.
Perl Post-Processing Scripts
A number of scripts are provided with CraneWow to facilitate post-processing of the list mode
data. For ease of use, these scripts should be copied into and run from the folder containing the DAT
file, but they can technically be run from any location. These should be run using the command line, as
they require arguments.
ticker.pl
USAGE: perl ticker.pl input.dat output.csv
The ticker.pl script will generate a second-by-second count rate and deposit it in a .csv file. This
file can be opened by Notepad or Excel, and contains ordered pairs of “time,count rate” in counts per
second. This information can be used to determine “interesting” time spans for extraction with
histogram.pl.
histogram.pl
USAGE: perl histogram.pl times.csv input.dat output
This script can be used to extract arbitrary time spans of spectral data from a .dat file. Prior to
running, a text file must be generated with each line being “beginning,end” in seconds for each
histogram desired. In this way, the script can be run once to extract a large number of “interesting”
spectra for use in Excel or any other program capable of reading comma-delineated data.
For example, if one wished to extract histograms from three different time spans from a single
DAT file, one would create a text file in the following format:
Page |9
12,15
30,80
100,150
22,93
If this file is saved as interesting.txt, with the DAT file named Monday.dat, one would copy these
files and the scripts into the same folder, then run the following command:
perl histogram.pl interesting.txt Monday.dat MondayHisto
This would create four histograms, named in the manner MondayHisto(12,15).csv. These could
be opened in Excel or a text editor, and analyzed as needed.
dat2n42.pl
USAGE: perl dat2n42.pl input1.dat input2.dat …
The N42 format is an XML-based data format standard defined by ANSII. While it does not have
the capability for true list mode, it can accommodate a series of time stamped, short duration spectra.
Spectrum analysis programs are able to interpret these files, calculating count rates and summing across
time spans. Another advantage is that all detectors’ data is contained within the same file as separate
spectra.
The dat2n42.pl script will take, as arguments, all the .dat files one wishes to combine. It is
advisable to only include .dat files that are of the same general time span, and have different file names.
The “detectors” will be named as the file names.
Note that since N42 is XML, the files are text. This means that files can be quite large
(uncompressed). A four-hour, three-detector file, for example, runs about 12 MB on disk. The script
uses 1 second intervals as standard, but this can be changed within the script via the $interval variable.
While running, the script will display the latest interval number recorded (by default, this is equivalent
to seconds).
Please note that the script output will have the same file name for each run. Thus, it is
important to rename or move the output (PleaseRenameMe.n42) prior to running another conversion.
Explanations of Terms
Gain Stabilization
The energy calibration of gamma detectors is usually done in a controlled setting, with known
sources, soon after setup and activation. In stable laboratory conditions, this can be quite steadfast and
provide reliable data and isotope identification. However, with rather long collection times or outdoor
weather, the temperature of the detector/PMT may change significantly enough to cause the gain to
apparently shift.
P a g e | 10
The digiBASE-E has the inherent ability to provide gain stabilization. This requires a known,
stable peak on which to fix. As this peak’s position changes, the gain is adjusted automatically by the
digiBASE-E to compensate. This means that a source must be close enough for the detector to register.
In some cases the 40K from background is used. In both cases, one must remember to subtract the
stabilizer peaks from the data in any analysis.
While there are Conn commands that can adjust the gain stabilizer settings, this adjustment is
best done with the MAESTRO or GammaVision software. In PHA mode, these programs employ peak
fitting algorithms to accurately define the peak on which stabilization will occur.
List Mode
List mode is a powerful, yet difficult to use feature of the digiBASE-E. With it, an entire length of
detector time can be recorded and later recreated for analysis. Essentially, each radiation detection
event is given its own time stamp. This results in a data stream that, after processing, allows spectra to
be produced for any arbitrary section of time that was recorded. The following explanation is intended
for advanced users, who may wish to view and understand the binary data of the DAT file manually. The
rest of this section may be safely skipped by the majority of users.
The list mode of the digiBASE-E has certain peculiarities that require careful consideration.
While each event has a time stamp associated with it, it is not possible to use “true” time stamps at the
digiBASE-E’s level of precision without looping. Thus, the digiBASE-E data stream also contains regular,
“large” time stamps that are able to cover much longer time spans. The time stamp included with the
data word is added to the larger time stamp, and this gives the real time of the event compared to the
startup time of the device.
For example, a data word indicating an event may contain a timestamp for 218 ticks, or 17440
nanoseconds. To reconstruct the data to within 80 nanoseconds, one would look at the most recent
“real time” stamp. If this time stamp indicates 32 ticks, or 320 milliseconds, then the final time for the
event is 0.320001744 seconds after acquisition start.
The digiBASE-E data words are delivered to the computer via the “GetRawData” command. This
is indistinguishable, normally, from a regular pulse-height analysis (PHA) mode signal. In the first
channel, the number of subsequent four-byte words that are in the 2048-word long signal is stored.
Only 2047 words can be retrieved with each pull. This must be taken into account, as failing to poll
often enough will result in a buffer overflow, causing the digiBASE-E to crash entirely.
There are four different word types that can be found in the digiBASE-E list mode data stream.
Each one includes a two-bit flag in bits 30-31. Care must be taken to not include the flag in the numbers
extracted from the words.
The zeroth data type is a sync pulse signal time stamp. Care must be taken as the real time
portion of the stamp, found at bits 12-0, will reset every 80 stamps. This means that the sync time
stamps roll over every 8 seconds. Note that the time stamp is in units of 100ms, such that a reading of
“10” would equal one second. The remaining bits are a prescale in the units of 80ns that can be used to
P a g e | 11
pinpoint the sync pulse in relation to the digiBASE-Es own clock. See the Sync Gating section of
Explanations of Terms for more details.
The first data type is a live time stamp. This is given in 10ms ticks. While this will trigger with
the same regularity as a real time stamp (every 10 milliseconds), it will eventually lag behind the real
time as the detector experiences dead time. The live time stamp accompanies a real time stamp and
represents the live time at that instant. While 10ms may not be a very precise unit over the course of a
few milliseconds, the precision will be sufficient after usual capture times of one second or more.
The second data type is a real time stamp. It, too, is a tick count updated every 10ms. This
simply counts the time since data acquisition was engaged for the digiBASE-E. Note that the real time
and live time stamps will not trigger at the very beginning of the data stream. That is, there will not be
any real time or live time stamps reading zero time.
The third and final data type is an actual event, or “ADC word”. It includes a “memory routing
bit” at bit 29. Bits 28-17 contain the channel number, or energy bin, that the event is attached to. The
remaining bits contain a prescale time stamp in units of 80ns. This is the number of ticks since the last
real time stamp, and can pinpoint the event’s time in the data stream. When recreating spectra, this
represents one count in the energy bin listed. Counting all the ADC words of a given channel in a span of
time will allow construction of a familiar spectrum.
Sync Gating
The digiBASE-E is able to synchronize with other digiBASE-Es via a sync pulse. This
synchronization does not cause their clocks to be identical; rather, it inserts a synchronization signal into
the list mode data stream. This is useful because over long periods, the internal clocks may diverge.
While this divergence is quite small, it may be significant to coincidence experiments or other well-timed
data collection.
P a g e | 12
Figure 8 - digiBASE-E with SMA cables.
The digiBASE-Es in a synchronized system must be connected, in a loop, through their miniature
SMA ports (Figure 8). One digiBASE-E must be designated as the SyncMaster. All the rest must be put
into Sync gating mode. When data acquisition is started, the Sync digiBASE-Es should be started first.
When the SyncMaster is first started, it will send out a signal to the next digiBASE-E in the line. This will
cause actual acquisition to start, and for the signal to propagate to the next in line. Once the
SyncMaster digiBASE-E receives the first sync pulse, it will start.
The SyncMaster generates a sync pulse to be propagated around the daisy-chain every 100ms.
Upon receipt of this pulse, each digiBASE-E will insert a sync time stamp into its data stream as
described in the “List Mode” section.
Automatic Reset
The digiBASE-E has a limited amount of space available for data storage, as well as a limited
means to transmit that data. If the event rate is too high, limitations such as these can cause the first-infirst-out memory (FIFO) to overflow. This will cause a complete cessation of data transmission by the
digiBASE-E. While a very high count rate is possible given “back-of-the-envelope” calculations, delays in
the polling process cause the count rate limit to be in the area of 20,000 counts per second.
Sending a “STOP” command, immediately followed by a “START” command, can restart data
collection, with only the data in the FIFO being lost. Depending on the event rate, this may be as much
as five seconds. However, this may be preferable to greater data loss caused by long periods of idleness.
In situations when such a high count rate could be encountered, it is possible to enable
automatic reset. This function detects when a poll is empty, as indicated by an empty zeroth channel.
This indicates that the digiBASE-E has crashed, likely due to the FIFO being full. When this is detected,
the digiBASE-E will be reset in the manner indicated.
P a g e | 13
The reset code will also attempt to keep the realtime and livetime counters accurate. A counter
is kept by the computer, and when the digiBASE-E is reset, the live time will be restored, and the real
time will be reset to the value held by the computer. While this is not ideal, it will guard against a slow,
continuous decay of the real time due to many resets.
The option must be set after beginning acquisition to avoid false resets at the beginning of the
startup process. When first started, the digiBASE-E may report no data at first. This can cause a string
of resets to happen right at the beginning, and throw off the timing information stored in the DAT file.
Troubleshooting
Data file is empty, save header
If the data file is empty other than the header, acquisition may be stopping before any data can
accrue. Send the SHOW_LIVE_PRESET and SHOW_TRUE_PRESET commands, checking that they are set
to zero. (Recall that the last three characters are a checksum for the response, including the dollar code
– a response of zero will have 075 as its checksum). If these are both set to zero and the data file is still
empty, restart the device by unplugging the PoE connection, waiting a few seconds, and plugging it back
in.
Also make sure the digiBASE-E is in LIST mode. If the first channel in PHA mode is zero, the LIST
mode parser will interpret that to mean zero words of available data. Check the mode indicator and
ensure the List Mode checkbox is checked.
Data file contains timestamps but no data
If the data file is receiving timestamps but no ADC data, it can indicate that the digiBASE-E is not
receiving counts from the detector. Check the count rate indicator. If it is zero (or very close), the high
voltage may be off.
If the count rate indicator shows counts, the discriminators may be set such that no data is
recorded. Check the lower and upper level discriminators using MAESTRO/GammaVision.
Program updates seem to lag/HT lags at low count rate
If the CraneWow program seems to be taking longer than roughly one second to update the
status of each digiBASE-E, or if the HT reading of one or more digiBASE-Es lags significantly behind the
RT reading, there may be an issue with proper seating of the Ethernet connectors. This can be tested
more thoroughly by running each detector individually in MAESTRO or GammaVision. If a digiBASE-E is
connected properly, the slow growth of the spectrum will be smooth in animation. If there is a problem
with the way the connectors are seated, this can cause network instability which will manifest most
clearly as “jumpy” spectrum growth.
P a g e | 14
Hard drive full
CraneWow will crash if the hard drive is completely filled. There is no danger to the data
already recorded, but data gathered by the digiBASE-E subsequent to the crash will not be recorded.
Ensure that there is enough space. A few gigabytes has been sufficient for hours of data in field testing.
High or highly variable count rate
If there is an unusually high count rate, or if count rates seem to spike randomly, there may be a
grounding issue. Many detectors, especially the larger ones, need to have the 14th pin grounded to the
case to ensure proper function. Usually, these grounding issues may shift or split peaks, and frequently
cause many false hits in the very low energy bins. Try grounding the 14th pin to the detector case.