1
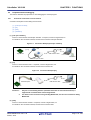
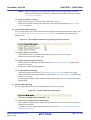
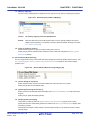
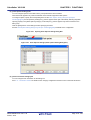
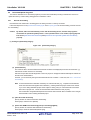
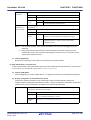
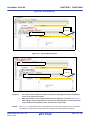
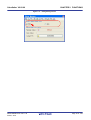
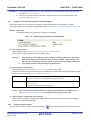
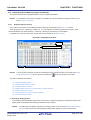
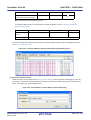
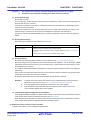
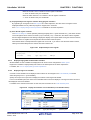
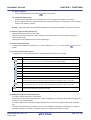
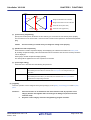
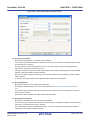
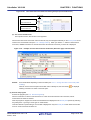
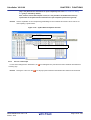
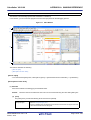
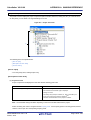
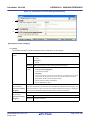
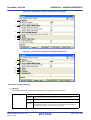
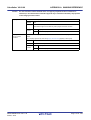
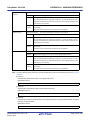
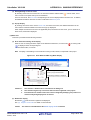
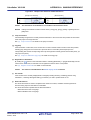
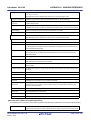
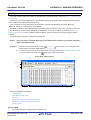
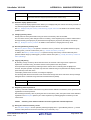
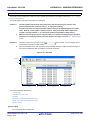
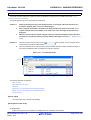
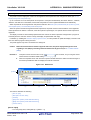
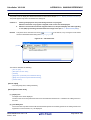
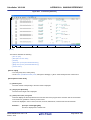
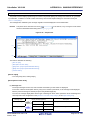
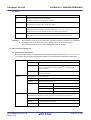
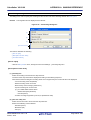
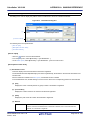
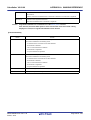
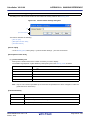
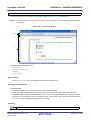
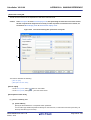
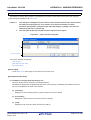
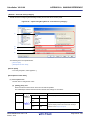
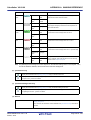
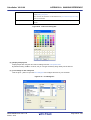
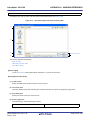
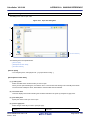
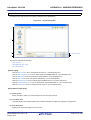
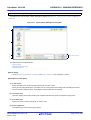
CubeSuite+ V2.02.00
APPENDIX A WINDOW REFERENCE
Trace panel
This panel is used to display trace data recording the execution history of the program (see "2.12 Collect Execution
History of Programs").
The trace data displays by mixing the disassembled text and source text by default, but it is also possible to display
either one of these by selecting the Display mode.
After the execution of the program is stopped, the display position is automatically updated such that the latest trace
data is displayed.
This panel appears only when connected to the debug tool.
Caution
[Full-spec emulator][E1][E20]
When trace data has been collected after selecting [all core] in the [Trace target setting] property in
the [trace] category on the [Debug Tool Settings] tab of the Property panel, this panel displays the
trace data regarding a core (PEn) by switching selection between the target cores (see "2.7 Select
a Core (PE)").
Remarks 1.
When the separator line of each area in this panel is double-clicked, the width of the area changes to
the shortest possible size that can display the contents of the area.
2.
This panel can be zoomed in and out by
in the tool bar, or by moving the mouse
wheel forward or backward while holding down the [Ctrl] key.
Figure A-36. Trace Panel [Full-spec emulator][E1][E20]
(1)
(3)
(4)
(5)
(7)
(8)
(9)
[Toolbar]
R20UT2866EJ0100 Rev.1.00
Feb 01, 2014
Page 254 of 353