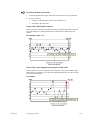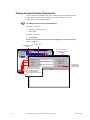
1
GE Fanuc Automation CIMPLICITY® Monitoring and Control Products CIMPLICITY Statistical Process Control Operation Manual GFK-1413E December 2000 GFL-005 Following is a list of documentation icons: Warning notices are used to emphasize that hazardous voltages, currents, temperatures, or other conditions that could cause personal injury exist in the equipment or may be associated with its use. Caution provides information when careful attention must be taken in order to avoid damaging results. Important flags important information. To do calls attention to a procedure. Note calls attention to information that is especially significant to understanding and operating the equipment or software. Tip provides a suggestion. Guide provides additional directions for selected topics. This document is based on information available at the time of publication. While efforts have been made to be accurate, the information contained herein does not purport to cover all details or variations in hardware or software, not to provide for every possible contingency in connection with installation, operation, or maintenance. Features may be described herein which are not present in all hardware and software systems. GE Fanuc Automation assumes no obligation of notice to holders of this document with respect to changes subsequently made. GE Fanuc Automation makes no representation of warranty, expressed, implied, or statutory with respect to, and assumes no responsibility for the accuracy, completeness, sufficiency, or usefulness of the information contained herein. No warranties of merchantability or fitness for purpose shall apply. CIMPLICITY is a registered trademark of GE Fanuc Automation North America, Inc. Windows NT, Windows 2000 and Windows 98 are registered trademarks of Microsoft Corporation This manual was produced using Doc-To-Help®, by WexTech Systems, Inc. Copyright 2000 GE Fanuc Automation North America, Inc. All rights reserved Preface Content of this Manual This manual is composed of the sections described below. Chapter 1. Introducing Statistic Process Control: Describes the SPC features. Chapter 2. SPC Overview: Describes how SPC operates, provides illustrations of the chart types and suggested reading for additional information on statistical process control. Chapter 3. SPC Data Source Overview: Discusses the SPC data source and its configuration. Chapter 4. Configuring SPC Data: Provides instruction on configuring SPC data using abundant graphics to enhance the procedures. Chapter 5. Configuring SPC Charts: Describes the available options for creating SPC ActiveX controls. Chapter 6. Using SPC Charts: Describes the runtime options for SPC ActiveX controls. Appendix A. Table of Constants for Control Charts Appendix B. X-Individual Chart Calculations Appendix C. XBar-R Chart Calculations Appendix D. XBar-S Chart Calculations Appendix E. Histogram Calculations Appendix F. P Chart Calculations Appendix G. nP Chart Calculations Appendix H. C Chart Calculations Appendix I. U Chart Calculations Appendix J. Upgrading Quality Charts to Enhanced SPC Charts GFK-1413E iii Related Publications For more information about CIMPLICITY HMI software, refer to these publications: CIMPLICITY Base System User's Manual (GFK-1180) CIMPLICITY CimEdit Operation Manual (GFK-1396) iv CIMPLICITY SPC Operation Manual-December 2000 GFK-1413E Contents Introducing Statistical Process Control 1-1 Welcome to Statistical Process Control ................................................................................. 1-1 About the CIMPLICITY HMI SPC Option ........................................................................... 1-2 SPC Features............................................................................................................ 1-3 SPC Components ..................................................................................................... 1-3 Upgrade Old SPC Charts........................................................................................................ 1-4 Quick Start: Install and Configure the SPC Option................................................................ 1-5 SPC Overview 2-1 SPC Analysis.......................................................................................................................... 2-1 Suggested Readings ................................................................................................. 2-2 SPC Operation Overview ....................................................................................................... 2-3 SPC Chart types ..................................................................................................................... 2-4 SPC Data Source Overview 3-1 SPC Data Source .................................................................................................................... 3-1 Configuring SPC Data 4-1 Introduction............................................................................................................................ 4-1 Overview of Data Configuration Steps................................................................................... 4-2 SPC Document ....................................................................................................................... 4-4 Opening a New Document ....................................................................................... 4-4 Defining Document Properties................................................................................. 4-7 Products.................................................................................................................................. 4-9 Adding a New Product............................................................................................. 4-9 Defining Product Properties................................................................................... 4-10 Variable Quality Characteristics........................................................................................... 4-11 Adding a New Variable Quality Characteristic...................................................... 4-12 Specifying a Variable's General Characteristics..................................................... 4-12 Defining a Variable's Collection Characteristics.................................................... 4-16 Setting Limits for Variable Quality Characteristics ............................................... 4-21 Setting Alarms for Variable Quality Characteristics .............................................. 4-29 Criteria for Variable Control Tests ........................................................................ 4-31 SPC Control Test Exclusion Mode ...................................................................................... 4-36 Attribute Quality Characteristics .......................................................................................... 4-39 Adding a New Attribute Quality Characteristic ..................................................... 4-40 Specifying an Attribute’s General Characteristics ................................................. 4-41 Defining an Attribute’s Collection Characteristics................................................. 4-42 Setting Limits for Attribute Quality Characteristics............................................... 4-48 Setting Alarms for Attribute Quality Characteristics ............................................. 4-56 Criteria for Attribute Control Tests........................................................................ 4-58 ActiveX ................................................................................................................................ 4-64 GFK-1413D-1 v Defect Folders ...................................................................................................................... 4-65 Adding a New Defect Group.................................................................................. 4-65 Defining Defect Folder Properties ......................................................................... 4-66 Defect Quality Characteristics.............................................................................................. 4-68 Adding a New Defect Category ............................................................................. 4-68 Specifying a Defect Category's General Characteristics ........................................ 4-69 Defining Defect Category Collection Properties.................................................... 4-70 SPC Administration Alarms ................................................................................................. 4-73 Document Tools ................................................................................................................... 4-74 Document Tree....................................................................................................... 4-74 Changing Display Attributes .................................................................................. 4-76 Finding a Product/Quality Characteristic ............................................................... 4-78 Configuring SPC Charts 5-1 Getting Started........................................................................................................................ 5-1 Creating an SPC Chart in CimEdit ......................................................................................... 5-1 Configuring SPC Chart Properties ......................................................................................... 5-3 General Properties.................................................................................................... 5-4 Chart Properties ....................................................................................................... 5-5 Line Properties ......................................................................................................... 5-7 Axis Properties......................................................................................................... 5-8 Bar Chart Properties................................................................................................. 5-9 Report Properties ................................................................................................... 5-10 Creating an SPC Chart in a Web Page ................................................................................. 5-11 Changing the Date/Time Format on Charts .......................................................................... 5-11 ActiveX Methods and Properties.......................................................................................... 5-12 ActiveX Properties:................................................................................................ 5-13 Using SPC Charts 6-1 Runtime Functions.................................................................................................................. 6-1 Displaying Test Results .......................................................................................................... 6-2 Manual Data Entry ................................................................................................................. 6-3 Variable QC Data..................................................................................................... 6-3 Attribute QC Data .................................................................................................... 6-4 Defect QC Data........................................................................................................ 6-6 Appendix A - Tables of Constants for Control Charts A-1 XBar and R Chart Factors for Control Limits ....................................................................... A-1 XBar and S Chart Factors for Control Limits........................................................................ A-2 Appendix B - X-Individual Chart Calculations B-1 X-Individual Chart Calculations............................................................................................ B-1 X-Individual Center Line ........................................................................................ B-1 X-Individual Standard Deviation ............................................................................ B-1 Appendix C - XBar-R Chart Calculations C-1 XBar-R Chart Calculations.....................................................................................................C-1 XBar-R Chart Center Line .......................................................................................C-1 XBar-R Chart Control Limits...................................................................................C-1 R Chart Center Line .................................................................................................C-2 R Chart Control Limits.............................................................................................C-2 vi CIMPLICITY SPC Operation Manual-December 2000 GFK-1413E Appendix D - XBar-S Chart Calculations D-1 XBar-S Chart Calculations.................................................................................................... D-1 XBar-S Chart Center Line....................................................................................... D-1 XBar-S Chart Control Limits .................................................................................. D-2 S Chart Center Line................................................................................................. D-2 S Chart Control Limits ............................................................................................ D-2 Appendix E - Histogram Chart Calculations E-1 Histogram Chart Calculations ................................................................................................E-1 Capability Index.......................................................................................................E-1 Capability Index for Process Centering ...................................................................E-2 Appendix F - P Chart Calculations F-1 P Chart Calculations............................................................................................................... F-1 Data Available ......................................................................................................... F-1 Center Line and Control Limits ............................................................................... F-2 Appendix G - nP Chart Calculations G-1 nP Chart Calculations............................................................................................................ G-1 Data Available ........................................................................................................ G-1 Center Line and Control Limits .............................................................................. G-1 Appendix H - C Chart Calculations H-1 C Chart Calculations ............................................................................................................. H-1 Data Available ........................................................................................................ H-1 Center Line and Control Limits .............................................................................. H-1 Appendix I - U Chart Calculations I-1 U Chart Calculations ............................................................................................................... I-1 Data Available .......................................................................................................... I-1 Center Line and Control Limits ................................................................................ I-2 Appendix J – Upgrading Quality Charts to Enhanced SPC Charts J-1 Upgrade Quality Charts to Enhanced SPC Charts...................................................................J-1 Starting the Upgrade Procedure ................................................................................J-2 What Happens during the Upgrade Procedure? ........................................................J-2 GFK-1413E Glossary of Terms i Index v Contents vii Glossary of Terms Attribute Data The qualitative data that can be counted for recording and analysis. Attribute data is usually gathered in the form of nonconforming units. The units are analyzed by P, nP, C and U control charts. Attribute Quality Characteristic A distinguishing feature of a process or its output on which attribute data can be collected. Average The sum of values divided by the number, or sample size, of values. This is usually designated by a bar over the symbol for the values being averaged. The most common averages in SPC are: X The average of values within a subgroup. X The average of subgroup averages (also called the process average) R The average of subgroup ranges. Central Line The line on the control chart that represents the average value of the items being plotted. Characteristic A distinguishing feature of a process on which variable data can be collected. Control Chart A graphic representation of a characteristic of a process. It shows the plotted values of data for the characteristic, a central line and one or two control limits. GFK-1413D-1 i Control Limit A line, or lines, on a control chart used as a basis for judging the stability of a process. Control limits are calculated from process data. Defect Data Defect data consists of a defect code and a count of the number of units that contain that defect. It is possible for a unit to contain more than one defect. Defect data is displayed in a Pareto chart which ranks the defects by number of occurrences. Defect Quality Characteristic For CIMPLICITY SPC, a Defect Quality Characteristic defines the collection of defect categories be used for defect data for a Pareto chart. Other terms for Defect Quality Characteristic are Defect QC or defect data. Document For CIMPLICITY SPC, a document is a collection of products for which you are going to collect and analyze variable quality characteristics and defect data. Mean See Average. Median The middle value of a group of measurements when they are arranged in order from lowest to highest. The median is not an average. Observation An observation is a single instance of data. Pareto Chart A chart that ranks all potential problem areas according to their contribution to the total variation. Typically, a few causes account for most of the variation. In CIMPLICITY SPC, the contents of a Defects folder contain the data displayed in a Pareto chart. Process Capability The total range of a stable process's inherent variation. For variable data: The process's inherent capability is defined as The capability index for a stable process is ii CIMPLICITY SPC Operation Manual-April 2000 6σ R / d 2 C PK GFK-1413D-1 Process Spread The extent to which the distribution of individual values of the process characteristic vary. This is often shown as the process average plus or minus some number of standard deviations. For example: X ± 3σ Product For CIMPLICITY SPC, a product is the entity for which you want to collect Variable quality characteristics or Defect data for analysis Range The difference between the lowest and highest values in a subgroup. Run A consecutive number of points consistently increasing or decreasing or above or below the central line. Sigma The Greek letter - σ - used to designate a standard deviation. Special Cause A source of variation that is intermittent and often unpredictable. Sometimes called an assignable cause, it is signaled by a point beyond the control limits, a run, or other non-random pattern of points within the control limits. Standard Deviation A measure of the spread of the process output. Subgroup A subgroup is a set of one or more observations that are used to calculate a point on an SPC chart. Another term for a subgroup is a sample. Variable Data Variable data consists of measurable parameters such as weight, temperature, or length. Variable Quality Characteristic For CIMPLICITY SPC a Variable Quality Characteristic is a measurable parameter such as weight, temperature or length. Other terms for Variable Quality Characteristic are Variable QC or variable data. GFK-1413D-1 Glossary iii Introducing Statistical Process Control Welcome to Statistical Process Control Welcome to Statistical Process Control (SPC), CIMPLICITY’s state-of-the-art option for supporting a successful quality control program! SPC enhances your ability to manage a quality control program by addressing the four major phases of quality control: Measurement Analysis Improvement Control CIMPLICITY SPC supports your quality control program by enabling you to: collect substantial amounts of accurate data. convert data into meaningful information. use information to change your process and increase quality. monitor your process on a continuous basis. react to runtime information. maintain consistent quality levels. SPC is built on and fully integrated with the CIMPLICITY HMI family of products. As with all CIMPLICITY products, SPC runs in a Windows-based environment enabling flexibility for multiple users and a familiar platform that decreases the learning curve. GFK-1413E 1-1 About the CIMPLICITY HMI SPC Option The CIMPLICITY HMI SPC option provides you with the industry-standard set of statistical tools that enable you to analyze data and convert it into useful information. CIMPLICITY HMI SPC is capable of collecting and analyzing data 24-hours a day, providing critical information about potential quality problems using the alarming feature. This enables you to make improvements to your quality program, and allows you to monitor changes and verify results. CIMPLICITY HMI SPC provides you with the following types of charts and printed reports for analyzing your process data: Variable Characteristics Attribute Characteristics Bar R p XBar S nP X Individual c Histogram u Defects Pareto Based on Microsoft's design standards, CIMPLICITY SPC charts are designed as OCX control objects, so that they are easily added to your CimView screens. Note: This manual is not intended to provide instruction on CIMPLICITY HMI or your Windows operating system, and it is assumed that users have a working knowledge of both software products. Please refer to the documentation that originally came with your software for questions about CIMPLICITY and Microsoft Windows. 1-2 CIMPLICITY SPC Operation Manual–December 2000 GFK-1413E SPC Features The SPC option comes complete with a host of exciting features. Major features include: Live data viewing from ActiveX containers such as CimView screens and Internet Explorer. Easy scalability from a simple workstation to Client-Server configurations. Generation of CIMPLICITY HMI alarms for out-of-control conditions. This means in addition to displaying out-of-control conditions on SPC charts, you can display alarms for them in the Alarm Viewer, log them to an Alarm Log Printer, and log them via the Database Logger. Centralized configuration that allows for the creation and maintenance of all the various characteristics and specification limits for your process, even though your charts may cross over several CimView screens on your HMI system. XBar-R, X-Individual, XBar-S, and Histogram charts for variable quality characteristics. p, nP, c and u charts for attribute quality characteristics. Pareto charts for defect analysis. Tabular reports that let you view numeric data in table format. High quality printing directly from the SPC ActiveX control. Both logged and runtime Point data collection. Access to changing values for sample sizes, control limits and auto recalculation during runtime. Manual data entry through a dialog in the SPC ActiveX control. Calculated data stored in a database via ODBC that lets you use standard database tools for such things as exporting data, reporting and maintenance. SPC Components The SPC option consists of the following three components: GFK-1413E SPC Data Collector: Process that runs in the background and collects data, performs analysis, alarms out-of-control conditions and writes calculated data to the database based on your configuration. A new enhanced feature of SPC is the ability to analyze attribute data and store the resulting data in a database for further processing. SPC Group Configuration: Graphical User Interface that enables you to configure the quality characteristics and defect categories to be analyzed. The latest addition to the Interface is the ability to configure attribute characteristics. SPC ActiveX Control: ActiveX control that can be embedded in an ActiveX container, such as a CimEdit/CimView screen or Internet Explorer. This enables you to view the data analyzed by the SPC Data Collector through various charts and reports. Also, you can perform such functions as manually entering data, printing, displaying charts, and setting up an ODBC data source. Introducing Statistical Process Control 1-3 Upgrade Old SPC Charts You will be required to upgrade your existing SPC charts if they meet one of the following conditions: The charts were created prior to CIMPLICITY HMI v3.1 The charts were created using CIMPLICITY HMI v3.1, but you did not purchase and install the Enhanced SPC software (IC646NSP000A) prior to making them. Note: When attempting to view a screen containing an old SPC chart, an error message will display indicating that the charts must be upgraded. See “Upgrading Quality Charts to Enhanced SPC Charts” for information on upgrading SPC charts. 1-4 CIMPLICITY SPC Operation Manual–December 2000 GFK-1413E Quick Start: Install and Configure the SPC Option Before you can begin to use the powerful features offered by the SPC option, make sure the option is installed on all computers where you want to collect or view SPC data. Installing the SPC option is quick and easy using your original installation CD for CIMPLICITY HMI. To install the SPC option: 1. Place the installation CD in the CD-ROM drive. 2. The CD will AutoPlay—OR—from the Windows desktop, press Start>Run. Type d:\setup.bat (where d is the CD-ROM drive) and click OK. 3. Select Install CIMPLICITY HMI from the menu. 4. Proceed to the CIMPLICITY HMI Setup dialog box. 5. Click the Review/Add Options radio button. 6. Click Next to display the HMI Server Options dialog box—see figure. 1. Click Applications Options box. Clear all other boxes in the Components group. 2. Click SPC Charts box. Clear all other boxes in the Options group. 3. Click Next. GFK-1413E 7. Check the Application Options box. 8. Check the SPC Charts box. 9. Clear all other boxes in the Components group. Introducing Statistical Process Control 1-5 10. Click Next to proceed with installation. 11. Restart your computer once the SPC option has been installed. To configure SPC: 1. Configure an ODBC data source. A default Microsoft Access database called CIMPLICITY SPC is automatically created when you install SPC. You only need to change or reconfigure this if you want to use a data source other than Microsoft Access. 2. Configure SPC data collection as follows: a. Open your project in the Workbench. b. Click Project on the menu bar. c. Select Properties to open the Project Properties dialog box. d. Check the SPC Charts and Database Logger boxes in the Options group. e. Click OK. Result: The Database Logger and SPC applets display in the project directory—see figure. Database Logger applet displays. SPC applet displays. f. 3. Double-click the SPC applet and configure an SPC document. For complete instructions, see “Configuring SPC Data." Run your project. Result: SPC data collection automatically starts. 1-6 CIMPLICITY SPC Operation Manual–December 2000 GFK-1413E 4. Configure an SPC chart(s). For complete instructions see, "Configuring SPC Charts." a. Insert the CIMPLICITY SPC Control in an ActiveX container, such as a CimEdit screen or Internet Explorer. b. Edit the chart properties; click the General tab and do the following: c. Browse for and select the SPC document. Select the product to be displayed. Select one of the configured QCs (variable, attribute or defect) for the product. Select the chart type for the display. Select the chart duration. Click the Chart tab and do the following: Select the type of chart to be displayed. If you selected Show most recent values on the General tab, enter the update interval. Note: Other chart properties are configured for your convenience. You may use these default properties or tailor them to your application. GFK-1413E Introducing Statistical Process Control 1-7 SPC Overview SPC Analysis SPC uses statistical methods to determine whether processes are within required limits. While CIMPLICITY HMI's normal alarm functions detect when individual Points actually exceed limits, SPC analysis can provide early warning by detecting undesirable systematic variations in your process. This can help you pinpoint process, machine, operator, or material problems so that actions can be taken to diagnose and resolve the problem. CIMPLICITY SPC uses an SPC ActiveX control that supports: XBar-R, XBar-S, X-Individual and Histogram charts for analyzing variable data. p, nP, c, and u charts for analyzing attribute data. Pareto charts for analyzing defect data. The data is retrieved from ODBC logging, analyzed according to the standard SPC calculations for the chart, and displayed graphically by populating configured charts with the result. This ActiveX control can be used in CimEdit/CimView screens or other applications, like Internet Explorer that supports ActiveX controls. The SPC variable charts display values between -4 sigma (-4 σ ) and +4 sigma (+4 σ ). Data outside of this range is not displayed, but it is still used in the chart calculations. GFK-1413E 2-1 Suggested Readings This manual shows you how to use the SPC option available for CIMPLICITY HMI. To acquire additional information about SPC, please consult one of the many SPC publications that are currently available. Suggested publications are: Easy as SPC, Perry Johnson, Inc., 1986 Statistical Quality Control Handbook, Western Electric Co., Inc., 1959 Quality Control and Industrial Statistics, Charbonneau and Webster, 1978 Introduction to Statistical Quality Control, Montgomery, 1985 Statistical Process Control, Chrysler Corporation, Ford Motor Company and General Motors Corporation, 1995 Professional groups that publish manuals and booklets about SPC are the: 2-2 American National Standards Institute American Society for Quality Control American Society for Testing and Materials CIMPLICITY SPC Operation Manual–December 2000 GFK-1413E SPC Operation Overview CIMPLICITY HMI performs a series of functions in order to provide you with information through the SPC option. The following process supports SPC—see figure: SPC Configuration tells the Data Collector how and from where to collect the data. The Data Collector gathers CIMPLICITY Point, ODBC and manual entry data, performs its required calculations and stores the results in the SPC ODBC data source. The SPC ActiveX control displays the data from the SPC ODBC data source. It can also send manual entry data back to the Data Collector for processing. SPC Configuration Process Data from CIMPLICITY Points & ODBC Tables Configuration Data SPC ActiveX Control Manual Data Entry Data Collector SPC Data SPC ODBC Data Source Configuration Data Configuration Data SPC Configuration Files GFK-1413E SPC Overview 2-3 SPC Chart types You can use the SPC ActiveX control to display charts for variable, attribute or defect data. Data can also be displayed in report format. The SPC ActiveX Control can display the following types of charts and reports: Variable Data Attribute Data Defect Data Reports X-Individual chart p chart Pareto chart Sample Report XBar-R chart nP chart XBar-S chart c chart Histogram u chart In general, a control chart consists of a center line corresponding to the average value at which the quality characteristic should perform, and lines corresponding to the upper and lower control limits for the characteristic. The upper and lower control limits are also referred to as the upper and lower three-sigma control limits. X-Individual Chart The X-Individual chart is sometimes called a pre-control chart. This type of chart is used to determine the stability of the center of the process. The control limits are calculated by determining the standard deviation of the sample population. The formulas for calculating the standard deviation and control limits are detailed in Appendix B. The following is an example of an X-Individual chart that was created using SPC ActiveX Control: 2-4 CIMPLICITY SPC Operation Manual–December 2000 GFK-1413E XBar-R Chart The XBar-R chart displays two charts, one for the XBar values and the other for the Range values. The formulas for calculating the center lines and control limits for the XBar-R control chart are detailed in Appendix C. The following is an example of an XBar-R chart created using SPC ActiveX Control: XBar-S Chart The XBar-S chart displays two charts, one for the XBar values and the other for the Sigma values. The formulas for calculating the center lines and control limits for the XBar-S control chart are detailed in Appendix D. The following is an example of an XBar-S chart created using SPC ActiveX Control: GFK-1413E SPC Overview 2-5 Histogram The Histogram shows you the distribution, the central tendency and the scatter or variability of the sample data, and calculates process capability. The formulas for calculating process capability from the Histogram chart are detailed in Appendix E. The following is an example of a Histogram created using SPC ActiveX Control: 2-6 CIMPLICITY SPC Operation Manual–December 2000 GFK-1413E P Chart The P chart measures the proportion of nonconforming (discrepant or defective) items in a group of items being inspected. Proportion is defined as the ratio of the number of nonconforming items in a population to the total number of items in that population. Sample sizes do not have to be equal. The following is an example of a P chart created using SPC ActiveX Control: GFK-1413E SPC Overview 2-7 nP Chart The nP chart measures the number of nonconforming items in an inspection lot. It is identical to p chart except that the actual number of nonconforming items is plotted, rather than their proportion of the sample. The inspection sample sizes must be equal in this case. The following is an example of an nP chart created using SPC ActiveX Control: 2-8 CIMPLICITY SPC Operation Manual–December 2000 GFK-1413E C Chart The C chart measures the number of nonconforming items (discrepancies or defects) in an inspection lot. The C chart requires a constant sample size. The following is an example of a C chart created using SPC ActiveX Control: U Chart The U chart measures the number of nonconforming items per inspection unit in subgroups, which can have varying sample sizes. It is similar to C chart except that the number of nonconforming items is expressed on a per unit basis. The following is an example of a C chart created using SPC ActiveX Control: GFK-1413E SPC Overview 2-9 Pareto Charts The Pareto chart displays the data for the defect categories and quantities you define for a defect folder. The following is an example of a Pareto chart created using SPC ActiveX Control: 2-10 CIMPLICITY SPC Operation Manual–December 2000 GFK-1413E Reports You can display and print data from the SPC ActiveX control for each type of SPC chart. The following is an example of a report created using SPC ActiveX Control: GFK-1413E SPC Overview 2-11 SPC Data Source Overview SPC Data Source SPC automatically creates a default Microsoft Access data source for you called CIMPLICITY SPC. New SPC documents will use this data source by default. You have the option of creating your own data source using another database such as SQL Server or Oracle, if you want better performance or if you want to share the same data source across a network. All the SPC documents in a CIMPLICITY HMI project must log their data to the same SPC data source. You can share an SPC data source between projects, or you can create a data source for each project. See the CIMPLICITY HMI Base System User's Manual, GFK-1180, for detailed instructions on creating custom data sources for Microsoft Access, SQL Server and Oracle. Note: The SPC data source must be a System data source. GFK-1413E 3-1 Configuring SPC Data Introduction SPC offers several data collection types, including using Points to track the quality of variables and attributes, and the frequency of defects. You can also implement several types of control tests, the results of which can be displayed on XBar-R or XBar-S chart sets for variables, and p, nP, c and u chart sets for attributes. With this in mind, begin configuring your SPC application(s) considering which factors will be needed to support your quality control program. Consider the following: Who will use SPC and in what manner. Configure SPC for users who: will have SPC on a server and will be able to configure SPC data. will have a runtime version and will make runtime decisions. What products SPC will be tracking for data. Which variables are to be monitored for quality, for example Widget_length. In order to keep data management under control, begin with a few of the most critical variables. This will prevent you from becoming overwhelmed by too much information. Also, avoid collecting data too frequently. Which attributes require monitoring for quality. Again, select only the most critical attributes when you first begin. Which defects for each product need to be tracked, for example Color_too_light. Important: The SPC Data Collector logs its raw and calculated data to an ODBC data source. Before you start configuring SPC for a project, make sure that the CIMPLICITY Database Logger is installed and configured for the project. GFK-1413E 4-1 Overview of Data Configuration Steps In order to configure SPC to collect, analyze and display statistical data, follow the steps outlined below. Detailed procedures for each for each of the steps are provided in this chapter. Step One. Add and Configure an SPC Document The SPC document is the container for all of the products that are to be grouped together. The products' variables, attributes and defects are stored here in a directory structure similar to Windows Explorer. The properties that you specify for your document will impact all of its included products. For example, the designated ODBC data source will store data calculated from the SPC Data Collector for all the products included in the document. Step Two. Add and Configure Products The product is the main container for the type of data that you will choose to collect and analyze. Initially you will provide a name, description and resource ID for your product. Step Three. Add and Configure Variable Quality Characteristics Specify the variables you want to measure for each product. For each variable, indicate the following information: Description (for example, Widget_Length) Collection characteristics Limits Alarms Calculation Type For each variable that you add, a histogram is automatically generated by SPC. In addition you can select between the following chart types: XBar-R chart set to view the range between the highest and lowest point in a sample. This range is relatively efficient for small subgroup sample sizes (especially below 9). Although it provides you with a spread, it does not give you a clear indication of where the points fall relative to your control limits. XBar-S chart sets to review the average of the standard deviations. This is a more efficient indicator of process variability, especially with larger sample sizes. However, it is less sensitive in detecting special causes of variation that result in only a single value in a subgroup to be unusual. From "Statistical Process Control,” Chrysler Corporation, Ford Motor Company and General Motors Corporation, 1995 4-2 CIMPLICITY SPC Operation Manual–December 2000 GFK-1413E Step Four. Add and Configure Attribute Quality Characteristics Specify the attributes you want to measure for each product. For each attribute, indicate the following information: Description (for example Color_Light) Collection characteristics Limits Alarms Calculation Type In addition you can select from among the following chart types: p chart set measures the proportion of nonconforming (discrepant or defective) items in a group of units being inspected. Proportion is defined as the ratio of the number of nonconforming items in a population to the total number of units in that population. Sample sizes need not be equal. nP chart set measures the number of nonconforming units in an inspection lot. It is identical to p chart, except that the actual number of nonconforming units, rather than their proportion of the sample are plotted. The inspection sample sizes must be equal in this case. c chart measures the number of nonconforming units (discrepancies or defects) in an inspection lot. The c chart requires a constant sample size. u chart measures the number of nonconforming items per inspection unit subgroups, which can have varying sample sizes. It is similar to c chart, except that the number of nonconforming units is expressed on a per unit basis. Step Five. Add and Configure Defect Categories Specify the defects that are to be tracked for each product. For each defect, indicate the following information: Defect Description Scope (for example, if you want to use the same data source for multiple defects) Collection characteristics Measurement—SPC generates Pareto charts by default Note: If you already know the control limits for a process, simply enter them. If not, for example because the process is new, use SPC auto recalculation to calculate control limits for variables and attributes. When you are satisfied with the calculated limits, enter the calculated limits and disable SPC auto recalculation. GFK-1413E Configuring SPC Data 4-3 SPC Document Software configuration for SPC begins with opening and configuring an SPC document. The SPC document is the container for one or more products that you will add and configure. When the document is active, every included product will be tracked, unless you deactivate tracking for one or more of the products at the product level. See "Defining Product Properties.” Opening a New Document To open an SPC document: 1. Open your project in the Workbench. 2. Double-click on the SPC Configuration applet in the project directory. Result: The first time you double-click the SPC Configuration applet, a new document will open with one Products folder displayed in the directory. All related products, and their accompanying variables, attributes and defects will be placed in this main Products folder—see figure. Start from the Workbench in the project directory. Result: The SPC Configuration window displays with the main Products folder created in the directory. Double-click the SPC applet. Note: More than one document can exist in a project. 4-4 CIMPLICITY SPC Operation Manual–December 2000 GFK-1413E To create additional documents: 1. Click File on the menu bar. 2. Select New. 3. Select SPC Configuration Document from the pullout menu. Result: A new SPC configuration window will display. SPC documents are numbered consecutively—see figure. 1. Click File on the menu bar. 3. Select SPC Configuration Document. 2. Select New. Result: A new document will open. SPC documents are numbered consecutively. Important: You must use the same data source for all SPC documents created in a project. To build directory hierarchy: As you build your configuration, you add a hierarchy of subfolders to the Products main folder, as follows: GFK-1413E 1. Within the Products main folder, a subfolder for each product included in the document. 2. Within each Product subfolder are the following: Variable QC item for each variable that will be tracked for that product and displayed on an XBar-R or XBar-S chart. Attribute QC item for each attribute that will be tracked for that product and display on an p, nP, c or u chart. Configuring SPC Data 4-5 4-6 Defect folder for each group of defects that will be tracked for a product and displayed on one Pareto chart. Included are all the defect categories that will be displayed as a bar on the group's Pareto chart. CIMPLICITY SPC Operation Manual–December 2000 GFK-1413E Defining Document Properties The SPC document is the primary container for your quality control information. You can set its properties to: activate or deactivate data collection for every included product. specify basic parameters including the: logged update interval in seconds. ODBC data source. limit user access. To define Document properties: 1. Click File on the menu bar of the document window. 2. Select Properties to display the Document Properties dialog box—see figure. 3. The Active box is checked by default to activate data collection for the document; clear to disable option. Note that the Database Logger must be configured for the project to enable the SPC Data Collector. 1. Click File on the menu bar. 3. Checked by default to activate data collection for every included product. Clear box to deactivate. 4. Designate the ODBC data source using the drop-down list. 5. Time in seconds to retrieve raw data when using logged data. 2. Select Properties. 7. Type a password for logging into the database. 6. Type a user name for logging into the database. GFK-1413E Configuring SPC Data 4-7 4. In the Log update interval in seconds field, type an integer to define the frequency in seconds raw data will be retrieved from the database when using logged data as input. 5. Use the default ODBC data source, or select a different data source from the dropdown list. 6. In the Database user field, type a name for logging into the ODBC data source. 7. In the Password field, type a password for logging into the ODBC data source. Note: SPC creates and uses a default data source called CIMPLICITY SPC. This default data source is an Access (*.mdb) file called SPC.mdb. It is stored in the ARC subdirectory of where you installed CIMPLICITY (Usually C:\CIMPLICITY\HMI\ARC). 4-8 CIMPLICITY SPC Operation Manual–December 2000 GFK-1413E Products After you define the basic parameters for your document, you can add the products that will be included in the group. To do this, create a folder for each product. The Product folder will be a subfolder of the main Products folder. Adding a New Product Add a new product to SPC by creating a new product folder—see figure below. To create a Product folder: Method 1 – File menu 1. Click File on the menu bar. 2. Select New. 3. Select Product from the pullout menu. Method 2 – Popup menu 1. Select the Products folder. 2. Right-click and select New Product from the popup menu. Result: Using either method, the Product Properties dialog box opens. GFK-1413E Configuring SPC Data 4-9 Defining Product Properties The Product Properties dialog box is where you identify each product that is added to the document by designating the following—see figure: Data collection (activate or deactivate) Product name Description Resource ID To specify Product properties: 1. The Active box is checked by default to activate data collection for the product; clear to disable option. Note that the Document must also be active for collection. 2. In the Product name field, type a name for the product folder. 3. Optionally type a Description. 4. In the Resource ID field, indicate the resource to be used by alarms generated for this product as follows: Click or to browse for an existing resource in the Select a Resource dialog box, Click to designate a New Resource. Popup Browse 4-10 CIMPLICITY SPC Operation Manual–December 2000 GFK-1413E Variable Quality Characteristics Once you have created a new product, define the variables to be tracked for each. Information that you enter in the Variable Quality Control Characteristics dialog box is used to configure a detailed Histogram and either an XBar-R or XBar-S chart set. Use the Variable Quality Characteristics Properties dialog box to create and define characteristics as follows: General characteristicsincluding the name of the characteristic; whether or not data is to be collected for the characteristic; whether you want to use an XBar-S or XBar-R chart set; the subgroup size and gap size. Collection characteristicsspecifies the data collection method. Limitssets control and specification limits. Alarmsindicates alarming and control tests to be performed on the data. Caution: If you enter specific values during configuration and an inconsistency is detected, SPC will display an error message. You cannot save the configured data until the error is corrected. Example You select Values to enter a variable's control limits and enter 25 for an Upper Control Limit and 50 for a Lower Control Limit. SPC will display the following error message, “The upper control limit must be greater than the center line and the center line must be greater than the lower control limit.” Note: If you use Points for general characteristics on limits rather than specific values, SPC will alert the user when the values become specific at runtime. If SPC detects configuration inconsistencies, it will display an $SPC_ADMIN_ALARM in the Alarm Viewer. See "SPC Administration Alarms.” GFK-1413E Configuring SPC Data 4-11 Adding a New Variable Quality Characteristic To add a Variable Quality Characteristic, do one of the following: Method 1 – File menu 1. Expand the Products folder and select the product. 2. Click File on the menu bar. 3. Select New. 4. Select Variable Quality Characteristic from the pullout menu. Method 2 – Popup menu 1. Expand the Products folder and select the product. 2. Right-click and select New Variable Quality Characteristic from the popup menu. Result: Using either method, the Variable Quality Characteristics Properties dialog box opens, with the General tab displayed—see figure. New Variable Quality Characteristic - example of right-click method 1. Expand the main Products folder. 2. Right-click on the Product in the directory. 3. Select New Variable Quality Characteristic from the popup menu. Result: The Variable Quality Characteristic Properties dialog box displays on the General tab. Note: When you create a new characteristic, SPC calls it VAR in the document tree. If there is more than one variable that you have not named, SPC numbers them in the order they were created and lists the description you input in the General tab of the Properties dialog box. You can rename the variable at any time in the directory. Specifying a Variable's General Characteristics Begin configuring a new variable by defining its general characteristics using the General tab of the Variable Quality Characteristics Properties dialog box. Enter the following information: 1. 4-12 A description of the variable. CIMPLICITY SPC Operation Manual–December 2000 GFK-1413E 2. Whether it will have an XBar-R or XBar-S chart set. 3. Sampling parameters including: whether the sample parameters will be based on Points or specific values. subgroup sample size. gap size. To specify general characteristics: 1. Click the General tab—see figure. 2. The Active box is checked by default to activate data collection for the product; clear to disable option. Note that the Document must also be active for collection Variable Properties dialog-General tab Browse Popup 3. Type a Description for the variable, which will display in the directory. 4. Select XBar-R or XBar-S chart set from the Calculation type drop-down list. 5. If you want to use the current XBar-R or S value elsewhere in your project, or download them to a device, indicate the floating-point array Point of two (2) elements in the Setpoint ID field. The array contains numbers for XBar and range or XBar and standard deviation. Do one of the following: 6. Click to browse for an existing Point in the Select a Point dialog box, or Click to designate a New Point. Click Values or Points to specify the sampling parameters—see next sections for details. Using Points to Specify Sampling Parameters You can use Points to specify sampling parameters as described below. When you use Points, values can be changed at runtime—see figure. To specify Points as sampling parameters: GFK-1413E 1. In the Sampling Parameters group, click Points radio button. 2. Select a Point to indicate the Subgroup size. Note that the same size can be changed at runtime. Do one of the following: Configuring SPC Data 4-13 2. 4-14 Click to browse for an existing Point in the Select a Point dialog box, or Click to designate a New Point. Select a Point to indicate the Gap size; that is, how many units will be skipped before the next sample is taken, as follows: Click to browse for an existing Point in the Select a Point dialog box, or Click to designate a New Point. CIMPLICITY SPC Operation Manual–December 2000 GFK-1413E Using Values to Specify Sampling Parameters You can use Values to specify sampling parameters as described below—see figure. To specify Values as sampling parameters: GFK-1413E 1. In the Sampling Parameters group, click the Values radio button. 2. Type a value for the Subgroup size (sample size). 3. Type a value for the Gap size; that is, how many units will be skipped before the next sample is taken. Configuring SPC Data 4-15 Defining a Variable's Collection Characteristics Define SPC's collection method and the source of the variable input data using the Collection tab in the Variable Quality Characteristic Properties dialog box. Collection methods include: Automatic Data Collection: either Point, Logged or None. The type selected will activate corresponding fields in the dialog box. When you use an Automatic Collection method, you can also use: the same data source for multiple attributes (Match Point) a batch process (Batch Point ID or Batch Column ID) 4-16 Point Data Collection: one or more CIMPLICITY Points are specified, along with start and end indices for array Points, and any engineering unit conversion (default). Logged Data Collection: retrieves data from an ODBC database table. Define the ODBC data source, table and column names. None: specify whether or not manual entry will be allowed. Manual entry can be allowed for any type of data collection you choose. SPC automatically includes manual entry when you select None. Select this option to prevent automatic data collection. CIMPLICITY SPC Operation Manual–December 2000 GFK-1413E Point Collection for a Variable You can designate Points for data collection using the Collection tab of the Variable Quality Characteristics Properties dialog box. Here, the scope of the collection can also be specified. To specify Points for data collection: 1. Click the Collection tab. 2. Click the Point radio button—see figure. 3. Identify the Point ID (data source) from which the SPC Data Collector retrieves data. The Point ID cannot have a Text type. Do one of the following: Click to browse for an existing Point in the Select a Point dialog box, or Click to designate a New Point. 4. When using any array, specify the number where SPC should begin to collect values in the Start element field. Note that the default is 0. 5. When using any array, specify the number where SPC should finish to collect values in the End element field. Note that the default is 0. 6. Check the EU conversion box if the SPC Data Collector is to use the EU value(s) for the Point. Clear if the SPC Data Collector should use the raw value(s) for the Point Variable-Collection Properties-Point GFK-1413E Configuring SPC Data 4-17 7. 8. Select a Point to indicate the Match Point ID (numeric Point only) in order to use the same data source that is identified by the Point ID for multiple variables. Do one of the following: Click to browse for an existing Point in the Select a Point dialog box, or Click to designate a New Point. In the Match value field, enter the value to be matched against the Match Point ID to determine whether the collected data applies to this specific variable quality characteristic. For example, the collected Point ID (data source) may be used to measure a variable (for example, length) for several products (Product 1, Product 2, Product 3). You can enter a Match Point ID value of 1 to measure length for Product 1, and 2 to measure length for Product 2. 9. If this is a batch process, select a Batch Point ID. This will allow you to distinguish between different batches for the same Product Quality Characteristic. The value of the Batch Point is associated with the calculated data and can be used as search criteria for charts and reports. Do one of the following: Click to browse for an existing Point in the Select a Point dialog box, or Click to designate a New Point. 10. Check the Manual entry allowed box to enable manual data entry for SPC chart sets at runtime; clear to disable option. Variable-Collection Properties-Point 4-18 CIMPLICITY SPC Operation Manual–December 2000 GFK-1413E Logged Collection for a Variable If you select Logged, SPC retrieves data from an ODBC database table that has already been updated by CIMPLICITY HMI. Define logged collection in the Variable Quality Characteristics Properties dialog box. Note: SPC logs all of its data. Therefore, the Logged option is not necessary for saving data. It refers to using an additional data source for input. The Point collection method is more efficient. To specify Logged for data collection: 1. Click the Collection tab—see figure. 2. Click the Logged radio button. 3. Use the ODBC data source drop-down list to select the name of the database from which SPC will retrieve data. Variable-Collection Properties-Logged GFK-1413E 4. In the Database user field, type a name for the user when logging into the ODBC data source. 5. In the Password field, type a password for the user when logging into the ODBC data source. Configuring SPC Data 4-19 6. Click to browse for the Table ID where data is located. 7. Click to browse for the Column ID where data is located. 8. Check the Manual entry allowed box to enable manual data entry for SPC chart sets at runtime; clear to disable option. No Collection for a Variable If you choose to enter your own data, do not designate a data collection source. To specify None for data collection: 1. Click the Collection tab. 2. Click the None radio button—see figure. Result: The Manual entry allowed box is checked by default to enable manual data entry. 4-20 CIMPLICITY SPC Operation Manual–December 2000 GFK-1413E Setting Limits for Variable Quality Characteristics Once you have defined the variable's general characteristics and collection methods, you are ready to set control limits for your XBar-R or XBar-S chart sets in the Variable Quality Characteristics Properties dialog box. Included are: Control limits, and Specification limits. Control Limits for a Variable In order to set control limits for your chart sets, SPC provides you with several different options. If you know the limits that you want to set, you can use Points or Values. If the process is new and you would like to have limits calculated automatically for you, you can use the auto recalculation features. Whatever your preference, SPC provides you with an option. You can specify values for control limits by: entering values, or using auto recalculation. You can enter values as: (specific) values. Points. Caution: If you enter specific values during configuration and SPC detects an inconsistency, it will display an error message and will not allow you to save the configuration until you correct the error. Example You select Values to enter a variable's control limits and enter 25 for an Upper Control Limit and 50 for a Lower Control Limit. SPC will display the following error message, "The upper control limit must be greater than the center line and the center line must be greater than the lower control limit." Note: If you use Points for general characteristics on limits rather than specific values, SPC will alert the user when the values become specific at runtime. If SPC detects configuration inconsistencies, it will display an $SPC_ADMIN_ALARM in the Alarm Viewer. See "SPC Administration Alarms." GFK-1413E Configuring SPC Data 4-21 SPC Auto Recalculation Feature One of the many advantages SPC offers is its ability to automatically calculate the control limits for a process. This particularly comes in handy if your process is new and you want the SPC program to generate control limits. SPC offers two options to automatically recalculate control limits: Auto recalculation: is used in place of Values or Points. Once the control limits are automatically calculated, select either Values or Points for the life of the process. Force Auto Recalc: is used in addition to Values or Points. This option provides the flexibility to reset control limits during runtime. As a result, when you send an application to production, you can have SPC recalculate the control limits so that they are accurate for the process. Once the control limits are automatically calculated, disable the Force Auto Recalc option. Important: The Quality Control rules you have always followed for control limits still apply to both SPC automatic recalculation options, as follows: 4-22 When your process is new or in optimum condition, calculate the limits using the Auto Recalculation or Force Auto Recalculation option. Once you determine that SPC has automatically collected enough data to calculate the correct control limits, disable the automatic calculation option. The calculated control limits are then used for the life of the process. Remember that the control limits produced by auto recalculation are valid only when your process is "in control." If you calculate them while your process is going "out of control," then the limits will be incorrect. CIMPLICITY SPC Operation Manual–December 2000 GFK-1413E Control Limits for (Specific) Values You can use your own criteria to set control limits using the Values option in the Limits tab of the Properties dialog box. Also, you can use the Force Auto Recalc feature to override limit values set in the dialog box. To specify Values for control limits: 1. Click the Limits tab. 2. Click the Values radio button—see figure below. 3. Enter the values for the XBar chart's control limits as follows: XBar UCL—Upper control limit. XBar CL—Center line. XBar LCL—Lower control limit. 4. Enter the values for the R or S chart's range or standard deviation as follows: R/S UCL—Upper control limit. R/S CL—Center line. R/S LCL—Lower control limit. 5. 6. If you want to use the current control limits elsewhere in your project, or download them to a device, indicate the floating-point array Point of six (6) elements in the Setpoint ID field. The Point contains six elements for all values to be set in the following order: XBar LCL, XBar CL, XBar UCL, R/S LCL, R/S CL, R/S UCL. Do one of the following: Click to browse for an existing Point in the Select a Point dialog box, or Click to designate a New Point. Indicate the Specification limits for Histogram analysis as follows: Lower – type the Lower Specification Limit (LSL). Upper – type the Upper Specification Limit (USL). GFK-1413E Configuring SPC Data 4-23 To use auto recalculation to set control limit values: In the Force auto recalc field, indicate the Boolean Point ID that has been created to override the value control limits at runtime. This feature can be configured to be turned on or off at runtime. Point On When the Point is on (set to TRUE), auto recalculation is activated and the XBar-R/S control limits are recalculated. Pre-set values are ignored. Point Off When the Point is off (set to FALSE), auto recalculation is deactivated and the last calculated values are used. Pre-set values are ignored until the data collector is restarted or dynamically refreshed. Do one of the following—see figure: Click to browse for an existing Point in the Select a Point dialog box, or Click to designate a New Point. Popup Browse Note: Whenever the Force Auto Recalc Point is set to either TRUE or FALSE, the data collector will drop the current sample and start fresh. 4-24 CIMPLICITY SPC Operation Manual–December 2000 GFK-1413E Points Control Limits In order to use Points to set control limit criteria, use the Points option in the Limits tab of the Properties dialog box. Also, you can use the Force Auto Recalc feature to set the Point values for control limits. To specify Points for control limits: 1. Click the Limits tab. 2. Click the Points radio button—see figure. 3. Enter the a different Point for the XBar UCL, CL and LCL control limits as follows: 4. 5. 6. Click to browse for an existing Point in the Select a Point dialog box, or Click to designate a New Point. Enter the a different Point for the R/S UCL, CL and LCL range or standard deviation as follows: Click to browse for an existing Point in the Select a Point dialog box, or Click to designate a New Point. If you want to use the current control limits elsewhere in your project, or download them to a device, indicate the floating-point array Point of six (6) elements in the Setpoint ID field. The Point contains six elements for all values to be set in the following order: XBar LCL, XBar CL, XBar UCL, R/S LCL, R/S CL, R/S UCL. Do one of the following: Click to browse for an existing Point in the Select a Point dialog box, or Click to designate a New Point. Indicate the Specification limits for Histogram analysis as follows: Lower – type the Lower Specification Limit (LSL). Upper – type the Upper Specification Limit (USL). GFK-1413E Configuring SPC Data 4-25 To use auto recalculation to set Point values: In the Force auto recalc field, indicate the Boolean Point ID that has been created to override the value control limits at runtime. This feature can be configured to be turned on or off at runtime. Point On When the Point is on (set to TRUE), auto recalculation is activated and the XBar-R/S control limits are recalculated. The data collector will set the control Points (specified in the dialog box fields) to the calculated values. Point Off When the Point is off (set to FALSE), auto recalculation is deactivated and the last calculated values are used until the control Points are updated. Do one of the following—see figure: Click to browse for an existing Point in the Select a Point dialog box, or Click to designate a New Point. Note: Whenever the Force Auto Recalc Point is set to either TRUE or FALSE, the data collector will drop the current sample and start fresh. 4-26 CIMPLICITY SPC Operation Manual–December 2000 GFK-1413E Auto Recalculation Control Limits In order to automatically set control limits for a new process, or when your process is in optimum condition, use the Auto Recalculation option. To use auto recalculation to automatically set values: 1. Click the Limits tab. 2. Click the Auto recalculation radio button—see figure. 3. If you want to use the current control limits elsewhere in your project, or download them to a device, indicate the floating-point array Point of six (6) elements in the Setpoint ID field. The Point contains six elements for all values to be set in the following order: XBar LCL, XBar CL, XBar UCL, R/S LCL, R/S CL, R/S UCL. Do one of the following: Click to browse for an existing Point in the Select a Point dialog box, or Click to designate a New Point. Variables Properties dialog-Limits tab-Auto Recalculation Option Popup Browse 4. In the Force auto recalc field, indicate the Boolean Point ID that has been created to override the value control limits at runtime. This feature can be configured to be turned on or off at runtime. Point On When the Point is on (set to TRUE), auto recalculation is activated and all previous values are ignored. Point Off When the Point is off (set to FALSE), auto recalculation is deactivated and the data collector continues to use the last calculated values. Once enough data has been collected to calculate valid control limits, deactivate auto recalculation and use Values or Points to set control limits for your process in the dialog box. Do one of the following: GFK-1413E Click to browse for an existing Point in the Select a Point dialog box, or Click to designate a New Point. Configuring SPC Data 4-27 5. Indicate the Specification limits for Histogram analysis as follows: Lower – type the Lower Specification Limit (LSL). Upper – type the Upper Specification Limit (USL). Note: Whenever the Force Auto Recalc Point is set to either TRUE or FALSE, the data collector will drop the current sample and start fresh. 4-28 CIMPLICITY SPC Operation Manual–December 2000 GFK-1413E Setting Alarms for Variable Quality Characteristics SPC can track several different types of occurrences to warn you if a process is slightly off, even if production has not exceeded its control limits on a regular basis. As a result, you can anticipate and handle potential problems before they occur. Use the Alarm tab in the Variable Quality Characteristics Properties box to specify the: type of alarm that will be triggered. Setpoint ID. control test criteria that will initiate alarms or change Setpoints. Alarms and Setpoints When one of the control tests meets your criteria for issuing a warning, it will generate the type of warning you configure, including: an alarm to alert operators. If alarms are generated for more than one control test, they will stack up and be deleted according to specifications you enter in the CIMPLICITY HMI Alarm Configuration. a Setpoint that will change to the number (1-8) of the XBar test that is in an alarm state. Setpoints provide you with a way to automate corrective action. You can write scripts that trigger the appropriate action whenever the criteria have been met for one of the control tests. The value of the Setpoint reflects the last test for which an alarm was triggered. To specify an alarm and Setpoint: 1. Click the Alarm tab—see figure. 2. You can select the $SPC_ALARM system Alarm ID, or you can create your own alarm in the Alarm ID field. Use the SPC_ALARM type when creating your own alarm. Do one of the following: Click to browse for an existing Point in the Select a Point dialog box, or Click to designate a New Point. The alarm message for SPC alarms consists of the following strings: GFK-1413E Document Name. Product Name. Quality/Defect Characteristic Name. A description of the control check that triggered the alarm. The value of the sample that triggered the alarm. Configuring SPC Data 4-29 3. In the Setpoint ID field, indicate a Point to be set when an SPC alarm occurs as follows: Click to browse for an existing Point in the Select a Point dialog box, or Click to designate a New Point. Check to enable alarming. Check boxes to activate control tests and indicate test criteria. 4-30 4. Check the Alarm enabled box to activate alarming for the variable; clear to disable option. 5. Proceed to next section, "Criteria for Variable Control Tests," for complete instructions and information about each of the available control test options. CIMPLICITY SPC Operation Manual–December 2000 GFK-1413E Criteria for Variable Control Tests SPC plots the averages of the samples you define on XBar charts in the XBar-R and XBar-S chart sets. It is the XBar charts that display the zone in which these averages fall. At runtime, each subgroup that meets one or more of the selected test criteria will be displayed with a special character (the default is a red asterisk). The following zones are used in these tests: Zone C is the area up to one standard deviation from the center line. Zone B is the area between one and two standard deviations from the center line. Zone A is the area between two and three standard deviations from the center line. Performing multiple control tests: In the Alarm tab of the Variable Quality Characteristics Properties dialog box, you can run multiple control tests on your data by checking the appropriate boxes. At runtime, each data value will be compared with all of the selected alarm conditions and plotted on your configured SPC chart. When you position your cursor over the red asterisk (default character), a detailed tool tip will display with the date, time, point value and failed test data, i.e. the control test number(s). Note: When you create a control chart, you can select samples for exclusion. See "SPC Control Test Exclusion Mode" for instructions. The following example depicts the standard: Zone Std. dev UCL Center Line LCL GFK-1413E Configuring SPC Data 4-31 To perform variable control tests: 1. Check the appropriate box in the Alarms tab for each of the tests to be performed. 2. View test results by: accessing a configured SPC chart to view runtime data, or configuring a new SPC chart. Control Test 1: One subgroup beyond upper or lower limits This test checks to see if any subgroups on the chart have a value greater than the upper control limit or less than the lower control limit. Subgroups that meet test criteria will be marked with a red asterisk. For example: Control Test 2: N subgroups in a row on same side of center line This test checks to see if N subgroups in a row are on the same side of the center line. The Nth subgroup and all following subgroups that meet the test criteria will be marked with a red asterisk. For example, if N=8: Control Test 3: N consecutive subgroups in a row all increasing or decreasing This test checks to see if N subgroups in a row are increasing in value or decreasing in value. The Nth subgroup and all following subgroups that meet the test criteria will be marked with a red asterisk. For example, if N=6: 4-32 CIMPLICITY SPC Operation Manual–December 2000 GFK-1413E Control Test 4: N subgroups in a row, alternating up and down This test checks to see if N subgroups in a row are alternately increasing in value then decreasing in value. The Nth subgroup and all following subgroups that meet the test criteria will be marked with a red asterisk. For example, if N=14: Control Test 5: M out of N subgroups in a row in Zone A or beyond (same side of center) This test checks to see if M out of N subgroups in a row on the same side of the center line are in Zone A or beyond. The Mth subgroup that meets the test criteria will be marked with a red asterisk. For example, if M=2 and N=3: GFK-1413E Configuring SPC Data 4-33 Control Test 6: M out of N subgroups in a row in Zone B or beyond (same side of center) This test checks to see if M out of N subgroups in a row on the same side of the center line are in Zone B or beyond. The Mth subgroup that meets the test criteria will be marked with a red asterisk. For example, if M=4 and N=5: Control Test 7: N subgroups in a row in Zone C, above or below center This test checks to see if N subgroups in a row lie in Zone C on either side of the center line. The Nth subgroup and all the following subgroups that meet the test criteria will be marked with a red asterisk. For example, if N=15: 4-34 CIMPLICITY SPC Operation Manual–December 2000 GFK-1413E Control Test 8: N subgroups in a row beyond Zone C, above or below center This test checks to see if N subgroups in a row lie beyond Zone C on either side of the center line. The Nth subgroup and all following subgroups that meet the test criteria will be marked with a red asterisk. For example, if N=8: GFK-1413E Configuring SPC Data 4-35 SPC Control Test Exclusion Mode A process must be in control when you determine the control limits for your process. However, when you calculate the control limits there may be some variation due to special causes, such as samples being taken when your machines are warming up. When there is this kind of variation, SPC exclusion mode allows you to manually select samples for exclusion from control limit calculation. Important: When calculating control limits, variation must be due to common causes only. Variation cannot be attributable to special causes or control limits are not valid. SPC Exclusion Mode is enabled on the following chart types: XBar-R nP XBar-S c p u The SPC exclusion process evolves as follows: 1. During runtime, when an SPC chart is on screen, the operator selects Exclusion Mode. An X appears at the top left of CimView, indicating that Exclusion Mode is active. 2. The operator selects the samples to exclude. 3. SPC automatically performs a recalculation based on the exclusions and updates the control limits displayed on the chart. To toggle SPC Exclusion Mode On/Off: SPC comes with two methods to toggle Exclusion Mode On/Off. Both methods are accessed through CimView when an SPC chart is on screen. Method 1 – Popup menu 1. Right-click on an SPC chart that is display on an SPC CimView screen. 2. Select Exclusion Mode from the popup menu—see figure. Result: Exclusion Mode is checked on the popup menu signifying the feature is active. Exclusion Mode 4-36 CIMPLICITY SPC Operation Manual–December 2000 GFK-1413E Method 2 – Double-click 1. Double-click the SPC chart to display the SPC Control Properties dialog box. 2. Click the Chart tab. 3. Check the Exclusion Mode box. Exclusion Mode Application Engineering Note: By using the ExclusionMode property, an applications engineer can create different ways to let an operator toggle exclusion mode on and off. Excluding/Returning Samples in Control Chart Calculation During runtime, when SPC is in Exclusion Mode, an operator can exclude one or more samples from calculation. An operator can also re-include samples. As soon as you toggle the exclusion state of a sample, SPC immediately recalculates the control limits displayed on the chart. The following symbols allow you to view exclusion status. X In the upper left-hand corner of the SPC control chart –Exclusion mode is on. Representing a sample–Sample is included in the calculation. X Representing a sample–Sample is excluded from calculation. To exclude samples from a control chart when SPC is in Exclusion Mode: Method 1 Click on a dot that represents the sample to toggle its exclusion state. Result: The dot will change to an X indicating that the sample is excluded—see figure. Method 2 1. GFK-1413E Click on a corner of the group of sample to be excluded. Configuring SPC Data 4-37 2. Drag the cursor over the entire groups of samples. Note that a box will appear around the selected samples. 3. Release the mouse button. Result: Each dot that represented an included sample changes to an X, indicating the sample is now excluded—see figure. Example of Excluding Bad Data From SPC Charts 1b 1a X 1a Four samples (1a) are beyond Zone A. The reason is explainable 1b An X indicates that SPC is in Exclusion Mode (1b). To exlude the samples: 2a X X Click each dot. Each dot changes to an X + or 2b Hold down the left mouse button. Draw a box around the samples. 2b 2a 3 3 Four Xs (3) represent the samples that are excluded from calculation. X Application Engineering Note: The GetControlLimits() ActiveX method provides access to the control limits displayed on the chart. 4-38 CIMPLICITY SPC Operation Manual–December 2000 GFK-1413E Attribute Quality Characteristics In additional to defining variable quality characteristics, you now have the option of the defining attribute quality characteristics for your product. SPC uses information that you enter in the Attribute Quality Characteristics Properties dialog box to configure in detail p, nP, c and u chart sets. Use the Attribute Quality Characteristics Properties dialog box to create and define characteristics as follows: General characteristicsincluding the name of the characteristic; whether or not data is to be collected for the attribute; whether you want to use a p, nP, c or u chart set. Collection characteristicsspecifies the data collection method. Limitssets control and specification limits. Alarmsindicates alarming and control tests to be performed on the data. Caution: If you enter specific values during configuration and an inconsistency is detected, SPC will display an error message. You cannot save the configured data until the error is corrected. Note: If you use Points for general characteristics on limits rather than specific values, SPC will alert the user when the values become specific at runtime. If SPC detects configuration inconsistencies, it will display an $SPC_ADMIN_ALARM in the Alarm Viewer. See "SPC Administration Alarms.” GFK-1413E Configuring SPC Data 4-39 Adding a New Attribute Quality Characteristic To add an Attribute Quality Characteristic, do one of the following: Method 1 – File menu 1. Expand the Products folder and select the product. 2. Click File on the menu bar. 3. Select New. 4. Select Attribute Quality Characteristic from the pullout menu. Method 2 – Popup menu 1. Expand the Products folder and select the product. 2. Right-click and select New Attribute Quality Characteristic from the popup menu. Result: Using both methods, the Attribute Quality Characteristic Properties dialog box opens with the General tab displayed—see figure. New Attribute Quality Characteristic - example of right-click method 2. Right-click 1. Expand the on the product main Products to display popup menu. folder. 3. Select New Attribute Quality Characteristic. Result: The Attribute Quality Characteristic Properties dialog box displays on the General tab. 4-40 CIMPLICITY SPC Operation Manual–December 2000 GFK-1413E Specifying an Attribute’s General Characteristics Begin configuring a new attribute by defining its general characteristics in the General tab of the Attributes Quality Characteristics Properties dialog box. To specify general characteristics: 1. Click the General tab—see figure. 2. Check Active box to activate data collection for the attribute; clear box to disable option. The Document and Product must also be active for collection. 3. Type a Description for the attribute that will be displayed in the directory. 4. Select from among p, nP, c and u chart sets from the Calculation type drop-down list. 5. If you want to use the current p, nP, c or u values elsewhere in your project, or download them to a device, indicate the floating-Point in the Setpoint ID field as follows: Click to browse for an existing Point in the Select a Point dialog box, or Click to designate a New Point. Note: Of the four available chart types, only one can be configured for a single product at a time. A maximum of four charts can be configured per product. Attributes Properties-General tab Browse Popup GFK-1413E Configuring SPC Data 4-41 Defining an Attribute’s Collection Characteristics Define the SPC collection method and the source of the attribute input data using the Collection tab in the Attribute Quality Characteristic Properties dialog box. Collection methods include: Automatic Data Collection: either Point, Logged or None. The type selected will activate corresponding fields in the dialog box. When you use an Automatic Collection method, you can also use: the same data source for multiple attributes (Match Point) a batch process (Batch Point ID or Batch Column ID) 4-42 Point Data Collection: one or more CIMPLICITY Points are specified, along with start and end indices for array Points, and any engineering unit conversion (default). Logged Data Collection: retrieves data from an ODBC database table. Define the ODBC data source, table and column names. None: specify whether or not manual entry will be allowed. Manual entry can be allowed for any type of data collection you choose. SPC automatically includes manual entry when you select None. Select this option to prevent automatic data collection. CIMPLICITY SPC Operation Manual–December 2000 GFK-1413E Point Collection for an Attribute You can designate Points for data collection using the Collection tab of the Attribute Quality Characteristics Properties dialog box. Here, the scope of the collection can also be specified. To specify Points for data collection: 1. Click the Collection tab. 2. In the Automatic data collection group, click the Point radio button—see figure. 3. Identify the Point ID (data source) from which the SPC Data Collector retrieves data. The Point ID cannot have a Text type. Do one of the following: Click to browse for an existing Point in the Select a Point dialog box, or Click to designate a New Point. 4. When using any array, specify the number where SPC should begin to collect values in the Start element field. Note that the default is 0. 5. When using any array, specify the number where SPC should finish collecting values in the End element field. Note that the default is 0. Attribute-Collection Properties-Point Popup Browse 6. GFK-1413E Select a Point to indicate the Match Point ID (numeric Point only) in order to use the same data source that is identified by the Point ID for multiple attributes. Do one of the following: Click to browse for an existing Point in the Select a Point dialog box, or Click to designate a New Point. 7. In the Match value field, enter the value to be matched against the Match Point ID to determine whether the collected data applies to this specific attribute quality characteristic. 8. If this is a batch process, select a Batch Point ID. This will allow you to distinguish between different batches for the same Product Quality Characteristic. The value of Configuring SPC Data 4-43 the Batch Point is associated with the calculated data and can be used as search criteria for charts and reports. Do one of the following: 9. Click to browse for an existing Point in the Select a Point dialog box, or Click to designate a New Point. Base Sampling parameters on Value or Point by clicking the appropriate radio button. 10. Indicate the Subgroup size (sample) as follows—see figure: a. If based on Value, type a value for the sample size, or b. If based on Point, do one of the following: Click to browse for an existing Point in the Select a Point dialog box, or Click to designate a New Point. Value option Point option Popup Browse 11. Check the Manual entry allowed box to enable manual data entry for SPC chart sets at runtime; clear to disable option. 12. Check the EU conversion box if the SPC Data Collector is to use the EU value(s) for the Point. Clear if the SPC Data Collector should use the raw value(s) for the Point 4-44 CIMPLICITY SPC Operation Manual–December 2000 GFK-1413E Logged Collection for an Attribute You can choose to use data logged for the attribute in the ODBC database table that is updated by CIMPLICITY HMI. Specify logged collection options using the Attribute Quality Characteristic Properties dialog box. To specify Logged for data collection: 1. Click the Collection tab. 2. Click the Logged radio button. 3. Use the ODBC data source drop-down list to select the name of the database from which SPC will retrieve data. 4. In the Database user field, type a name for the user when logging into the ODBC data source. Attributes-Collection Properties-Logged GFK-1413E 5. In the Password field, type a password for the user when logging into the ODBC data source. 6. Click to browse for the Table ID where data is located. 7. Click to browse for the Column ID where data is located. Configuring SPC Data 4-45 8. Click to browse column ID to match against when using the same data source for multiple attributes. 9. In the Match value field, enter a value (integer) to be matched against the Match Column ID to determine whether the collected data applies to this specific attribute quality characteristic. 10. If the process is a batch process, click to browse for the Batch Column ID that will allow you to distinguish between different batches for the same Product Quality Characteristic. The value of the Batch Point is associated with the calculated data and can be used as search criteria for charts and reports. 11. Indicate the Subgroup size as follows: Enter a numeric value, or Click to browse for the column where the subgroup size is located. 12. Check the Manual entry allowed box to enable manual data entry for SPC chart sets at runtime; clear to disable option. 4-46 CIMPLICITY SPC Operation Manual–December 2000 GFK-1413E No Collection for an Attribute If you choose to enter your own data, do not designate a data collection source. To specify None for data collection: 1. Click the Collection tab. 2. Click the None radio button. Result: The Manual entry allowed box is checked by default to enable manual data entry. GFK-1413E Configuring SPC Data 4-47 Setting Limits for Attribute Quality Characteristics Once you have defined the attribute’s general characteristics and collection methods, you are ready to set control limits for your p, nP, c and u chart sets in the Attributes Quality Characteristics Properties dialog box. Included are: Control limits, and Specification limits. Control Limits for an Attribute In order to set control limits for your chart sets, SPC provides you with several different options. If you know the limits that you want to set, you can use Points or Values. If the process is new and you would like to have limits calculated automatically for you, you can use the auto recalculation features. Whatever your preference, SPC provides you with an option. You can specify values for control limits by: entering values, or using auto recalculation. You can enter values as: (specific) values Points Caution: If you enter specific values during configuration and SPC detects an inconsistency, it will display an error message and will not allow you to save the configuration until you correct the error. Example You select Values to enter an attribute's control limits and enter 25 for an Upper Control Limit and 50 for a Lower Control Limit. SPC will display the following error message, "The upper control limit must be greater than the center line and the center line must be greater than the lower control limit." Note: If you use Points for general characteristics on limits rather than specific values, SPC will alert the user when the values become specific at runtime. If SPC detects configuration inconsistencies, it will display an $SPC_ADMIN_ALARM in the Alarm Viewer. See "SPC Administration Alarms." 4-48 CIMPLICITY SPC Operation Manual–December 2000 GFK-1413E SPC Auto Recalculation Feature One of the many advantages SPC offers is its ability to automatically calculate the control limits for a process. This is an excellent feature when your process is new and you want the SPC program to generate control limits. SPC offers two options to automatically recalculate control limits: Auto recalculation: is used in place of Values or Points. Once the control limits are automatically calculated, select either Values or Points for the life of the process. Force Auto Recalc: is used in addition to Values or Points. This option provides the flexibility to reset control limits during runtime. As a result, when you send an application to production, you can have SPC recalculate the control limits so that they are accurate for the process. Once the control limits are automatically calculated, deactivate the Force Auto Recalc option. Important: The Quality Control rules you have always followed for control limits still apply to both SPC automatic recalculation options, as follows: GFK-1413E When your process is new or in optimum condition, calculate the limits using the Auto Recalculation or Force Auto Recalculation option. Once you determine that SPC has automatically collected enough data to calculate the correct control limits, disable the automatic collection option. The calculated control limits are then used for the life of the process. Remember that the control limits produced by auto recalculation are valid only when your process is "in control." If you calculate them while your process is going "out of control," then the limits will be incorrect. Configuring SPC Data 4-49 Control Limits for (Specific) Values You can use your own criteria to set control limits using the Values option in the Limits tab of the Properties dialog box. Also, you can use the Force Auto Recalc feature to override limit values set in the dialog box. To specify values for control limits: 1. Click the Limits tab. 2. Click the Values radio button—see figure. 3. Enter the values for the p, nP, c or u chart's control limits as follows: UCL—Upper control limit. CL—Center line. LCL—Lower control limit. 4. 5. If you want to use the current control limits elsewhere in your project, or download them to a device, indicate the floating-point array Point of three (3) elements in the Setpoint ID field. The Point contains three elements for all values to be set in the following order: LCL, CL, UCL. Do one of the following: Click to browse for an existing Point in the Select a Point dialog box, or Click to designate a New Point. Indicate the Upper Spec Limit for control criteria. Attributes-Limits Properties-Values Popup Browse 4-50 CIMPLICITY SPC Operation Manual–December 2000 GFK-1413E To use auto recalculation to set control limit values: In the Force auto recalc field, indicate the Boolean Point ID that has been created to override the value control limits at runtime. This feature can be configured to be turned on or off at runtime. Point On When the Point is on (set to TRUE), auto recalculation is activated and the chart's control limits are recalculated. Pre-set values are ignored. Point Off When the Point is off (set to FALSE), auto recalculation is deactivated and the last calculated values are used. Pre-set values are ignored until the data collector is restarted or dynamically refreshed. Do one of the following—see figure: Click to browse for an existing Point in the Select a Point dialog box, or Click to designate a New Point. Note: Whenever the Force Auto Recalc Point is set to either TRUE or FALSE, the data collector will drop the current sample and start fresh. GFK-1413E Configuring SPC Data 4-51 Points Control Limits In order to use Points to set control limit criteria, use the Points option in the Limits tab of the Properties dialog box. Also, you can use the Force Auto Recalc feature to set the Point values for control limits. To specify Points for control limits: 1. Click the Limits tab. 2. Click the Points radio button—see figure. 3. Enter the a different Point for the UCL, CL and LCL control limits as follows: 4. 5. Click to browse for an existing Point in the Select a Point dialog box, or Click to designate a New Point. If you want to use the current control limits elsewhere in your project, or download them to a device, indicate the floating-point array Point of three (3) elements in the Setpoint ID field. The Point contains three elements for all values to be set in the following order: LCL, CL, UCL. Do one of the following: Click to browse for an existing Point in the Select a Point dialog box, or Click to designate a New Point. Indicate the Upper Spec Limit for control criteria. Attributes-Limits Properties-Points Popup Browse 4-52 CIMPLICITY SPC Operation Manual–December 2000 GFK-1413E To use auto recalculation to set Point values: In the Force auto recalc field, indicate the Boolean Point ID that has been created to override the value control limits at runtime. This feature can be configured to be turned on or off at runtime. Point On When the Point is on (set to TRUE), auto recalculation is activated and the chart's control limits are recalculated. The data collector will set the control Points (specified in the dialog box fields) to the calculated values. Point Off When the Point is off (set to FALSE), auto recalculation is deactivated and the last calculated values are used until the control Points are updated. Do one of the following—see figure: Click to browse for an existing Point in the Select a Point dialog box, or Click to designate a New Point. Note: Whenever the Force Auto Recalc Point is set to either TRUE or FALSE, the data collector will drop the current sample and start fresh. GFK-1413E Configuring SPC Data 4-53 Auto Recalculation Control Limits In order to automatically set control limits for a new process, or when your process is in optimum condition, use the Auto Recalculation option. To use auto recalculation to automatically set values: 1. Click the Limits tab. 2. Click the Auto recalculation radio button—see figure. 3. If you want to use the current control limits elsewhere in your project, or download them to a device, indicate the floating-point array Point of three (3) elements in the Setpoint ID field. The Point contains three elements for all values to be set in the following order: LCL, CL, UCL. Do one of the following: Click to browse for an existing Point in the Select a Point dialog box, or Click to designate a New Point. Attributes-Limits Properties-Auto recalculation Browse Popup 4. In the Force auto recalc field, indicate the Boolean Point ID that has been created to override the value control limits at runtime. This feature can be configured to be turned on or off at runtime. Point On When the Point is on (set to TRUE), auto recalculation is activated and all previous values are ignored. Point Off When the Point is off (set to FALSE), auto recalculation is deactivated and the data collector continues to use the last calculated values. Once enough data has been collected to calculate valid control limits, deactivate auto recalculation and use Values or Points to set control limits for your process in the dialog box. Do one of the following: 4-54 CIMPLICITY SPC Operation Manual–December 2000 GFK-1413E 5. Click to browse for an existing Point in the Select a Point dialog box, or Click to designate a New Point. Indicate the Upper Spec Limit for analysis. Note: Whenever the Force Auto Recalc Point is set to either TRUE or FALSE, the data collector will drop the current sample and start fresh. GFK-1413E Configuring SPC Data 4-55 Setting Alarms for Attribute Quality Characteristics You can use Alarm settings to warn you if a particular process is slightly off, even when production has not exceeded its control limits on a regular basis. This enables you to anticipate and handle potential problem areas in your production facility. Use the Alarm tab in the Attribute Quality Characteristics Properties box to specify the: type of alarm that will be triggered. Setpoint ID. control test criteria that will initiate alarms or change Setpoints. Alarms and Setpoints When one of the control tests meets your criteria for issuing a warning, it will generate the type of warning you configure, including: an alarm to alert operators that criteria have been met for one of the control tests. If alarms are generated for more than one control test, they will stack up and be deleted according to specifications you enter in the CIMPLICITY HMI Alarm Configuration. a Setpoint that will change to the number (0-9) of the Attribute characteristic tests, alarm state (1-8) and Upper Specification Limit (0). Setpoints provide you with a way to automate corrective action. You can write scripts that trigger the appropriate action whenever the criteria have been met for one of the control tests. The value of the Setpoint reflects that last test for which an alarm was triggered. To specify an alarm and Setpoint: 1. Click the Alarm tab—see figure. 2. You can select the $SPC_ALARM system Alarm ID, or you can create your own alarm in the Alarm ID field. Use the SPC_ALARM type when creating your own alarm. Do one of the following: Click to browse for an existing Point in the Select a Point dialog box, or Click to designate a New Point. The alarm message for SPC alarms consists of the following strings: 4-56 Document Name. Product Name. Quality/Defect Characteristic Name. A description of the control check that triggered the alarm. The value of the sample that triggered the alarm. CIMPLICITY SPC Operation Manual–December 2000 GFK-1413E 3. In the Setpoint ID field, indicate a Point to be set when an SPC alarm occurs. A Setpoint will change to 0-9 of the Attribute QC tests: Alarm state 1-8 and Upper Specification Limit 0. Do one of the following: Click to browse for an existing Point in the Select a Point dialog box, or Click to designate a New Point. Check to enable alarming. Check boxes to activate control tests and indicate test criteria. GFK-1413E 4. Check the Alarm enabled box to activate alarming for the attribute; clear to disable option. 5. Proceed to next section, "Criteria for Attribute Control Tests," for complete instructions and information. Configuring SPC Data 4-57 Criteria for Attribute Control Tests SPC plots the averages of the samples you define on n, nP, c and u chart sets. These charts will display the zones in which these averages fall. At runtime, each subgroup that does not meet one or more of the selected tests will be displayed with a special character (the default is a red asterisk). The following zones are used in these tests: Zone C is the area up to one standard deviation from the center line. Zone B is the area between one and two standard deviations from the center line. Zone A is the area between two and three standard deviations from the center line. Performing multiple control tests: In the Alarm tab of the Attribute Quality Characteristics Properties dialog box, you can run multiple control tests on your data by checking the appropriate boxes. At runtime, each data value will be compared with all of the selected alarm conditions and plotted on your configured SPC chart. When you position your cursor over the red asterisk (default character), a detailed tool tip will display with the date, time, point value and failed test data, i.e. the control test number(s). Note: When you create a control chart, you can select samples for exclusion. See "SPC Control Test Exclusion Mode" for instructions. The following example depicts the standard: Zone Std. dev UCL Center Line LCL 4-58 CIMPLICITY SPC Operation Manual–December 2000 GFK-1413E To perform attribute control tests: 1. Check the appropriate box in the Alarms tab for each of the tests to be performed. 2. View test results by: accessing a configured SPC chart to view runtime data, or configuring a new SPC chart. Control Test 0: Specification limit test This test checks the calculated acceptable percentage of nonconforming units or defects to the total sample size. Subgroups that meet test criteria will be marked with a red asterisk. For example, if UCL = 10, Control Test 1: One subgroup beyond upper or lower limits This test checks to see if any subgroups on the chart have a value greater than the upper control limit or less than the lower control limit. Subgroups that meet test criteria will be marked with a red asterisk. For example: GFK-1413E Configuring SPC Data 4-59 Control Test 2: N subgroups in a row on same side of center line This test checks to see if N subgroups in a row are on the same side of the center line. The Nth subgroup and all following subgroups that meet the test criteria will be marked with a red asterisk. For example, if N=3: Control Test 3: N consecutive subgroups in a row all increasing or decreasing This test checks to see if N subgroups in a row are increasing in value or decreasing in value. The Nth subgroup and all following subgroups that meet the test criteria will be marked with a red asterisk. For example, if N=3: 4-60 CIMPLICITY SPC Operation Manual–December 2000 GFK-1413E Control Test 4: N subgroups in a row, alternating up and down This test checks to see if N subgroups in a row are alternately increasing in value then decreasing in value. The Nth subgroup and all following subgroups that meet the test criteria will be marked with a red asterisk. For example, if N=3: Control Test 5: M out of N subgroups in a row in Zone A or beyond (same side of center) This test checks to see if M out of N subgroups in a row on the same side of the center line are in Zone A or beyond. The Mth subgroup that meets the test criteria will be marked with a red asterisk. For example, if M=2 and N=3: GFK-1413E Configuring SPC Data 4-61 Control Test 6: M out of N subgroups in a row in Zone B or beyond (same side of center) This test checks to see if M out of N subgroups in a row on the same side of the center line are in Zone B or beyond. The Mth subgroup that meets the test criteria will be marked with a red asterisk. For example, if M=2 and N=3: Control Test 7: N subgroups in a row in Zone C, above or below center This test checks to see if N subgroups in a row lie in Zone C on either side of the center line. The Nth subgroup and all the following subgroups that meet the test criteria will be marked with a red asterisk. For example, if N=4: 4-62 CIMPLICITY SPC Operation Manual–December 2000 GFK-1413E Control Test 8: N subgroups in a row beyond Zone C, above or below center This test checks to see if N subgroups in a row lie beyond Zone C on either side of the center line. The Nth subgroup and all following subgroups that meet the test criteria will be marked with a red asterisk. For example, if N=4: GFK-1413E Configuring SPC Data 4-63 ActiveX The present ActiveX control is capable of displaying Histograms, X Individual and XBar charts, as well as generating reports for variable QC data. For attribute QC data, p nP, c and u charts can be displayed, as well as generating reports. Pareto charts are available for displaying Defect data. It also handles Manual entry of data for variable, attribute, and defect charts. You can embed SPC ActiveX objects into any CimEdit screen by inserting and OLE object or by configuring charts using the SPC Properties dialog box. 4-64 CIMPLICITY SPC Operation Manual–December 2000 GFK-1413E Defect Folders In addition to entering product variable and attribute information, you can enter information that SPC will use to track a product's defects. SPC displays each group of defects on a Pareto chart. Configure defects by: creating a Defect folder (will display as a Pareto chart). adding defect categories (will each display as one bar on the chart). Adding a New Defect Group Within a product, you can create one or more Defect folders for SPC Pareto chart analysis. To create a Defect folder for a product: Method 1 – File menu 1. Expand the Products folder and select the product in the directory. 2. Click File on the menu bar. 3. Select New. 4. Select Defect Folder from the pullout menu. Method 2 – Popup menu 1. Expand the Products folder and select the product in the directory. 2. Right-click and select New Defect Folder from the popup menu. Result: Using either method, the Defect Folder Properties dialog box opens. New Defect folder - example of right-click method 2. Right-click on the product to display the popup menu. 1. Expand the main Products folder. 3. Select Defect Folder. Result: The Defect Folder Properties dialog box displays. GFK-1413E Configuring SPC Data 4-65 Defining Defect Folder Properties The Defect Folder Properties dialog box is where you identify each group of Defect Categories that will be included on one Pareto chart. Information you enter here applies to every defect category in the group—see figure. To define Defect Folder properties: 4-66 1. Check Active box to activate data collection for the Defect folder; clear box to disable option. The Document and Product must also be active for collection. 2. Check the Manual entry allowed box to enable manual data entry for SPC chart sets at runtime; clear to disable option. 3. Type a Name for the Defect folder. 4. Type a Description for the Defect folder (optional). 5. Select a Point to indicate the Match Point ID (numeric Point only) in order to use the same data source that is identified by the Point ID for multiple defects. Do one of the following: Click to browse for an existing Point in the Select a Point dialog box, or Click to designate a New Point. CIMPLICITY SPC Operation Manual–December 2000 GFK-1413E 6. In the Match value field, enter the value to be matched against the Match Point ID to determine whether the collected data applies to this specific defect folder. For example, the data source may be used to measure a defect (for example, color) for several products (Product 1, Product 2, Product 3). You can enter a Match Point ID value of 1 to measure color for Product 1, and 2 to measure color for Product 2. 7. 8. If this is a batch process, select a Batch Point ID. This will allow you to distinguish between different batches for the same Product Quality Characteristic. The value of the Batch Point is associated with the calculated data and can be used as search criteria for charts and reports. Do one of the following: Click to browse for an existing Point in the Select a Point dialog box, or Click to designate a New Point. Click the appropriate radio button to designate the Collection Method, as described below. When adding defect categories to your folder, the method indicated here will determine the corresponding input fields in the Collection tab of the Defect Properties dialog box. Point—retrieves data from CIMPLICITY Point values. Logged—retrieves data from one or more ODBC database tables. None—no data is to be collected by the SPC Data Collector. The Manual entry allowed box is checked by default. Note: All Defect Categories in this Defect folder will use the collection method you designate for the folder. GFK-1413E Configuring SPC Data 4-67 Defect Quality Characteristics Once you have created a Defect folder, add the defect quality characteristics that will appear together, by creating a defect category for each. A bar on the Pareto Chart represents each Defect Category. Use the Defect Properties dialog box to create and define defects as follows: General characteristics—Includes the name of the characteristic, and an optional description Collection characteristics—Describes how the data will be collected. The type of data collection used is determined by the collection method you select for the Defect folder. Adding a New Defect Category To place a new Defect Category in a Defect folder, do one of the following: Method 1 – File menu 1. Select the Defect folder. 2. Click File on the menu bar. 3. Select New. 4. Select Defect Category from the pullout menu. Method 2 – Popup menu 1. Navigate to the Defect folder in the directory. 2. Select the folder and right-click on it. 3. Select New Defect Category from the popup menu. Result: Using either method, the Defect Category Properties dialog box opens defaulted to the General tab. 4-68 CIMPLICITY SPC Operation Manual–December 2000 GFK-1413E Specifying a Defect Category's General Characteristics Begin configuring a new defect category by defining its general characteristics in the General tab of the Defect Properties dialog box. Characteristics are defined when a code is assigned and a description is indicated. To define general defect characteristics: 1. Click the General tab. 2. Type a text description for the defect in the Description field. Type a description for the defect category. Note: During your configuration and at runtime, if SPC detects configuration inconsistencies, it will display an $SPC_ADMIN_ALARM in the Alarm Viewer. See "SPC Administration Alarms" in this chapter. GFK-1413E Configuring SPC Data 4-69 Defining Defect Category Collection Properties All Defect Categories in a Defect folder use the same collection method; therefore, specify the collection method in the Defect Folder Properties dialog box. The Collection tab displayed for a Defect Category depends on what you selected for the Defect Folder. Point Collection for a Defect Category When Point collection is designated in the Defect folder, the Point input fields display in the Defect Properties dialog box—Collection tab. To specify Point collection for defect: 4-70 1. Click the Collection tab—see figure. 2. Identify the Point ID (data source) from which the SPC Data Collector retrieves data. The Point ID cannot have a Text type. Do one of the following: Click to browse for an existing Point in the Select a Point dialog box, or Click to designate a New Point. 3. When using any array, specify the number where SPC should begin to collect values in the Start element field. Note that the default is 0. 4. When using any array, specify the number where SPC should finish collecting values in the End element field. Note that the default is 0. 5. Check the EU conversion box if the SPC Data Collector is to use the EU value(s) for the Point. Clear if the SPC Data Collector should use the raw value(s) for the Point CIMPLICITY SPC Operation Manual–December 2000 GFK-1413E Logged Collection for a Defect Category When Logged collection is designated in the Defect folder, the Logged input fields display in the Defect Properties dialog box—Collection tab. To specify Logged collection for defect: 1. Click the Collection tab—see figure. 2. Use the ODBC data source drop-down list to select the name of the database from which SPC will retrieve data. 3. In the Database user field, type a name for the user when logging into the ODBC data source. 4. In the Password field, type a password for the user when logging into the ODBC data source. 5. Click to browse for the Table ID where data is located. 6. Click to browse for the Column ID where data is located. Defect Properties dialog box GFK-1413E Configuring SPC Data 4-71 No Collection for a Defect Category When no collection method is specified in the Defect folder, there are no applicable input fields in the Collection tab. Manual data entry is automatically enabled. 4-72 CIMPLICITY SPC Operation Manual–December 2000 GFK-1413E SPC Administration Alarms During runtime the SPC application detects the following kinds of inconsistencies: Points are unavailable. limits are out of sequence. sampling parameters are invalid. Therefore, SPC comes with a built-in $SPC_ADMIN_ALARM to alert operators to those conditions. This alarm is generated because of configuration inconsistencies, in contrast to SPC alarms that are generated because of process problems. Each instance of this alarm, which will display in your Alarm Viewer, provides you with: \\Group Name\Product Name\QC Name\Alarm number Alarm Numbers are as follows: GFK-1413E 1. Required Points(s) are unavailable. 2. XBar control limits are out of sequence. 3. R/S control limits are out of sequence. 4. Sample size is invalid. 5. Gap size is invalid. Configuring SPC Data 4-73 Document Tools The SPC document provides you with three major tools for storing and locating specific information, as follows: Document Tree (directory) Configure Display Attributes Find Function Document Tree SPC organizes data in a hierarchy that logically emulates the steps you take to configure the application. 1. The Products folder is the primary folder and the top level of the directory hierarchy. 2. Defined Product folders represent the next sublevel in the hierarchy. Contained within the Product subfolder are Variable and Attribute quality characteristics that you configure for your product. 3. Defined Defect folders represent the third level in the hierarchy. Contained within the Defect subfolder are Defect categories that you configure for your product. The Main Tree The directory structure in an SPC document is illustrated below: 4-74 CIMPLICITY SPC Operation Manual–December 2000 GFK-1413E Product Folder in the Document Tree Each SPC Product folder contains a collection of Variable Quality Characteristics, Attribute Quality Characteristics and Defect folders that can be used to determine the quality of the product. When you click on a Product folder in the directory, the contents of the folder are displayed in the Detail view—see figure: where: is a Variable Quality Characteristic for the product. Double-click on the applet to view its properties; right-click on the applet to access a popup menu with additional options. is an Attribute Quality Characteristic for the product. Double-click on the applet to view its properties; right-click on the applet to access a popup menu with additional options. is a Defect folder for the product that holds configured defect categories. Click on the folder to display its Defect codes in the Detail view. Defect Folder in the Document Tree Defect folders contain its configured Defect Categories. When you click on a Defect folder in the directory, the contents of the Details frame look like the following: where: is a Defect Category. Double-click on the applet to view its properties; right-click on the applet to access a popup menu with additional options. GFK-1413E Configuring SPC Data 4-75 Changing Display Attributes You can change the type of attributes displayed for a QC or defect category, and their order in the detail view of the SPC document using the Configure Display Attributes dialog box. A column will be added to the detail view of the SPC document for each attribute that you choose to display. To change display attributes, do one of the following: Method 1 – View menu 1. Click View on the menu bar. 2. Select Attributes. Method 2 – Quick keys 1. Press Ctrl+A. Result: Using either method, the Configure Display Attributes dialog box opens. Select the attribute from the list to be ADDED to the Display attributes list, and then click Add-->. Select the attribute from the list to be Removed to the Available attributes list, and then click Remove-->. Select the attribute in the Display list and click either Move Up or Move Down to change its order in the list. Click Remove All--> to remove all the attributes from the Display list to the Available list. Click Add All--> to add all of the attributes from the Available list to the Display list. The lists are displayed in the dialog box and are described as follows: 4-76 Available attributes: list of attributes to choose from for display purposes. Display attributes: list of attributes in the order in which they are currently being displayed. CIMPLICITY SPC Operation Manual–December 2000 GFK-1413E Continue from Method 1 or Method 2 1. Add and remove attributes and change their order in the Display list as follows: To:… Then… Add one attribute to the Display list, Select an attribute in the Available attributes list. Click Add . Add all attributes to the Display list, Click Add All . Remove an attribute from the Display list, Select the attribute. Click Remove . Remove all the attributes from the Display list, Click Remove All . Change the order of the attributes in the Display list, Select the attribute. Click Move Up to move it up in the list. Click Move Down to move it down in the list. 2. Click OK to effect changes, or Cancel to cancel the operation. Result: The columns in the detail view display will reflect the selected attributes and their order as defined in the Configure Display Attributes dialog box. GFK-1413E Configuring SPC Data 4-77 Finding a Product/Quality Characteristic An SPC document can contain many products and many quality, attribute and defect characteristics. You can use the Find function to quickly search for a specific characteristic or subset of characteristics. To initiate a search, do one of the following: Method 1 – Tools menu 1. Click Tools on the menu bar. 2. Select Find. Method 2 – Quick keys 1. Press Ctrl+F. Result: Using either method, the Find a Product/Quality Characteristic dialog box opens—see figure. 1. Click Tools on the menu bar. 2. Select Find. 3. Do one of a, b or c to find a product or quality characteristic. a. Type a product name or use search criteria to locate a product. b. Type a quality characteristic name or use search criteria. c. Type a quality type or use search criteria. 4-78 CIMPLICITY SPC Operation Manual–December 2000 4. Click Browse to display results in the dialog box. GFK-1413E Continue from Methods 1&2 1. In the appropriate field, use the following filters to reduce the list of quality and defect characteristics: Product name Quality/Attribute/Defect characteristic name Quality/Attribute/Defect characteristic type You can also use wildcards to reduce search results as follows: * Searches for any number of characters in the string. For example, to display the list of products whose name starts with ‘M’ and ends with ‘X’, enter M*X in the Product Name field. ? Searches for any number of characters at this Point in the string. For example, to display the list of products that are three characters long, and whose name starts with ‘M’ and the third character is ‘X’, enter M?X in the Product Name field. 2. Click Browse to display results in dialog box. 3. Double-click the item in the list to go to the item in its folder in the SPC directory— or—click OK to close the dialog box. Note: There are no implied wildcards. If you do not include or end your search string with an asterisk, only an exact match will be returned in the result list. GFK-1413E Configuring SPC Data 4-79 Configuring SPC Charts Getting Started After you create your ODBC data source and configure your SPC data collection, you can configure SPC ActiveX controls in CimEdit/CimView screens or other ActiveX containers, such as Internet Explorer, to display your SPC data. Creating an SPC Chart in CimEdit To create an SPC chart in a CimEdit screen Method 1 Click the SPC button on the toolbar. Result: A new SPC Control is placed in the upper-left corner of the CimEdit screen. The SPC control initially is empty and displays a message for editing the control. Method 2 1. Click the OLE button on the toolbar. Result: The mouse pointer changes to a bracket GFK-1413E . 5-1 2. Position the bracket on the CimEdit screen and click to fix the position of the chart. Result: The Insert Object dialog box opens—see figure. Select CIMPLICITY SPC Control, and then.... Click OK. 3. Select CIMPLICITY SPC Control from the ActiveX list. 4. Click OK. Result: A new SPC Control is placed at the position you selected in your CimEdit screen. The SPC control initially is empty and displays a message for editing the control. 5-2 CIMPLICITY SPC Operation Manual–December 2000 GFK-1413E Configuring SPC Chart Properties Configure SPC chart Properties using the CIMPLICITY SPC Control Properties dialog box. To open the CIMPLICITY SPC Control Properties dialog box: Method 1 – Quickest Double-click on the chart. Method 2 – Edit menu 1. Click Edit on the menu bar. 2. Select CIMPLICITY SPC Control Object. 3. Select Properties from the pullout menu. Method 3 – Popup menu 1. Select the chart 2. Right-click and select Properties from the popup menu. Result: Using any of the above methods, the CIMPLICITY SPC Control Properties dialog box will open. GFK-1413E Configuring SPC Charts 5-3 General Properties Define the appearance of your SPC chart in the General tab of the SPC Control Properties dialog box—see figure. To define SPC general properties: 1. Type in the qualified path to the project and SPC document containing the data to be displayed in the chart. Alternately, click the Browse button to search for the project and SPC document. 2. Select the Product to be charted from the drop-down list. 3. In the Batch ID field, enter the text that identifies the batch process to be examined. The chart will display only those points where the content of the Batch Point ID matches this identifier. 1a. Type in or select the project from the drop-down list. 1. Type in or click Browse to select the project & SPC document that contains the data to be displayed. 2. Select the Product from the drop-down list. 3. Optionally, enter the text ID for the batch to be examined. 5. Designate the duration for data collection by clicking the appropriate radio button, and entering data in the corresponding fields. 4. Select the quality characteristic to be examined for the product. This will determine the chart type. 5-4 1c. Double-click the document containing the data to be displayed. 1b. Click Browse to retrieve the configured documents in the project. 4. Select the Quality Characteristic (QC) to be examined for the product using the dropdown list. You will have two or more options to choose from based on the calculation for the product and the selected QC: Report and chart type(s). 5. Click the appropriate radio button to select the duration for data collection: Show most recent values—displays the most recent values collected in the chart. Time span—indicate the start time and date and the ending time and date to collect data to be displayed on the chart. CIMPLICITY SPC Operation Manual–December 2000 GFK-1413E Chart Properties You can choose to display a report or a chart, and you can also customize the look of your display in the SPC Control Properties dialog box—see figure. To define SPC chart properties: 1. Click the Chart tab. 2. The drop-down list in the Type field will display two or more options: Report and available chart type(s). The chart type is dependent on the QC selected in the General properties and the configuration calculated for the product. The following types may be available in the drop-down list: Defect QC Variable QC Attribute QC Pareto chart XBar-R or XBar-S p Report X-Individual nP Report c u Report 3. 4. In the Max to display field, type the maximum number of elements to display on the chart using the following guidelines: XBar-R/S charts—number of subgroups. X-Individuals charts, histograms, n, nP, u, c and Pareto charts—number of samples. In the Update Interval field, enter the time in hh:mm:ss to update chart data. Note that this field is disabled if you are using logged data.. 1. Select the chart type from the drop-down list. 7. Use the pullout Palette & Special menus to customize the foreground, background and chart characteristics. 2. Enter the maximum number of elements to display on the chart. 3. Enter the time in hh:mm:ss to update the chart. Field is disabled if using logged data. 4. Type the title of the chart. Click Font to designate the font, point size and color. Click Show title to display the chart title on screen; otherwise clear box. GFK-1413E Configuring SPC Charts 5. Check to enable Exclusion Mode; clear to disable. 6. Check to Show the chart legend; clear to disable. 5-5 5. Type a Title for your report or chart and click the Show title box to display the title on screen. 6. Click Font to display the Font dialog box. Adjust the font, style and size of your title using the available options. 7. In the Color group, click the arrows next to Foreground, Background and Chart to display the color Palette and Special options. Select options to customize the display of your report or chart. 8. Click the Show legend box to display legend information on your report or chart. Clear check box to disable. 9. Check Exclusion Mode to enable exclusion mode on your chart. Clear check box to disable. Note: See "Configuring SPC Data" for complete information and instructions on Exclusion Mode. 5-6 CIMPLICITY SPC Operation Manual–December 2000 GFK-1413E Line Properties You can choose to display control lines on your chart in the SPC Control Properties dialog box—see figure. To set line properties: 1. Click the Lines tab. Check boxes to show lines on your chart. Clear boxes to hide lines. 2. GFK-1413E Check boxes to show lines on your chart, or clear boxes to hide lines. Lines display as follows: Show UCL Displays upper control limit line. Show CL Displays center line. Show LCL Displays lower control limit line. Show zones Displays zone lines. Configuring SPC Charts 5-7 Axis Properties You can choose to display the X and Y-axis of your chart, and also customize the look of their titles and labels in the SPC Control Properties dialog box—see figure. To set X and Y axis properties: 1. Click the Axis tab. 2. Check boxes to show lines on your chart, or clear boxes to hide lines. Lines display as follows: Show X-axis title Displays the X-axis title. Show X-axis labels Displays X-axis labels. Show Y-axis title Displays Y-axis title. Show Y-axis labels Displays Y-axis labels. 3. Click Font Title to display the Font dialog box. Adjust the font, style and size of your X and Y-axis titles using the available options. 4. Click Label Font to display the Font dialog box. Adjust the font, style and size of your X and Y-axis labels using the available options. Check boxes to show X and Y-axis titles and labels. Clear boxes to hide titles and labels. Adjust the font, style and size of your titles and labels using the scroll lists. Select a TrueType font so that text will display correctly. Note: For both the Title and Labels, be sure to select a TrueType font. Other fonts may not display the text correctly on your chart. 5-8 CIMPLICITY SPC Operation Manual–December 2000 GFK-1413E Bar Chart Properties If you are configuring a Histogram or Pareto chart, you can set display parameters in the SPC Control Properties dialog box—see figure. If configuring a report or other chart type, you can skip this section. To set bar chart properties: Click the Bar Chart tab. Result: If you are configuring a Histogram, the Histogram group will be active in the dialog box and the Pareto group will be dimmed. The reverse is true if you are configuring a Pareto chart. Histograms Group Check boxes and enter data using the definitions for options as follows: Show spec limits—to display the Upper and Lower Specification Limits configured for the data. Clear check box to disable option. Show normal curve—to superimpose a normal distribution curve over the histogram data. Clear check box to disable option. Max samples—enter the maximum number of samples to be displayed in the histogram. Check box to display parameters on your Histogram or Pareto chart. Histograms only Check box to display configured Upper & Lower specification limits. Pareto charts only Check box to superimpose a normal distribution curve over data. Check box and enter the number of bars to be displayed on the Pareto chart. Enter the maximum number of samples to display on the histogram. Check box to display "Other" defects on a separate bar. Note: The Histograms and Pareto groups are not both active at the same time on the SPC Control Properties dialog box as shown in the figure above. Figure is for instructive purposes only. GFK-1413E Configuring SPC Charts 5-9 Pareto Group Check boxes and enter data using the definitions for options as follows: Show fixed number of bars—check box and enter the number of bars to be displayed on the Pareto chart. If you have more defect codes than bars, only the bars for the most frequently occurring defects will display. Clear check box to display a bar for each defect code defined for this product. Show bar of remaining defects—check box to display the total number of other defects on a separate bar marked, "Other." Clear the check box to disable option. Report Properties You can configure the data to be displayed on your report in the SPC Control Properties dialog box. Several options for adding information are available using the Report tab—see figure. To set report properties: 1. Click the Report tab. 2. Check boxes to display options on your report, or clear boxes to disable options. Check boxes to display data on your report. Clear boxes to disable option. Click to select all the check boxes. Click to clear all the check boxes. Tip: Alternately, use the Select All button to check all of the options or the Unselect All button to disable all of the options. 5-10 CIMPLICITY SPC Operation Manual–December 2000 GFK-1413E Creating an SPC Chart in a Web Page The following is a sample HTML fragment that will display an SPC ActiveX control in a web page. Microsoft's ActiveX Control Pad can automatically generate code for inserting the CIMPLICITY SPC control and we recommend it. It is freely available from Microsoft's web site -- www.microsoft.com. <HTML> <HEAD> <TITLE>New Page</TITLE> </HEAD> <BODY> <OBJECT ID="Spc1" WIDTH=400 HEIGHT=300 CLASSID="CLSID:8A843E25-2878-11D1-B6F5-00A02491B166"> <PARAM NAME="_Version" VALUE="131079"> <PARAM NAME="_ExtentX" VALUE="10583"> <PARAM NAME="_ExtentY" VALUE="7938"> <PARAM NAME="UpdateInterval" VALUE="00:00:10"> <PARAM NAME="GroupName" VALUE="WIDGET"> <PARAM NAME="Product" VALUE="LEFT HAND WIDGET"> <PARAM NAME="QC" VALUE="WLength"> <PARAM NAME="ProjectGroup" VALUE="\\SPC_DEMO\WIDGET"> </OBJECT> </BODY> Use of Netscape Navigator is not supported at this time. Changing the Date/Time Format on Charts SPC uses the short date style. To change the date/time format of that style on a chart, use the Regional Settings option on your Windows Control Panel. GFK-1413E Configuring SPC Charts 5-11 ActiveX Methods and Properties SPC charting provides you with a wide range of built-in functionality. However, if you are familiar with ActiveX and want to add to that functionality as you design your screens, the following methods and properties are available. 5-12 void AboutBox( ); Calls the About dialog box. Boolean GetControlLimits (ucl, cl, lcl, rucl, rcl, rlcl) Gets the current control limits displayed on the chart void Print( ); Calls the Print dialog box. void UseAmbientProperties( ); Automatically changes an ActiveX control to use the ambient properties of the container CIMPLICITY SPC Operation Manual–December 2000 GFK-1413E ActiveX Properties: BSTR ChartTitle; BSTR UpdateInterval; short ChartType; boolean ByTime; BSTR StartTime; BSTR EndDate; BSTR EndTime; short MaxDisplay; boolean Exclusion mode; OLE_COLOR BackgroundColor; OLE_COLOR ChartColor; OLE_COLOR ForegroundColor; BSTR StartDate; IFontDisp* TitleFont; boolean UseAmbientBgColor; boolean UseAmbientFgColor; boolean UseAmbientChartTitleFont; boolean UseAmbientChartColor; BSTR BatchID; BSTR ProjectGroup; BSTR Product; BSTR QC; boolean ShowLegend; boolean ShowChartTitle; boolean ShowXAxisLabels; boolean ShowXAxisTitle; boolean ShowYAxisLabels; boolean ShowYAxisTitle; boolean UseAmbientAxisLabelFont; boolean UseAmbientAxisTitleFont; IFontDisp* AxisLabelFont; IFontDisp* AxisTitleFont; short ReportFields; ISpcLineProperties* UCLLineProperties; ISpcLineProperties* CLLineProperties; ISpcLineProperties* LCLLineProperties; ISpcLineProperties* ZoneLineProperties; ISpcLineProperties* SpecLimitLineProperties; ISpcLineProperties* NormalCurveLineProperties; boolean ShowUpperControlLimit; boolean ShowCenterLine; boolean ShowLowerControlLimit; boolean ShowZones; boolean ShowSpecLimits; boolean ShowNormalCurve; boolean ShowInfoBox; boolean ShowFixedNumberOfBars; boolean ShowRemainingDefects; boolean ShowValues; MaxHistogramSamples; NumberOfZones; float UpperSpecLimit; float LowerSpecLimit; GFK-1413E Configuring SPC Charts 5-13 Using SPC Charts Runtime Functions You can perform several functions from within an SPC ActiveX control using options on the popup menu. To perform runtime functions: 1. Display an SPC ActiveX control. 2. Position the cursor over the control and right-click. 3. Select an option from the popup menu—see figure. Popup Menu Option Descriptions: GFK-1413E Update—updates the display with current data. Manual Data Entry—opens the Manual Data Entry dialog box for quality characteristics. Print—opens the Print dialog box for printing screen contents. Properties—opens the SPC Control Properties dialog box to set properties for the control. Use Ambient Properties—changes the foreground and a background color used by the ActiveX control to the ambient colors defined for the screen. About SPC—provides information about the SPC application, such as version number. 6-1 Displaying Test Results You can perform up to eight (8) control tests on XBar-R and XBar-S data, and up to nine (9) control tests on the p, nP, c and u data. The results of these tests are displayed graphically on the appropriate chart. Points on the chart that meet one or more test criteria are highlighted with red asterisks (default). In addition, if you position the cursor over one of these points, a tool tip will display a summary of the results—see figure. Example F-2 CIMPLICITY SPC Operation Manual–December 2000 GFK-1413E Manual Data Entry If Manual Data Entry was selected as a collection option when the Variable, Attribute or Defect QC was configured, you can use the Manual Data Entry popup menu option to input QC data for the chart. Variable QC Data When you select Manual Data Entry for a Variable QC chart, the Manual Data Entry (Variable QC) dialog box opens. To manually enter data for a Variable QC chart: GFK-1413E 1. In the Raw Value field, type the value to be manually entered. 2. Press 3. Continue to enter manual data in the same manner. 4. Once all the manual data has been entered, click Submit to send the data to the SPC Data Collector. next to the input field to move the value into the list box. Using SPC Charts 6-3 Attribute QC Data When you select Manual Data Entry for an Attribute QC chart, the Manual Data Entry (Attribute QC) dialog box opens. To manually enter data for an Attribute QC chart: Click the appropriate radio button to establish the Subgroup Size as follows: Fixed—subgroup size is constant. Variable—subgroup size is subject to change. Result: The input fields will reflect the selected option, Fixed or Variable—see figure. Fixed 1. In the Raw Value field, type the value to be manually entered. 2. Press 3. Continue to enter manual data in the same manner. 4. Once all the manual data has been entered, click Submit to send the data to the SPC Data Collector. to move the value into the Value box. Variable only 2a. Click variable to be able to change the subgroup size. Fixed only 1a. Click Fixed for a constant subgroup size. 1b. Type value and click > to move it to the Value box. 1c. Once all the values have been entered, click to submit data. 2d. Once all the values have been entered, click to submit data. 2b. Type subgroup size. F-4 CIMPLICITY SPC Operation Manual–December 2000 2c. Type corresponding value and click > to move data to the Subgroup Size and Values boxes. GFK-1413E Variable 1. In the Subgroup Size field, type the value to be manually entered. 2. In the Raw Value field, type the value to be manually entered. 3. Press 4. Continue to enter manual data in the same manner. 5. Once all the manual data has been entered, click Submit to send the data to the SPC Data Collector. to move data into the Subgroup Size and Values boxes respectively. Tip: Use the Clear All button to quickly delete all of the data from the list box(es). GFK-1413E Using SPC Charts 6-5 Defect QC Data When you select Manual Data Entry for a Defect QC chart, the Manual Data Entry (Defect QC) dialog box opens. To manually enter data for a Defect QC: F-6 1. Type the Defect Category name in the Defect Code field. 2. Type the number of occurrences for the Defect Category in the Num of Occ field. 3. Press 4. Continue to enter manual data in the same manner. 5. Once all of the manual data has been entered, click Submit to send the data to the SPC Data Collector. next to the Num of Occ field to move the value into the list box. CIMPLICITY SPC Operation Manual–December 2000 GFK-1413E Appendix A - Tables of Constants for Control Charts XBar and R Chart Factors for Control Limits The values for samples ranging in size from 0 to 25 for XBar and R charts are: Chart for Ranges Chart for Averages Sample Size 0 1 2 3 4 5 6 7 8 9 10 11 12 13 14 15 16 17 18 19 20 21 22 23 24 25 GFK-1413E A2 0.000 2.660 1.881 1.023 0.729 0.577 0.483 0.419 0.373 0.337 0.308 0.285 0.266 0.249 0.235 0.223 0.212 0.203 0.194 0.187 0.180 0.173 0.167 0.162 0.157 0.153 D3 0.000 0.000 0.000 0.000 0.000 0.000 0.000 0.076 0.136 0.184 0.223 0.259 0.284 0.308 0.329 0.348 0.363 0.378 0.391 0.403 0.415 0.425 0.434 0.443 0.451 0.459 D4 0.000 3.267 3.268 2.574 2.282 2.114 2.004 1.924 1.864 1.816 1.777 1.755 1.717 1.692 1.671 1.652 1.637 1.622 1.608 1.597 1.585 1.575 1.566 1.557 1.548 1.541 A-1 XBar and S Chart Factors for Control Limits The values for samples ranging in size from 0 to 25 for XBar and S charts are: for Standard Deviations Chart for Averages Sample Size A-2 A3 B3 0 0.000 1 0.000 B4 2 2.659 0.000 3.268 3 1.954 0.000 2.568 4 1.628 0.000 2.266 5 1.427 0.000 2.089 6 1.287 0.030 1.970 7 1.182 0.118 1.882 8 1.099 0.185 1.815 9 1.032 0.239 1.761 10 0.975 0.284 1.726 11 0.927 0.321 1.679 12 0.886 0.354 1.646 13 0.850 0.382 1.618 14 0.817 0.406 1.594 15 0.789 0.428 1.572 16 0.763 0.448 1.552 17 0.739 0.466 1.534 18 0.718 0.482 1.518 19 0.698 0.497 1.503 20 0.680 0.510 1.490 21 0.663 0.523 1.477 22 0.647 0.534 1.466 23 0.633 0.545 1.455 24 0.619 0.555 1.445 25 0.606 0.565 1.435 CIMPLICITY SPC Operation Manual–December 2000 GFK-1413E Appendix B - X-Individual Chart Calculations X-Individual Chart Calculations The X-Individual chart is sometimes called a pre-control chart. This type of chart is used to determine the stability of the center of the process. The control limits are calculated by determining the standard deviation of the sample population. X-Individual Center Line For the X-Individual chart, the center line is calculated as: X = x1 + x 2 +...+ xn n where x1 through xn are the values of each item in the set and n is the number of samples. X-Individual Standard Deviation The standard deviation is calculated as: n ( x − x) 2 i S= i =1 n −1 The formulas used for calculating the upper and lower control limits are: UCL = X + 3S GFK-1413E LCL = X − 3S 2-1 Appendix C - XBar-R Chart Calculations XBar-R Chart Calculations. The XBar-R chart displays two charts, one for the Xbar values and the other for the Range values. The formulas for calculating the center lines and control limits for the XBar-R control chart are detailed in the following sections. XBar-R Chart Center Line Based on the sample size, the mean for a given sample can be calculated as: X = x1 + x 2 +...+ xn n where x1 through xn are the values of each observation in the sample and n is the number of observations in the sample. Because an XBar-R chart displays the average of each sample in the set, its center line is calculated as: X = X 1 + X 2 +...+ X m m where X 1 through X m are the averages of each sample, and m is the number of samples. This grand average becomes the center line of the XBar chart. XBar-R Chart Control Limits To construct the upper control limit (UCL) and lower control limit (LCL) for the XBar-R chart, we need to know the standard deviation of the data. This can be estimated with the range method. In a sample of size n, the range is the difference between the smallest and largest observations. In other words: R = x max − x min GFK-1413E C-1 If R1 through Rm is the range of m samples, then the average range is: R= R1 + R 2 +...+ Rm m The formulas used for calculating the upper and lower control limits for the XBar chart are: UCL = x + A2 R LCL = x + A2 R Where A2 is a tabulated value based on the sample size. See the XBar Chart Factors for Control Limits table in Appendix A for values of A2 for sample sizes ranging from 1 to 25. If the sample size is greater than 25, the formulas are: UCL = X + 3S LCL = X − 3S where S is the standard deviation for the chart. R Chart Center Line For the R chart, the formula for calculating the center line is: R= R1 + R 2 +...+ Rm m R Chart Control Limits The formulas used for calculating the upper and lower control limits for the R chart are: UCL = RD4 LCL = RD3 where D4 and D3 are tabulated values based on the sample size. See the Range Chart Factors for Control Limits table in Appendix A for values of D3 and D4 for sample sizes ranging from 1 to 25. If the sample size is greater than 25, the formulas are: UCL = R + 3S LCL = R − 3S where S is the standard deviation for the chart. C-2 CIMPLICITY SPC Operation Manual–December 2000 GFK-1413E Appendix D - XBar-S Chart Calculations XBar-S Chart Calculations The XBar-S chart displays two charts, one for the Xbar values and the other for the Sigma values. The formulas for calculating the center lines and control limits for the XBar-S control chart are detailed in the following sections. XBar-S Chart Center Line Based on the sample size, the mean for a given sample can be calculated as: X = x1 + x 2 +...+ xn n where x1 through xn are the values of each observation in the sample and n is the number of observations in the sample. Because an XBar-S chart displays the average of each sample in the set, its center line is calculated as: X = X 1 + X 2 +...+ X m m where X 1 through X m are the averages of each sample, and m is the number of samples. This grand average becomes the center line of the XBar chart. GFK-1413E D-1 XBar-S Chart Control Limits To construct the upper control limit (UCL) and lower control limit (LCL) for the XBar-S chart, we need to know the standard deviation of the data. In a sample of size n, the standard deviation is: n s= i =1 ( x − x) 2 i n −1 If s1 through deviation is: s= sm is the range of m standard deviations, then the average standard s1 + s2 +...+ sm m The formulas used for calculating the upper and lower control limits for the XBar chart are: UCL = x + A3 s LCL = x − A3 s Where A3 is a tabulated value based on the sample size. See the XBar Chart Factors for Control Limits table in Appendix A for values of A3 for sample sizes ranging from 1 to 25. If the sample size is greater than 25, the formulas are: UCL = X + 3S LCL = X − 3S where S is the standard deviation for the chart. S Chart Center Line For the S chart, the formula for calculating the center line is: s= s1 + s2 ...+ sm m S Chart Control Limits The formulas used for calculating the upper and lower control limits for the S chart are: UCL = sB 4 LCL = sB3 where B3 and B4 are tabulated values based on the sample size. See the Range Chart Factors for Control Limits table in Appendix A for values of B3 and B4 for sample sizes ranging from 1 to 25. If the sample size is greater than 25, the formulas are: UCL = s + 3S LCL = s − 3S where S is the standard deviation for the chart. D-2 CIMPLICITY SPC Operation Manual–December 2000 GFK-1413E Appendix E - Histogram Chart Calculations Histogram Chart Calculations The Histogram shows you the distribution, the central tendancy and the scatter or variability of the sample data. This chart also displays the calculated process capability for the data. There are two process capability measurements displayed by this chart, Cp and Cpk. Depending on whether the source of the data is an XBar-R or XBar-S chart, the estimate of the process standard deviation differs. For XBar-R data, the estimate of the process standard deviation is: σˆ = R / d 2 = σˆ R / d 2 For XBar-S data, the estimate of the process standard deviation is: σ = S / c4 = σ S / c 4 Capability Index Cp is the capability index defined as the tolerance width divided by the process capability, irrespective of process centering. For XBar-R data, it is calculated as: USL − LSL 6σ R / d 2 For XBar-S data, it is calculated as: USL − LSL 6σ S / c 4 GFK-1413E E-1 Capability Index for Process Centering Cpk is the capability index which accounts for process centering and is defined as the minimum of the upper and lower capability indexes. It relates the scaled distance between the process mean and the closes specification limit to half the total process spread. For XBar-R data, the upper and lower indexes are calculated as: CPU = USL − X X − LSL and CPL = 3σ R / d 3σ R / d 2 2 For XBar-S data, the upper and lower indexes are calculated as: CPU = USL − X X − LSL and CPL = 3σ S / c 3σ S / c 4 E-2 4 CIMPLICITY SPC Operation Manual–December 2000 GFK-1413E Appendix F - P Chart Calculations P Chart Calculations The P chart measures the proportion of nonconforming (discrepant or defective) items in a group of items being inspected. Proportion is defined as the ratio of the number of nonconforming items in a population to the total number of items in that population. Sample sizes need not be equal. Data Available N = Number of units produced in each sample ( subgroup size ) R(1..K) = Number of units rejected in each subgroup K= Inspection Quantity To be calculated Average Proportion Non conforming, k Ri p = i =1 _________ k Ni i =1 Sigma ( standard deviation) ( p (1 − p )) SP = _________ N GFK-1413E F-1 Center Line and Control Limits The control limits are the process average plus or minus an allowance for the variation that could be expected if the process where in statistical control, given the subgroup size. For the study period of k subgroups, calculate the upper & lower control limits: Center Line ( CLP ): F-2 p Upper Control Limit (UCLP): CLP + 3 SP Lower Control Limit (LCLP): MAX(0,(CLP – 3 SP)) CIMPLICITY SPC Operation Manual–December 2000 GFK-1413E Appendix G - nP Chart Calculations nP Chart Calculations The nP chart measures the number of nonconforming items in an inspection lot. It is identical to P chart except that the actual number of nonconforming items, rather than their proportion of the sample, is plotted. The inspection sample sizes must be equal in this case. Data Available N = Number of units produced in each sample ( subgroup size ) R(1..K) = Number of units rejected in each subgroup K = Inspection Quantity To be calculated : Process Average Number Non conforming, k Ri i =1 p = _________ k Ni i =1 Sigma (Standard deviation) SNP = ( N p (1 − p )) Center Line and Control Limits Calculate the Control limits : GFK-1413E p Center Line ( CLNP ) : N Upper Control Limit (UCLNP) : CLNP + 3 SNP Lower Control Limit (LCLNP) : MAX(0,(CLNP – 3 SNP)) G-1 Appendix H - C Chart Calculations C Chart Calculations The C chart measures the number of non-conformities (discrepancies or defects) in an inspection lot.The C chart requires a constant sample size. Data Available N=1 R(1..K) = Number of defects in each subgroup K = Inspection Quantity To be calculated : Process Average Number Non conformities, k Ri i =1 c = _________ k Sigma SC = c Center Line and Control Limits Calculate the Control limits GFK-1413E Center Line ( CLC ) : c Upper Control Limit (UCLC) : CLC + 3 SC Lower Control Limit (LCLC) : MAX(0,(CLC – 3 SC)) H-1 Appendix I - U Chart Calculations U Chart Calculations The U chart measures the number of non-conformities per inspection unit in subgroups, which can have varying sample sizes. It is similar to C chart except that the number of non-conformities is expressed on a per unit basis. Data Available N = Subgroup size T(1..K) = Total produced K = Inspection Quantity D(1..K) = Total Defects in sample To be calculated : Process Average Non conformities Per Unit, k Ui i =1 u = _________ U(1..K) where UI = DI / TI K Sigma (Standard deviation ) U SU = GFK-1413E ____ N I-1 Center Line and Control Limits Calculate the Control limits : I-2 Center Line ( CLU ) : u Upper Control Limit (UCLU) : CLU + 3 SU Lower Control Limit (LCLU) : MAX(0,(CLU – 3 SU)) CIMPLICITY SPC Operation Manual–December 2000 GFK-1413E Appendix J – Upgrading Quality Charts to Enhanced SPC Charts Upgrade Quality Charts to Enhanced SPC Charts You must upgrade your existing Quality Charts if one of the two items listed below is true: Charts were created using a version of CIMPLICITY HMI prior to v3.1 Charts were created using CIMPLICITY HMI v3.1, but you did not purchase and install the Enhanced SPC software (IC646NSP000A) prior to creating the charts If you are currently using CIMPLICITY HMI v3.2 or later, and you attempt to display a screen containing one of these charts, you will see a message indicating that the charts must upgraded. Before beginning the upgrade, make sure you: back up all necessary CIMPLICITY HMI projects, as the upgrade procedure will alter both your screens and your project. verify that an SPC ODBC data source exists. See "Creating the SPC Data Soiurce" for additional information. GFK-1413E J-1 Starting the Upgrade Procedure To start the upgrade procedure: 1 From your Windows desktop, press Start. 2. Select Programs>CIMPLICITY>HMI>Workbench to open the Workbench window. 3. Click File on the menu bar. 4. Select Open to display the Open window. 5. Navigate to your SPC project. 6. Double-click on the project icon in the window to display it in the Workbench. 7. Click Tools on the menu bar. 8. Select Upgrade Old SPC Charts. 9. Follows the prompts to upgrade the charts. Tip: To open a project quickly in the Workbench, create a shortcut on your Windows desktop. What Happens during the Upgrade Procedure? When you upgrade your old SPC charts to the latest version of the software, you will be prompted for information in order to facilitate the transition. The following list explains what happens during the upgrade procedure. The upgrade procedure begins by prompting you for an ODBC data source for storing the results of intermediate SPC calculations. The ODBC data source is where the SPC data collector process will store its data. After prompting for an ODBC data source, the upgrade procedure searches through all CimView screens, starting in the directory you specify, and recursing through all its subdirectories. As the utility finds references to old style Quality Charts in these screens, it prompts you for a Product Name and QC Name for each of the charts. Then it replaces the charts. Finally, the upgrade procedure generates a single SPC configuration file called SPC1.SPC. It places this configuration file in your project’s SPC directory. All charts in the project need to know the location of this configuration file. The upgrade procedure takes care of this for existing charts that it upgrades. Caution: Do not move, rename, or delete the SPC1.SPC file. When you add a new chart you will need to select the SPC1.SPC file as the group file in the chart's General property page. The configuration file tells chart what quality characteristics are available and where to find the data. The data collection process also uses this configuration file to know what data to collect, and on which data source to log results. J-2 CIMPLICITY SPC Operation Manual–December 2000 GFK-1413E Index Logged collection 4-45 Attributes Quality Characteristic Properties Limits - SPC configuration 4-48 Auto Recalculation for Control Limits 4-22, 4-49 Axis Properties SPC chart 5-8 B A About SPC 1-2 ActiveX Methods 5-12 ActiveX Methods and Properties 5-12 Adding Attribute quality characteristics 4-40 Adding a New Defect Category 4-68 Defect group 4-65 Product 4-9 Variable quality characteristic 4-12 Alarm Numbers 4-73 Alarms Setpoint 4-29, 4-56 Setting 4-29, 4-56 SPC Administration 4-73 Alarms and Setpoints for control tests 4-29, 4-56 Attribute No collection 4-47 Point Collection 4-43 Attribute Control Test 1 – Beyond upper-lower limits 4-59 2 – Same side of center line 4-60 3 – Consecutive subgroups in a row 4-60 4 – Alternating up and down 4-61 5 – In a row in – beyond A 4-61 6 – In a row in – beyond B 4-62 7 – In a row in C 4-62 8 – In a row beyond C 4-63 Attribute Control Test 0 – Specification limit test 4-59 Attribute QC Data Manual data entry, SPC ActiveX control 6-4 Attribute Quality Characteristics 4-39 Adding 4-40 General 4-41 Attributes Control limits 4-48 GFK-1413E Bar chart properties SPC chart 5-9 Bar Chart Properties SPC chart 5-9 Batch ID Chart properties 5-4, 5-5 Begin Configuration 4-4 C C Chart Description 2-9 C Chart Calculations H-1 Changing the Date/Time Format 5-11 Chart factors for control limits Xbar-R charts A-1 Xbar-S charts A-2 Chart properties Batch ID 5-4, 5-5 Group 5-4 Histogram 5-9, 5-10 Product 5-4, 5-5 QC 5-4 Update interval 5-5 Chart Properties SPC chart 5-5 Chart Types SPC 2-4 CimEdit Creating an SPC chart 5-1 Collection Attribute– point 4-43 Attributes – logged 4-45 Defect category - logged 4-71 Defect category – point 4-70 Variable – logged 4-19 Variable– point 4-17 Collection Properties Defect category - SPC configuration 4-70 Variable quality characteristics - SPC 4-16 Components of SPC 1-3 Configuration Building 4-5 Control Limits Attributes 4-48 Auto recalculation 4-22, 4-49 v Control Test Exclusion Mode 4-36 Control Tests Alarms and setpoint 4-29, 4-56 Criteria for Attribute Control Tests 4-58 Criteria for Variable Control Tests 4-31 D Date/Time Changing 5-11 Defect Categories SPC configuration 4-68 Defect Category Adding 4-68 Logged collection 4-71 No collection 4-72 Point collection 4-70 Defect Category Properties Collection - SPC configuration 4-70 General - SPC configuration 4-69 Defect Folder Defining properties 4-66 SPC 4-75 Defect Folder Properties SPC configuration 4-65 Defect Group Adding 4-65 Defect QC Data Manual data entry, SPC ActiveX control 6-6 Defining Defect folder properties 4-66 Product properties 4-10 Display Attributes Changing - SPC configuration 4-76 Displaying Test Results SPC ActiveX control 6-2 Document Tools 4-74 Document Tree SPC 4-74 E Enhanced Features 1-3 Exclusion Mode Control test 4-36 Toggle 4-36 Finding a Product/Quality Characteristic SPC configuration 4-78 General Properties vi H Histogram chart Properties 5-9, 5-10 Histogram Chart Description 2-6 Histogram Chart Calculations E-1 HTML Code Embedding SPC chart in web page 5-11 L Limits Properties Attributes quality characteristics -SPC configuration 4-48 Variable quality characteristics -SPC configuration 4-21 Lines Properties SPC chart 5-7 Logged Collection Attributes 4-45 Defect Category 4-71 Variable 4-19 M Manual Data Entry Attribute QC data 6-4 Defect QC data 6-6 SPC ActiveX control 6-3 Variable QC data 6-3 Methods ActiveX 5-12 N F G Defect category - SPC configuration 4-69 SPC chart 5-4 Variable quality characteristics - SPC configuration 4-12 Getting Started SPC ActiveX control 5-1 Group Chart properties 5-4 New Product Adding 4-9 Defining properties 4-10 New Variable Quality Characteristic 4-12 No Collection For a defect category 4-72 For an attribute 4-47 nP Chart Description 2-8 nP Chart Calculations G-1 CIMPLICITY SPC Operation Manual-December 2000 GFK-1413E SPC chart 5-10 Reports SPC 2-11 Runtime Functions SPC ActiveX control 6-1 O Opening a New Document 4-4 Operation Overview SPC 2-3 Overview SPC analysis 2-1 Overview of Data Configuration Steps 4-2 S S chart Center line calculation D-2 Control limit calculations D-2 Sampling Parameters Using points 4-13 Using values 4-15 Setpoint Alarm 4-29, 4-56 Setting Alarms for Attribute Quality Characteristics 4-56 Setting Alarms for Variable Quality Characteristics 4-29 SPC About 1-2 Administration Alarms 4-73 Components 1-3 Configuration, Quick start 1-5 Control Test Exclusion Mode 4-36 Defect folder in the document tree 4-75 Features 1-3 Operation overview 2-3 Product folder in document tree 4-75 Quick start configuration 1-5 R chart, Center line calculation C-2 R chart, Control limit calculations C-2 S chart, Center line calculation D-2 S chart, Control limit calculations D-2 Suggested Readings 2-2 Upgrading charts J-1 What happens? J-2 Upgrading Charts, Procedure J-2 Upgrading old charts 1-4 XBar-R chart, Center line calculation C-1 XBar-R chart, Control limit calculations C-1 XbarRR chart factors for control limits A-1 Xbar-S chart factors for control limits A-2 XBar-S chart, Center line calculation D-1 XBar-S chart, Control limit calculations D-2 X-Individual chart, Center line calculation B-1 X-Individuals chart, Control limit calculations B-1 SPC ActiveX Control Displaying test results 6-2 Getting started 5-1 Manual data entry 6-3 Manual data entry, Attribute QC data 6-4 Manual data entry, Defect QC data 6-6 P P Chart Description 2-7 P Chart Calculations F-1 Pareto Chart Description 2-10 Point Collection Attribute 4-43 Defect Category 4-70 Variable 4-17 Points Control Limits 4-25, 4-52 Procedure for Upgrading SPC Charts J-2 Product Adding 4-9 Chart properties 5-4, 5-5 Properties - defining 4-10 Product Folder SPC 4-75 Products SPC configuration 4-9 Properties SPC chart 5-3, 5-5 Q QC Chart properties 5-4 Quality Data Charts C Chart, description 2-9 Histogram chart, description 2-6 nP Chart, description 2-8 P Chart, description 2-7 U Chart, description 2-9 XBar-R chart, description 2-5 XBar-S chart, description 2-5 X-Individual chart, description 2-4 Quick start SPC configuration 1-5 R R chart Center line calculation C-2 Control limit calculations C-2 Report Properties GFK-1413E Index vii Manual data entry, Variable QC data 6-3 Runtime functions 6-1 SPC Administration Alarms 4-73 SPC Analysis Overview 2-1 SPC chart Bar chart properties 5-9 Configuring properties 5-5 SPC Chart Axis properties 5-8 Bar chart properties 5-9 Chart properties 5-5 Configuring properties 5-3 Creating in a web page 5-11 Creating in CimEdit 5-1 General properties 5-4 Lines properties 5-7 Report properties 5-10 SPC Chart Types 2-4 C Chart, Description 2-9 Histogram chart, Description 2-6 nP Chart, Description 2-8 P Chart, Description 2-7 Pareto chart, Description 2-10 U Chart, Description 2-9 XBar-R chart, Description 2-5 XBar-S chart, Description 2-5 X-Individual chart, Description 2-4 SPC Charts C Chart Calculations H-1 Histogram Chart Calculations E-1 nP Chart Calculations G-1 P Chart Calculations F-1 U Chart Calculations I-1 XBar-R Chart Calculations C-1 XBar-S Chart Calculations D-1 X-Individual Chart Calculations B-1 SPC configuration Attribute quality characteristic properties - Limits 4-48 Products 4-9 Variable quality characteristic properties - Collection 4-16 Variable quality characteristic properties - Limits 4-21 SPC Configuration Adding a variable 4-12 Attribute quality characteristics 4-39 Changing display attributes 4-76 Defect categories 4-68 Defect category properties - General 4-69 Defect category properties -Collection 4-70 Defect folder properties 4-65 Finding a product/quality characteristic 4-78 viii Variable quality characteristic properties - general 4-12 SPC datasource Creating 3-1 SPC Document Opening 4-4 SPC Reports 2-11 Suggested Readings SPC 2-2 T Time/Date Changing 5-11 U U Chart Description 2-9 U Chart Calculations I-1 Update interval Chart properties 5-5 Upgrading old SPC charts 1-4 Upgrading SPC Charts J-1 Procedure J-2 What happens? J-2 Using Points to Specify Sampling parameters 4-13 Using Values to Specify Sampling parameters 4-15 V Variable Logged collection 4-19 Point Collection 4-17 Variable Control Test 1 – Beyond upper-lower limits 4-32 2 – Same side of center line 4-32 3 – Consecutive subgroups in a row 4-32 4 – Alternating up and down 4-33 5 – In a row in – beyond A 4-33 6 – In a row in – beyond B 4-34 7 – In a row in C 4-34 8 – In a row beyond C 4-35 Variable QC Data Manual data entry, SPC ActiveX control 6-3 Variable Quality Characteristic Adding 4-12 Variable Quality Characteristic Properties Collection - SPC configuration 4-16 General - SPC configuration 4-12 Limits - SPC configuration 4-21 CIMPLICITY SPC Operation Manual-December 2000 GFK-1413E W Web Page Creating SPC charts 5-11 X Xbar-R chart Center line calculation C-1 XBar-R chart Control limit calculations C-1 XBar-R Chart Description 2-5 XBar-R Chart Calculations C-1 XBar-R chart factors for control limits A-1 Xbar-S chart Center line calculation D-1 XBar-S chart Control limit calculations D-2 XBar-S Chart Description 2-5 XBar-S Chart Calculations D-1 XBar-S chart factors for control limits A-2 X-Individual chart Center line calculation B-1 Control limit calculations B-1 X-Individual Chart Description 2-4 X-Individual Chart Calculations B-1 GFK-1413E Index ix