1
User’s Guide
Agilent Technologies E4406A VSA Series
Transmitter Tester
Manufacturing Part Number: E4406-90304
Supersedes E4406-90177
Printed in USA
May 2007
© Copyright 1999 - 2001, 2007 Agilent Technologies, Inc.
Notice
The information contained in this document is subject to change
without notice.
Agilent Technologies makes no warranty of any kind with regard to this
material, including but not limited to, the implied warranties of
merchantability and fitness for a particular purpose. Agilent
Technologies shall not be liable for errors contained herein or for
incidental or consequential damages in connection with the furnishing,
performance, or use of this material.
Technology Licenses
The hardware and/or software described in this document are furnished
under a license and may be used or copied only in accordance with the
terms of such license.
Restricted Rights Legend
If software is for use in the performance of a U.S. Government prime
contract or subcontract, Software is delivered and licensed as
“Commercial computer software” as defined in DFAR 252.227-7014
(June 1995), or as a “commercial item” as defined in FAR 2.101(a) or as
“Restricted computer software” as defined in FAR 52.227-19 (June
1987) or any equivalent agency regulation or contract clause. Use,
duplication or disclosure of Software is subject to Agilent Technologies’
standard commercial license terms, and non-DOD Departments and
Agencies of the U.S. Government will receive no greater than Restricted
Rights as defined in FAR 52.227-19(c)(1-2) (June 1987). U.S.
Government users will receive no greater than Limited Rights as
defined in FAR 52.227-14 (June 1987) or DFAR 252.227-7015 (b)(2)
(November 1995), as applicable in any technical data.
2
Safety Information
The following safety symbols are used throughout this manual.
Familiarize yourself with the symbols and their meaning before
operating this instrument.
WARNING
Warning denotes a hazard. It calls attention to a procedure
which, if not correctly performed or adhered to, could result in
injury or loss of life. Do not proceed beyond a warning note
until the indicated conditions are fully understood and met.
CAUTION
Caution denotes a hazard. It calls attention to a procedure that, if not
correctly performed or adhered to, could result in damage to or
destruction of the instrument. Do not proceed beyond a caution sign
until the indicated conditions are fully understood and met.
NOTE
Note calls out special information for the user’s attention. It provides
operational information or additional instructions of which the user
should be aware.
WARNING
This is a Safety Class 1 Product (provided with a protective
earth ground incorporated in the power cord). The mains plug
shall be inserted only in a socket outlet provided with a
protected earth contact. Any interruption of the protective
conductor inside or outside of the product is likely to make the
product dangerous. Intentional interruption is prohibited.
WARNING
No operator serviceable parts inside. Refer servicing to
qualified personnel. To prevent electrical shock do not remove
covers.
CAUTION
Always use the three-prong AC power cord supplied with this product.
Failure to ensure adequate grounding may cause product damage.
3
Where to Find the Latest Information
Documentation is updated periodically. For the latest information about
Agilent Technologies E4406 VSA Series Transmitter Tester, including
firmware upgrades and application information, please visit the
following Internet URL:
http://www.agilent.com/find/vsa
4
Contents
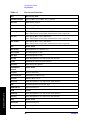
2. Using System Features
Using System Keys. . . . . . . . . . . . . . . . . . . . . . . . . . . . . . . . . . . . . . . . . . . . . . . . . . . . . . . . . . .
Install and Uninstall. . . . . . . . . . . . . . . . . . . . . . . . . . . . . . . . . . . . . . . . . . . . . . . . . . . . . . . .
Key Locations . . . . . . . . . . . . . . . . . . . . . . . . . . . . . . . . . . . . . . . . . . . . . . . . . . . . . . . . . . . . . . .
Using Print and Print Setup Functions . . . . . . . . . . . . . . . . . . . . . . . . . . . . . . . . . . . . . . . . . .
Printing a Displayed Screen. . . . . . . . . . . . . . . . . . . . . . . . . . . . . . . . . . . . . . . . . . . . . . . . . .
Printing a Screen Image to a File on A: or C: Drives . . . . . . . . . . . . . . . . . . . . . . . . . . . . . .
Using File and Save Keys . . . . . . . . . . . . . . . . . . . . . . . . . . . . . . . . . . . . . . . . . . . . . . . . . . . . .
Loading a State . . . . . . . . . . . . . . . . . . . . . . . . . . . . . . . . . . . . . . . . . . . . . . . . . . . . . . . . . . . .
Saving a State . . . . . . . . . . . . . . . . . . . . . . . . . . . . . . . . . . . . . . . . . . . . . . . . . . . . . . . . . . . . .
Using the Alpha Editor Keys . . . . . . . . . . . . . . . . . . . . . . . . . . . . . . . . . . . . . . . . . . . . . . . . .
Using Input/Output Configuration Keys . . . . . . . . . . . . . . . . . . . . . . . . . . . . . . . . . . . . . . . . .
Configuring I/O . . . . . . . . . . . . . . . . . . . . . . . . . . . . . . . . . . . . . . . . . . . . . . . . . . . . . . . . . . . .
File System . . . . . . . . . . . . . . . . . . . . . . . . . . . . . . . . . . . . . . . . . . . . . . . . . . . . . . . . . . . . . . .
Reference . . . . . . . . . . . . . . . . . . . . . . . . . . . . . . . . . . . . . . . . . . . . . . . . . . . . . . . . . . . . . . . . .
Using System Configuration and Alignment Keys. . . . . . . . . . . . . . . . . . . . . . . . . . . . . . . . . .
Restore System Defaults. . . . . . . . . . . . . . . . . . . . . . . . . . . . . . . . . . . . . . . . . . . . . . . . . . . . .
Show Errors. . . . . . . . . . . . . . . . . . . . . . . . . . . . . . . . . . . . . . . . . . . . . . . . . . . . . . . . . . . . . . .
Show System . . . . . . . . . . . . . . . . . . . . . . . . . . . . . . . . . . . . . . . . . . . . . . . . . . . . . . . . . . . . . .
System (Local) . . . . . . . . . . . . . . . . . . . . . . . . . . . . . . . . . . . . . . . . . . . . . . . . . . . . . . . . . . . . .
Alignment . . . . . . . . . . . . . . . . . . . . . . . . . . . . . . . . . . . . . . . . . . . . . . . . . . . . . . . . . . . . . . . .
Table of Contents
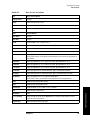
1. Getting Started
What Documentation Comes with the E4406A VSA Series Transmitter Tester . . . . . . . . . .
Why Aren’t All the Personality Options Loaded in Memory?. . . . . . . . . . . . . . . . . . . . . . . .
URL for the Latest VSA Transmitter Tester Update . . . . . . . . . . . . . . . . . . . . . . . . . . . . . .
Understanding Digital Communications Measurements . . . . . . . . . . . . . . . . . . . . . . . . . . .
Updating the Firmware . . . . . . . . . . . . . . . . . . . . . . . . . . . . . . . . . . . . . . . . . . . . . . . . . . . . .
The 3 Steps to Set Up and Make Measurements . . . . . . . . . . . . . . . . . . . . . . . . . . . . . . . . . . .
Front Panel Keys Context Dependency . . . . . . . . . . . . . . . . . . . . . . . . . . . . . . . . . . . . . . . . . .
Front Panel Description. . . . . . . . . . . . . . . . . . . . . . . . . . . . . . . . . . . . . . . . . . . . . . . . . . . . . . .
Rear Panel Description . . . . . . . . . . . . . . . . . . . . . . . . . . . . . . . . . . . . . . . . . . . . . . . . . . . . . . .
Display Annotation . . . . . . . . . . . . . . . . . . . . . . . . . . . . . . . . . . . . . . . . . . . . . . . . . . . . . . . . . .
Installing Optional Measurement Personalities . . . . . . . . . . . . . . . . . . . . . . . . . . . . . . . . . . .
Do You Have Enough Memory to Load All Your Personality Options? . . . . . . . . . . . . . . . .
How to Predict Your Memory Requirements . . . . . . . . . . . . . . . . . . . . . . . . . . . . . . . . . . . . .
Loading an Optional Measurement Personality . . . . . . . . . . . . . . . . . . . . . . . . . . . . . . . . . .
Obtaining and Installing a License Key . . . . . . . . . . . . . . . . . . . . . . . . . . . . . . . . . . . . . . . .
Viewing a License Key . . . . . . . . . . . . . . . . . . . . . . . . . . . . . . . . . . . . . . . . . . . . . . . . . . . . . .
Using the Uninstall Key on E4406A . . . . . . . . . . . . . . . . . . . . . . . . . . . . . . . . . . . . . . . . . . .
Ordering Optional Measurement Personalities . . . . . . . . . . . . . . . . . . . . . . . . . . . . . . . . . .
Cables for Connecting to the Serial Port
(RS-232) . . . . . . . . . . . . . . . . . . . . . . . . . . . . . . . . . . . . . . . . . . . . . . . . . . . . . . . . . . . . . . . . . . .
Safety Considerations . . . . . . . . . . . . . . . . . . . . . . . . . . . . . . . . . . . . . . . . . . . . . . . . . . . . . . . .
Instrument Installation . . . . . . . . . . . . . . . . . . . . . . . . . . . . . . . . . . . . . . . . . . . . . . . . . . . . .
Instrument Operation and Maintenance. . . . . . . . . . . . . . . . . . . . . . . . . . . . . . . . . . . . . . . .
17
18
19
19
20
21
22
26
32
35
38
38
40
41
42
42
43
44
45
51
51
52
56
56
57
67
67
69
71
71
71
72
73
73
75
75
77
77
77
78
80
81
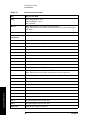
3. Setting the Mode
5
Table of Contents
Contents
Selecting a Mode . . . . . . . . . . . . . . . . . . . . . . . . . . . . . . . . . . . . . . . . . . . . . . . . . . . . . . . . . . . . .86
Mode Setup . . . . . . . . . . . . . . . . . . . . . . . . . . . . . . . . . . . . . . . . . . . . . . . . . . . . . . . . . . . . . . . . .87
Input Keys . . . . . . . . . . . . . . . . . . . . . . . . . . . . . . . . . . . . . . . . . . . . . . . . . . . . . . . . . . . . . . . .87
Trigger Keys . . . . . . . . . . . . . . . . . . . . . . . . . . . . . . . . . . . . . . . . . . . . . . . . . . . . . . . . . . . . . . .89
Selecting the Frequency/Channel . . . . . . . . . . . . . . . . . . . . . . . . . . . . . . . . . . . . . . . . . . . . . .90
4. Making Measurements
Basic Measurements . . . . . . . . . . . . . . . . . . . . . . . . . . . . . . . . . . . . . . . . . . . . . . . . . . . . . . . . . .92
The 3 Steps to Set Up and Make Measurements. . . . . . . . . . . . . . . . . . . . . . . . . . . . . . . . . . . .93
Preparing for Measurements . . . . . . . . . . . . . . . . . . . . . . . . . . . . . . . . . . . . . . . . . . . . . . . . . . .94
Using Measure Keys . . . . . . . . . . . . . . . . . . . . . . . . . . . . . . . . . . . . . . . . . . . . . . . . . . . . . . . .94
Measurement Control . . . . . . . . . . . . . . . . . . . . . . . . . . . . . . . . . . . . . . . . . . . . . . . . . . . . . . .94
Measurement Setup . . . . . . . . . . . . . . . . . . . . . . . . . . . . . . . . . . . . . . . . . . . . . . . . . . . . . . . . .94
Changing the View . . . . . . . . . . . . . . . . . . . . . . . . . . . . . . . . . . . . . . . . . . . . . . . . . . . . . . . . . .96
Using Markers . . . . . . . . . . . . . . . . . . . . . . . . . . . . . . . . . . . . . . . . . . . . . . . . . . . . . . . . . . . . .98
Spectrum (Frequency Domain) Measurements . . . . . . . . . . . . . . . . . . . . . . . . . . . . . . . . . . . .101
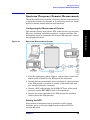
Configuring the Measurement System . . . . . . . . . . . . . . . . . . . . . . . . . . . . . . . . . . . . . . . . .101
Setting the BTS . . . . . . . . . . . . . . . . . . . . . . . . . . . . . . . . . . . . . . . . . . . . . . . . . . . . . . . . . . .101
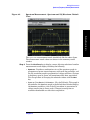
Measurement Procedure . . . . . . . . . . . . . . . . . . . . . . . . . . . . . . . . . . . . . . . . . . . . . . . . . . . .102
Waveform (Time Domain) Measurements . . . . . . . . . . . . . . . . . . . . . . . . . . . . . . . . . . . . . . . .112
Configuring the Measurement System . . . . . . . . . . . . . . . . . . . . . . . . . . . . . . . . . . . . . . . . .112
Setting the BTS . . . . . . . . . . . . . . . . . . . . . . . . . . . . . . . . . . . . . . . . . . . . . . . . . . . . . . . . . . .113
Measurement Procedure . . . . . . . . . . . . . . . . . . . . . . . . . . . . . . . . . . . . . . . . . . . . . . . . . . . .113
Adjacent Channel Power (ACP) Measurements . . . . . . . . . . . . . . . . . . . . . . . . . . . . . . . . . . .125
Configuring the Measurement System . . . . . . . . . . . . . . . . . . . . . . . . . . . . . . . . . . . . . . . . .125
Setting the MS . . . . . . . . . . . . . . . . . . . . . . . . . . . . . . . . . . . . . . . . . . . . . . . . . . . . . . . . . . . .125
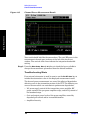
Measurement Procedure . . . . . . . . . . . . . . . . . . . . . . . . . . . . . . . . . . . . . . . . . . . . . . . . . . . .126
Troubleshooting Hints . . . . . . . . . . . . . . . . . . . . . . . . . . . . . . . . . . . . . . . . . . . . . . . . . . . . . .128
Channel Power Measurements . . . . . . . . . . . . . . . . . . . . . . . . . . . . . . . . . . . . . . . . . . . . . . . . .130
Configuring the Measurement System . . . . . . . . . . . . . . . . . . . . . . . . . . . . . . . . . . . . . . . . .130
Setting Up the MS . . . . . . . . . . . . . . . . . . . . . . . . . . . . . . . . . . . . . . . . . . . . . . . . . . . . . . . . .131
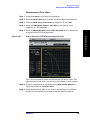
Measurement Procedure . . . . . . . . . . . . . . . . . . . . . . . . . . . . . . . . . . . . . . . . . . . . . . . . . . . .131
Troubleshooting Hints . . . . . . . . . . . . . . . . . . . . . . . . . . . . . . . . . . . . . . . . . . . . . . . . . . . . . .132
Making Power Stat CCDF Measurements. . . . . . . . . . . . . . . . . . . . . . . . . . . . . . . . . . . . . . . .133
Configuring the Measurement System . . . . . . . . . . . . . . . . . . . . . . . . . . . . . . . . . . . . . . . . .133
Setting the MS . . . . . . . . . . . . . . . . . . . . . . . . . . . . . . . . . . . . . . . . . . . . . . . . . . . . . . . . . . . .134
Measurement Procedure . . . . . . . . . . . . . . . . . . . . . . . . . . . . . . . . . . . . . . . . . . . . . . . . . . . .135
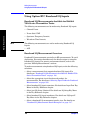
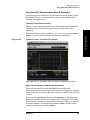
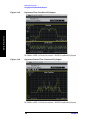
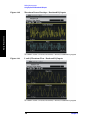
Using Option B7C Baseband I/Q Inputs . . . . . . . . . . . . . . . . . . . . . . . . . . . . . . . . . . . . . . . . .136
Baseband I/Q Measurements Available for E4406A VSA Series Transmitter Tester . . . .136
Baseband I/Q Measurement Overview . . . . . . . . . . . . . . . . . . . . . . . . . . . . . . . . . . . . . . . . .136
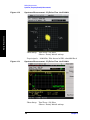
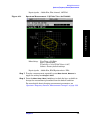
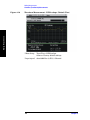
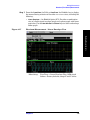
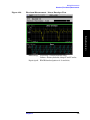
Baseband I/Q Measurement Result Examples . . . . . . . . . . . . . . . . . . . . . . . . . . . . . . . . . . .137
Service Measurements . . . . . . . . . . . . . . . . . . . . . . . . . . . . . . . . . . . . . . . . . . . . . . . . . . . . . . .141
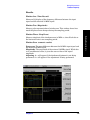
Making the Power vs. Time Measurement . . . . . . . . . . . . . . . . . . . . . . . . . . . . . . . . . . . . . . .142
Purpose . . . . . . . . . . . . . . . . . . . . . . . . . . . . . . . . . . . . . . . . . . . . . . . . . . . . . . . . . . . . . . . . . .142
Measurement Method . . . . . . . . . . . . . . . . . . . . . . . . . . . . . . . . . . . . . . . . . . . . . . . . . . . . . .142
Making the Measurement . . . . . . . . . . . . . . . . . . . . . . . . . . . . . . . . . . . . . . . . . . . . . . . . . . .142
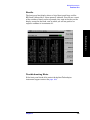
Results . . . . . . . . . . . . . . . . . . . . . . . . . . . . . . . . . . . . . . . . . . . . . . . . . . . . . . . . . . . . . . . . . .143
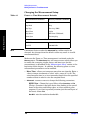
Changing the Measurement Setup . . . . . . . . . . . . . . . . . . . . . . . . . . . . . . . . . . . . . . . . . . . .144
Changing the View . . . . . . . . . . . . . . . . . . . . . . . . . . . . . . . . . . . . . . . . . . . . . . . . . . . . . . . . .145
6
Contents
146
146
146
146
147
148
148
148
148
149
150
150
150
150
150
152
152
152
153
153
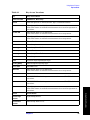
5. Key Reference
Instrument Front Panel Highlights . . . . . . . . . . . . . . . . . . . . . . . . . . . . . . . . . . . . . . . . . . . .
Selected E4406A VSA Front-Panel Features . . . . . . . . . . . . . . . . . . . . . . . . . . . . . . . . . . .
Front Panel Keys . . . . . . . . . . . . . . . . . . . . . . . . . . . . . . . . . . . . . . . . . . . . . . . . . . . . . . . . . . .
FREQUENCY Channel Key Menu . . . . . . . . . . . . . . . . . . . . . . . . . . . . . . . . . . . . . . . . . . .
Span X Scale Key Menu . . . . . . . . . . . . . . . . . . . . . . . . . . . . . . . . . . . . . . . . . . . . . . . . . . . .
AMPLITUDE Y Scale Key Menu . . . . . . . . . . . . . . . . . . . . . . . . . . . . . . . . . . . . . . . . . . . . .
MEASURE Key Menu. . . . . . . . . . . . . . . . . . . . . . . . . . . . . . . . . . . . . . . . . . . . . . . . . . . . . .
Meas Control Key Menu . . . . . . . . . . . . . . . . . . . . . . . . . . . . . . . . . . . . . . . . . . . . . . . . . . . .
Mode Setup Key Menu . . . . . . . . . . . . . . . . . . . . . . . . . . . . . . . . . . . . . . . . . . . . . . . . . . . . .
Trigger Key Menu . . . . . . . . . . . . . . . . . . . . . . . . . . . . . . . . . . . . . . . . . . . . . . . . . . . . . . . . .
Adjacent Channel Power (ACP) Keys . . . . . . . . . . . . . . . . . . . . . . . . . . . . . . . . . . . . . . . . . . .
Measurement Setup Key Menu . . . . . . . . . . . . . . . . . . . . . . . . . . . . . . . . . . . . . . . . . . . . . .
View/Trace Key Menu . . . . . . . . . . . . . . . . . . . . . . . . . . . . . . . . . . . . . . . . . . . . . . . . . . . . . .
Channel Power Keys . . . . . . . . . . . . . . . . . . . . . . . . . . . . . . . . . . . . . . . . . . . . . . . . . . . . . . . .
Measurement Setup Key Menu . . . . . . . . . . . . . . . . . . . . . . . . . . . . . . . . . . . . . . . . . . . . . .
AMPLITUDE Y Scale Key Menu . . . . . . . . . . . . . . . . . . . . . . . . . . . . . . . . . . . . . . . . . . . . .
Marker Key Menu . . . . . . . . . . . . . . . . . . . . . . . . . . . . . . . . . . . . . . . . . . . . . . . . . . . . . . . . .
Spectrum (Frequency Domain) Keys. . . . . . . . . . . . . . . . . . . . . . . . . . . . . . . . . . . . . . . . . . . .
Meas Setup Key Menu . . . . . . . . . . . . . . . . . . . . . . . . . . . . . . . . . . . . . . . . . . . . . . . . . . . . .
View/Trace Key Menu . . . . . . . . . . . . . . . . . . . . . . . . . . . . . . . . . . . . . . . . . . . . . . . . . . . . . .
SPAN X Scale Key Menu . . . . . . . . . . . . . . . . . . . . . . . . . . . . . . . . . . . . . . . . . . . . . . . . . . .
AMPLITUDE Y Scale Key Menu . . . . . . . . . . . . . . . . . . . . . . . . . . . . . . . . . . . . . . . . . . . . .
Display Key Menu. . . . . . . . . . . . . . . . . . . . . . . . . . . . . . . . . . . . . . . . . . . . . . . . . . . . . . . . .
Marker Key Menu . . . . . . . . . . . . . . . . . . . . . . . . . . . . . . . . . . . . . . . . . . . . . . . . . . . . . . . . .
Peak Search Key . . . . . . . . . . . . . . . . . . . . . . . . . . . . . . . . . . . . . . . . . . . . . . . . . . . . . . . . . .
Waveform (Time Domain) Keys . . . . . . . . . . . . . . . . . . . . . . . . . . . . . . . . . . . . . . . . . . . . . . . .
Measurement Setup Key Menu . . . . . . . . . . . . . . . . . . . . . . . . . . . . . . . . . . . . . . . . . . . . . .
156
157
159
159
159
160
160
161
162
165
168
168
174
176
176
179
179
180
180
187
192
193
194
194
195
196
196
7
Table of Contents
Timebase Frequency . . . . . . . . . . . . . . . . . . . . . . . . . . . . . . . . . . . . . . . . . . . . . . . . . . . . . . . .
Purpose . . . . . . . . . . . . . . . . . . . . . . . . . . . . . . . . . . . . . . . . . . . . . . . . . . . . . . . . . . . . . . . . .
Measurement Method . . . . . . . . . . . . . . . . . . . . . . . . . . . . . . . . . . . . . . . . . . . . . . . . . . . . . .
Test Setup . . . . . . . . . . . . . . . . . . . . . . . . . . . . . . . . . . . . . . . . . . . . . . . . . . . . . . . . . . . . . . .
Results . . . . . . . . . . . . . . . . . . . . . . . . . . . . . . . . . . . . . . . . . . . . . . . . . . . . . . . . . . . . . . . . . .
50 MHz Amplitude . . . . . . . . . . . . . . . . . . . . . . . . . . . . . . . . . . . . . . . . . . . . . . . . . . . . . . . . .
Purpose . . . . . . . . . . . . . . . . . . . . . . . . . . . . . . . . . . . . . . . . . . . . . . . . . . . . . . . . . . . . . . . . .
Measurement Method . . . . . . . . . . . . . . . . . . . . . . . . . . . . . . . . . . . . . . . . . . . . . . . . . . . . . .
Test Setup . . . . . . . . . . . . . . . . . . . . . . . . . . . . . . . . . . . . . . . . . . . . . . . . . . . . . . . . . . . . . . .
Results . . . . . . . . . . . . . . . . . . . . . . . . . . . . . . . . . . . . . . . . . . . . . . . . . . . . . . . . . . . . . . . . . .
Sensors . . . . . . . . . . . . . . . . . . . . . . . . . . . . . . . . . . . . . . . . . . . . . . . . . . . . . . . . . . . . . . . . . . .
Purpose . . . . . . . . . . . . . . . . . . . . . . . . . . . . . . . . . . . . . . . . . . . . . . . . . . . . . . . . . . . . . . . . .
Measurement Method . . . . . . . . . . . . . . . . . . . . . . . . . . . . . . . . . . . . . . . . . . . . . . . . . . . . . .
Test Setup . . . . . . . . . . . . . . . . . . . . . . . . . . . . . . . . . . . . . . . . . . . . . . . . . . . . . . . . . . . . . . .
Results . . . . . . . . . . . . . . . . . . . . . . . . . . . . . . . . . . . . . . . . . . . . . . . . . . . . . . . . . . . . . . . . . .
Front Panel Test . . . . . . . . . . . . . . . . . . . . . . . . . . . . . . . . . . . . . . . . . . . . . . . . . . . . . . . . . . . .
Purpose . . . . . . . . . . . . . . . . . . . . . . . . . . . . . . . . . . . . . . . . . . . . . . . . . . . . . . . . . . . . . . . . .
Test Setup . . . . . . . . . . . . . . . . . . . . . . . . . . . . . . . . . . . . . . . . . . . . . . . . . . . . . . . . . . . . . . .
Results . . . . . . . . . . . . . . . . . . . . . . . . . . . . . . . . . . . . . . . . . . . . . . . . . . . . . . . . . . . . . . . . . .
Troubleshooting Hints . . . . . . . . . . . . . . . . . . . . . . . . . . . . . . . . . . . . . . . . . . . . . . . . . . . . .
Table of Contents
Contents
View/Trace Key Menu . . . . . . . . . . . . . . . . . . . . . . . . . . . . . . . . . . . . . . . . . . . . . . . . . . . . . .202
SPAN X Scale Key Menu . . . . . . . . . . . . . . . . . . . . . . . . . . . . . . . . . . . . . . . . . . . . . . . . . . . .206
AMPLITUDE Y Scale Key Menu . . . . . . . . . . . . . . . . . . . . . . . . . . . . . . . . . . . . . . . . . . . . .208
Display Key Menu . . . . . . . . . . . . . . . . . . . . . . . . . . . . . . . . . . . . . . . . . . . . . . . . . . . . . . . . .210
Marker Key Menu . . . . . . . . . . . . . . . . . . . . . . . . . . . . . . . . . . . . . . . . . . . . . . . . . . . . . . . . .210
Peak Search Key. . . . . . . . . . . . . . . . . . . . . . . . . . . . . . . . . . . . . . . . . . . . . . . . . . . . . . . . . . .211
Power Stat CCDF Keys . . . . . . . . . . . . . . . . . . . . . . . . . . . . . . . . . . . . . . . . . . . . . . . . . . . . . . .212
Meas Setup Key Menu . . . . . . . . . . . . . . . . . . . . . . . . . . . . . . . . . . . . . . . . . . . . . . . . . . . . . .212
6. Concepts
Adjacent Channel Power (ACP) Measurement Concepts . . . . . . . . . . . . . . . . . . . . . . . . . . . .218
Purpose . . . . . . . . . . . . . . . . . . . . . . . . . . . . . . . . . . . . . . . . . . . . . . . . . . . . . . . . . . . . . . . . . .218
Measurement Method . . . . . . . . . . . . . . . . . . . . . . . . . . . . . . . . . . . . . . . . . . . . . . . . . . . . . .218
Channel Power Measurement Concepts . . . . . . . . . . . . . . . . . . . . . . . . . . . . . . . . . . . . . . . . .219
Purpose . . . . . . . . . . . . . . . . . . . . . . . . . . . . . . . . . . . . . . . . . . . . . . . . . . . . . . . . . . . . . . . . . .219
Measurement Method . . . . . . . . . . . . . . . . . . . . . . . . . . . . . . . . . . . . . . . . . . . . . . . . . . . . . .219
Power Stat CCDF Measurement Concepts . . . . . . . . . . . . . . . . . . . . . . . . . . . . . . . . . . . . . . .220
Purpose . . . . . . . . . . . . . . . . . . . . . . . . . . . . . . . . . . . . . . . . . . . . . . . . . . . . . . . . . . . . . . . . . .220
Measurement Method . . . . . . . . . . . . . . . . . . . . . . . . . . . . . . . . . . . . . . . . . . . . . . . . . . . . . .221
Spectrum (Frequency Domain) Measurement Concepts. . . . . . . . . . . . . . . . . . . . . . . . . . . . .222
Purpose . . . . . . . . . . . . . . . . . . . . . . . . . . . . . . . . . . . . . . . . . . . . . . . . . . . . . . . . . . . . . . . . . .222
Measurement Method . . . . . . . . . . . . . . . . . . . . . . . . . . . . . . . . . . . . . . . . . . . . . . . . . . . . . .222
Troubleshooting Hints . . . . . . . . . . . . . . . . . . . . . . . . . . . . . . . . . . . . . . . . . . . . . . . . . . . . . .222
Waveform (Time Domain) Measurement Concepts . . . . . . . . . . . . . . . . . . . . . . . . . . . . . . . . .223
Purpose . . . . . . . . . . . . . . . . . . . . . . . . . . . . . . . . . . . . . . . . . . . . . . . . . . . . . . . . . . . . . . . . . .223
Measurement Method . . . . . . . . . . . . . . . . . . . . . . . . . . . . . . . . . . . . . . . . . . . . . . . . . . . . . .223
Baseband I/Q Inputs (Option B7C) Measurement Concepts . . . . . . . . . . . . . . . . . . . . . . . . .224
What are Baseband I/Q Inputs? . . . . . . . . . . . . . . . . . . . . . . . . . . . . . . . . . . . . . . . . . . . . . .224
What are Baseband I/Q Signals? . . . . . . . . . . . . . . . . . . . . . . . . . . . . . . . . . . . . . . . . . . . . . .225
Why Make Measurements at Baseband? . . . . . . . . . . . . . . . . . . . . . . . . . . . . . . . . . . . . . . .225
Selecting Input Probes for Baseband Measurements . . . . . . . . . . . . . . . . . . . . . . . . . . . . .225
Baseband I/Q Measurement Views . . . . . . . . . . . . . . . . . . . . . . . . . . . . . . . . . . . . . . . . . . . .228
Other Sources of Measurement Information . . . . . . . . . . . . . . . . . . . . . . . . . . . . . . . . . . . . . .231
Instrument Updates at www.agilent.com . . . . . . . . . . . . . . . . . . . . . . . . . . . . . . . . . . . . . . .231
7. If You Have a Problem
Problem Symptoms and Solutions . . . . . . . . . . . . . . . . . . . . . . . . . . . . . . . . . . . . . . . . . . . . . .234
Key or Feature Does Not Appear in Menu . . . . . . . . . . . . . . . . . . . . . . . . . . . . . . . . . . . . . .234
Frequency Unlock or External Reference Missing - Error Messages . . . . . . . . . . . . . . . . .235
LAN External Loopback Test Failed - Error Message . . . . . . . . . . . . . . . . . . . . . . . . . . . . .235
Instrument Fails Alignment - Error Message . . . . . . . . . . . . . . . . . . . . . . . . . . . . . . . . . . .235
Measurement Keys Do Not Appear after Pressing the Mode Key . . . . . . . . . . . . . . . . . . .236
Instrument Power-On Problem . . . . . . . . . . . . . . . . . . . . . . . . . . . . . . . . . . . . . . . . . . . . . . .236
LAN Communication Problem. . . . . . . . . . . . . . . . . . . . . . . . . . . . . . . . . . . . . . . . . . . . . . . .236
Instrument Keyboard is Locked . . . . . . . . . . . . . . . . . . . . . . . . . . . . . . . . . . . . . . . . . . . . . .236
Warranty Information . . . . . . . . . . . . . . . . . . . . . . . . . . . . . . . . . . . . . . . . . . . . . . . . . . . . . . . .237
Agilent Technologies Test and Measurement Support, Services, and Assistance . . . . . . . . .238
Returning Your Instrument to Agilent Technologies . . . . . . . . . . . . . . . . . . . . . . . . . . . . . .239
8
Contents
9
Table of Contents
8. Menu Maps
Basic Measurement Key Flow . . . . . . . . . . . . . . . . . . . . . . . . . . . . . . . . . . . . . . . . . . . . . . . . . 242
Table of Contents
Contents
10
List of Commands
11
List of Commands
10 MHz Out............................................................................................................................................ 75
50 MHz Amplitude...............................................................................................................................148
50 MHz Ref............................................................................................................................................. 87
Advanced ................................................................................................................................................ 94
Align 50 MHz Reference........................................................................................................................ 82
Align ADC .............................................................................................................................................. 82
Align All Now ......................................................................................................................................... 81
Align Current IF Flatness..................................................................................................................... 82
Align Current SysGain .......................................................................................................................... 82
Align IF .................................................................................................................................................. 82
Align RF ................................................................................................................................................. 82
Align Subsystem .................................................................................................................................... 81
Alignments ............................................................................................................................................. 81
Alpha Editor........................................................................................................................................... 72
Auto Align .............................................................................................................................................. 81
Auto Trig................................................................................................................................................. 89
Average ................................................................................................................................................... 95
Avg Bursts .............................................................................................................................................. 95
Avg Mode ................................................................................................................................................ 95
Avg Number ........................................................................................................................................... 95
Avg Type ................................................................................................................................................. 95
Band Power ............................................................................................................................................ 99
Basic .......................................................................................................................................................86
Burst .....................................................................................................................................................145
cdmaOne................................................................................................................................................. 86
Clear Error Queue(s) ............................................................................................................................. 77
Color Print.............................................................................................................................................. 67
Color Printer .......................................................................................................................................... 67
Config I/O ............................................................................................................................................... 73
Corrections ............................................................................................................................................. 82
Current ................................................................................................................................................... 97
Custom. .................................................................................................................................................. 67
Define Custom........................................................................................................................................ 67
Delay.......................................................................................................................................................89
Delta .......................................................................................................................................................99
Eject Page............................................................................................................................................... 67
Emulated GPIB Address ....................................................................................................................... 74
Emulated GPIB Logical Unit ................................................................................................................ 74
Emulated GPIB Name........................................................................................................................... 74
ESC ......................................................................................................................................................... 81
Ethernet Addr ........................................................................................................................................ 75
Ext Front ................................................................................................................................................ 90
Ext Rear ................................................................................................................................................. 90
File Location........................................................................................................................................... 69
File Location........................................................................................................................................... 69
Frame Timer .......................................................................................................................................... 90
Frame ..................................................................................................................................................... 96
Free Run................................................................................................................................................. 96
Freq Ref .................................................................................................................................................. 75
List of Commands
List of Commands
Front Panel Test...................................................................................................................................152
GPIB Address .........................................................................................................................................73
GSM ........................................................................................................................................................86
HCOPy Dest ...........................................................................................................................................69
Host Name..............................................................................................................................................74
I/Q Input Z..............................................................................................................................................88
IF Align...................................................................................................................................................87
Image ......................................................................................................................................................69
Input Atten .............................................................................................................................................88
Input Port ...............................................................................................................................................87
Instrument Logical Unit........................................................................................................................74
Instrument Name...................................................................................................................................74
Invert ......................................................................................................................................................69
IP Address ..............................................................................................................................................73
Landscape...............................................................................................................................................67
Language, ...............................................................................................................................................67
Level........................................................................................................................................................89
License Key ............................................................................................................................................42
Line .........................................................................................................................................................96
Load State ..............................................................................................................................................71
Log-Pwr Avg ...........................................................................................................................................96
Marker All Off ........................................................................................................................................99
Max Total Pwr ........................................................................................................................................88
Maximum Connections ..........................................................................................................................74
Maximum................................................................................................................................................96
Meas Time ............................................................................................................................................144
Minimum ................................................................................................................................................96
Noise .......................................................................................................................................................99
Normal ....................................................................................................................................................98
Offset.......................................................................................................................................................90
Orientation .............................................................................................................................................67
Orientation .............................................................................................................................................67
PCL3 .......................................................................................................................................................67
PCL5 .......................................................................................................................................................67
Peak Level ..............................................................................................................................................89
Period......................................................................................................................................................90
Portrait ...................................................................................................................................................67
Pos...........................................................................................................................................................89
Printer ....................................................................................................................................................69
Pwr Avg...................................................................................................................................................95
Pwr vs Time..........................................................................................................................................142
RBW Filter ...........................................................................................................................................144
Ref Position ............................................................................................................................................97
Ref Value.................................................................................................................................................97
Reference ................................................................................................................................................75
Reprint....................................................................................................................................................67
Res BW ...................................................................................................................................................95
Reset Offset Display...............................................................................................................................90
Restore Align Defaults...........................................................................................................................83
12
List of Commands
13
List of Commands
Restore Meas Defaults........................................................................................................................... 95
Resume ................................................................................................................................................... 94
RF Burst (Wideband) ............................................................................................................................. 89
RF ........................................................................................................................................................... 87
Rise & Fall............................................................................................................................................145
Save State .............................................................................................................................................. 71
Scale/Coupling ....................................................................................................................................... 97
Scale/Div................................................................................................................................................. 97
SCPI LAN............................................................................................................................................... 74
Select ...................................................................................................................................................... 99
Sensors .................................................................................................................................................150
Server ..................................................................................................................................................... 74
Service .................................................................................................................................................... 86
Shape ...................................................................................................................................................... 99
Show Errors ........................................................................................................................................... 77
SICL Server............................................................................................................................................ 74
Signal Amptd ......................................................................................................................................... 88
Signal Type............................................................................................................................................. 88
Slope .......................................................................................................................................................89
Socket Port ............................................................................................................................................. 74
Span........................................................................................................................................................ 97
Sweep Time ............................................................................................................................................ 97
Sync Source ............................................................................................................................................ 90
Telnet Port.............................................................................................................................................. 74
Time Corr ............................................................................................................................................... 83
Timebase Frequency ............................................................................................................................146
Trace .......................................................................................................................................................98
Trig Holdoff ............................................................................................................................................ 89
Trigger .................................................................................................................................................... 89
Verbose ................................................................................................................................................... 78
Video (IF Envlp) ..................................................................................................................................... 89
Visible Align ........................................................................................................................................... 83
Voltage Avg............................................................................................................................................. 96
List of Commands
List of Commands
14
Getting Started
1
Getting Started
This chapter introduces you to basic features of the instrument,
including front panel keys, rear panel connections, and display
annotation. You will also find out how to make a basic measurement
and install applications.
15
Getting Started
Topics include:
“What Documentation Comes with the E4406A VSA Series
Transmitter Tester” on page 17
“The 3 Steps to Set Up and Make Measurements” on page 21
“Front Panel Keys Context Dependency” on page 22
“Front Panel Description” on page 26
“Rear Panel Description” on page 32
“Display Annotation” on page 35
“Installing Optional Measurement Personalities” on page 38
“Cables for Connecting to the Serial Port (RS-232)” on page 45
Getting Started
“Safety Considerations” on page 51
16
Chapter 1
Getting Started
What Documentation Comes with the E4406A VSA Series Transmitter Tester
What Documentation Comes with the E4406A
VSA Series Transmitter Tester
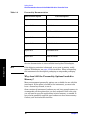
With your purchase of the instrument you receive the following
materials:
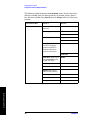
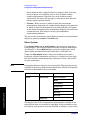
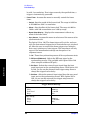
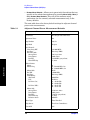
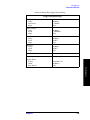
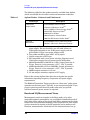
Table 1-1
Standard Documentation
Part Description
Notes
User’s Guide
Does not include operational information on
the optional measurement personalities.
Specifications
Includes specifications for the transmitter
tester and all optional measurement
personalities. (Special options will be
documented elsewhere.)
Programmer’s Guide
Does not include commands for the optional
measurement personalities
Error Messages and
Functional Tests
Includes all error messages and some
simple tests for checking the instrument is
functioning properly. (It does not test all
specifications.)
Documentation CD-ROM
Includes programming examples. Does not
include service documentation or software
Getting Started
A standard instrument contains the Basic and Service modes, which
are described here in the User’s Guide.
If you have purchased an optional measurement personality, your
instrument comes loaded with the personality you have selected plus
the Basic and Service modes. You also receive the related guide,
containing measurement and programming information, for the
personality you have ordered.
Chapter 1
17
Getting Started
What Documentation Comes with the E4406A VSA Series Transmitter Tester
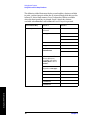
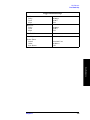
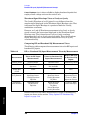
Table 1-2
Personality Documentation
Measurement Option
Part Description
Option BAC
cdmaOne Guide
Option BAH
GSM Guide
Option 202
EDGE and GSM Guide
Option BAE
NADC, PDC Guide
Option BAF
W-CDMA Guide
Option B78
cdma2000 Guide
Option 204
1xEV-DO Guide
Getting Started
Service documentation is also available from Agilent Technologies.
NOTE
If the shipping container is damaged, or any part is missing, notify
Agilent Technologies (see page 239 for locations). When transporting
the instrument use the original packaging or comparable packaging.
Why Aren’t All the Personality Options Loaded in
Memory?
Many measurement personality options are available for use with this
instrument. If the option is loaded in the instrument, you must also
have a license key entered, to use it.
Some versions of instrument hardware my not have enough memory to
accommodate all the options that you have ordered. If this is the case
you will need to swap the applications in/out of memory, as needed. It
may also be possible to upgrade your hardware to have more memory.
Contact your local sales/service office.
18
Chapter 1
Getting Started
What Documentation Comes with the E4406A VSA Series Transmitter Tester
URL for the Latest VSA Transmitter Tester Update
For the latest information about this instrument, including firmware
upgrades, application information, and product information, please
visit the following URL: http://www.agilent.com/find/vsa/.
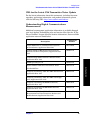
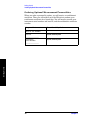
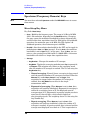
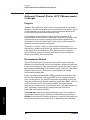
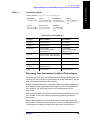
Understanding Digital Communications
Measurements
Additional measurement application information is available through
your local Agilent Technologies sales and service office. See the “If You
Have a Problem” chapter for office location information. Some available
application notes are listed below.
Description
Agilent Part
Number
Digital Modulation in Communications Systems An Introduction, Application Note 1298
5965-7160E
Understanding CDMA Measurements for Base
Stations and Their Components, Application Note
1311
5968-0953E
Understanding GSM Transmitter Measurements,
5968-2320E
Application Note 1312
5968-8438E
Agilent E4406A VSA Series Transmitter Tester
Self-Guided Tour
5968-7617E
Designing and Testing 3GPP W-CDMA Base Stations,
Application Note 1355
5980-1239E
Designing and Testing 3GPP W-CDMA User Equipment, Application Note 1356
5980-1238E
Designing and Testing IS-2000 Base Stations,
Application Note 1357
5980-1303E
Designing and Testing IS-2000 Mobile Stations,
Application Note 1358
5980-1237E
Understanding PDC and NADC Transmitter
Measurements for Base Transceiver Stations and
Mobile Stations, Application Note 1324
5968-5537E
Chapter 1
Getting Started
HPSK Spreading for 3G
19
Getting Started
What Documentation Comes with the E4406A VSA Series Transmitter Tester
Updating the Firmware
Updated versions of the E4406A VSA Transmitter Tester firmware will
be available from several sources. Information on the latest firmware
revision can be accessed through the following URL.
URL to Contact to Obtain Firmware Update Information
Getting Started
http://www.agilent.com/find/vsa/
20
Chapter 1
Getting Started
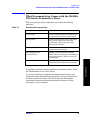
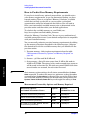
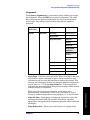
The 3 Steps to Set Up and Make Measurements
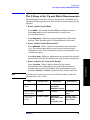
The 3 Steps to Set Up and Make Measurements
All measurements need to be set up in 3 steps: first at the Mode level,
second at the Measurement level, then finally the result display may be
adjusted.
1. Select and Set Up the Mode
Press MODE - All licensed, installed Modes available are shown.
Press Basic mode to make measurements of signals with
non-standard formats.
Press Mode Setup - Make any required adjustments to the mode
settings. These settings apply to all measurement in the mode.
2. Select and Set Up the Measurement
Press MEASURE - Select a specific measurement to be performed
(e.g.). The measurement begins as soon as any required trigger
conditions are met. The resulting data is shown on the display or is
available for export.
Press Meas Setup - Make any adjustments as required to the selected
measurement settings. The settings only apply to this measurement.
3. Select and Set Up a View of the Results
NOTE
Getting Started
Press Trace/View - Select a display format for the current
measurement data. Depending on the mode and measurement
selected, other graphical and tabular data presentations may be
available. X-Scale and Y-Scale adjustments may also be made now.
A setting may be reset at any time, and will be in effect on the next
measurement cycle or View.
Step
Primary Key
Setup Keys
Related Keys
1. Select & set up
a Mode
MODE
System
Mode Setup,
Input (E4406),
FREQUENCY Channel
2. Select & set up
a Measurement
MEASURE
Meas Setup
Meas Control,
Restart
3. Select & set up
a View of the
Results
View/Trace (E4406),
SPAN X Scale,
AMPLITUDE Y Scale,
Display,
Next Window, Zoom
File, Save, Print,
Print Setup, Marker,
Search (E4406),
Chapter 1
21
Getting Started
Front Panel Keys Context Dependency
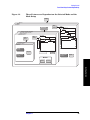
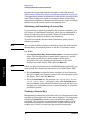
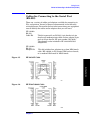
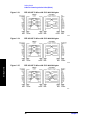
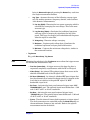
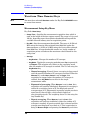
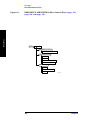
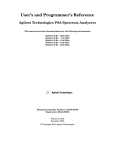
Front Panel Keys Context Dependency
Many of the instrument features are context dependent. The functions
that are available will change based on your selections of mode, mode
setup, measurement, and measurement setup. The following figures
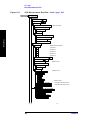
represent the dependency relationships of the front panel keys.
Figure 1-1
System and Navigation Keys are not Context Dependent
System
Navigation
Window
Zoom
Preset
File
Print
Setup
Save
Print
Tab
Return
Esc
Getting Started
Next
Window
System
22
Chapter 1
Getting Started
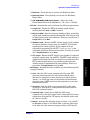
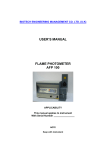
Front Panel Keys Context Dependency
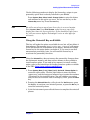
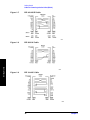
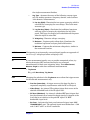
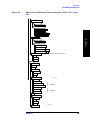
Figure 1-2
These Features are Dependent on the Selected Mode and the
Mode Setup
MODE
Service
GSM
cdmaOne
Mode
Setup
MEASURE
Radio
Standard: TIA-95B PCS
Device: MS, BS
Input
Waveform (Time Domain)
Spectrum (Freq Domain)
Spurious Close
Channel Power
Trigger
Demod
Averaging
Meas
Setup
View/
Trace
RF Chan
Trigger Source
Frame
Advanced
M
e
n
u
s
Statistics View
Spectrum View
I/Q View
Limits
SPAN
X Scale
Display
Meas
Control
Restart
AMPLITUDE
FREQUENCY
Y Scale
Channel
Input
Marker
Marker
Search
Getting Started
Chapter 1
23
Getting Started
Front Panel Keys Context Dependency
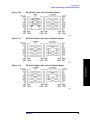
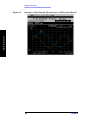
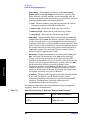
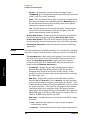
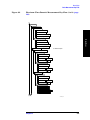
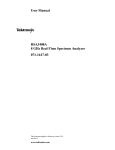
Figure 1-3
These Features are Dependent on the Selected Measurement
and the Measurement Setup
*
MEASURE
Waveform (Time Domain)
Spectrum (Freq Domain)
Spurious Close
Channel Power
Meas
Setup
View/
Trace
*
Averaging
Trigger Source
Advanced
M
e
n
u
s
Statistics View
Spectrum View
I/Q View
Limits
SPAN
X Scale
Display
Meas
Control
Restart
AMPLITUDE
Y Scale
Marker
Getting Started
Marker
Search
* Some Measureand Meas Setupparameters are context dependent upon the
Radio variant and Device selected in the Mode Setup.
24
Chapter 1
Navigation
Next
Window
Zoom
Window
Marker
Tab
Search
Marker
Return
Esc
Channel
Meas
Control
Limits
Input
Frame
RF Chan
Demod
Trigger
FREQUENCY
Restart
Advanced
Input
Standard: TIA-95B PCS
Device: MS, BS
Radio
Y Scale
Display
M
e
n
u
s
Trigger Source
Mode
Setup
AMPLITUDE
X Scale
SPAN
Statistics View
Spectrum View
I/Q View
Meas
Setup
Getting Started
Chapter 1
View/
Trace
Averaging
MEASURE
Save
File
System
Print
Print
Setup
Preset
System
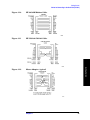
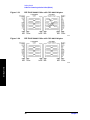
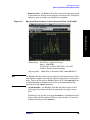
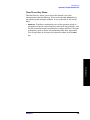
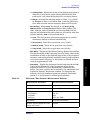
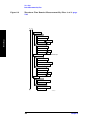
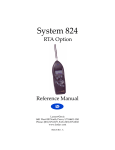
Figure 1-4
Waveform (Time Domain)
Spectrum (Freq Domain)
Spurious Close
Channel Power
Service
GSM
cdmaOne
MODE
Getting Started
Front Panel Keys Context Dependency
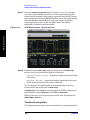
Front Panel Keys Context Dependent Relationships
25
Getting Started
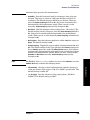
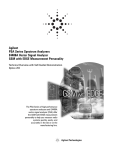
Front Panel Description
Front Panel Description
Key menus may vary depending on the currently selected mode or
measurement. menu keys which are not available for use are
greyed-out. Keys may be greyed-out keys as a result of:
• the current setting of other inter-related functions,
• not having a required password or license key, or
• not having some piece of optional hardware that is required.
Getting Started
Paths to access any feature will be found in the key access table, Table
2-1 on page 57. Display annotation is explained in “Display
Annotation” on page 35. Operation of the 3.5 inch floppy-drive is
covered in “Using Print and Print Setup Functions” on page 67.
1. ESC key
Use the escape key to exit any function without
modifying current parameters. Pressing the ESC key
will:
• Clear any numeric entry that you have begun to
enter but decided you want to cancel.
• Remove any entries that are visible in the active
function area of the display (see “Display
Annotation” on page 35 for a description of the
active function area and other display features).
• Cancels an alignment, if one is in progress.
2. Control keys
set parameters that are used by the measurement in
26
Chapter 1
Getting Started
Front Panel Description
the current measurement mode.
• FREQUENCY/Channel accesses menu keys that
control the center frequency or channel number.
These parameters apply to all measurements in the
current mode.
• SPAN/X Scale accesses menu keys that control the
horizontal scale in units of frequency, time, symbols
or bits. The parameters in this menu apply only to
the active window in the current measurement. See
“Span / X Scale Keys” on page 97 for more detail.
• AMPLITUDE/Y Scale accesses menu keys that control
vertical scale functions in units of dBm, dB, volts,
degrees, or radians. The parameters in this menu
apply only to the active window in the current
measurement. See “Amplitude / Y Scale Keys” on
page 98 for more detail.
3. Input key
The Input key accesses menu keys that control the input
of the transmitter tester. These affect all measurements
within the current mode. Note that the internal
50 MHz reference signal and the IF align signal are
used as internal inputs that do not require external
connections. See “Using Input/Output Configuration
Keys” on page 73 for more detail.
4. View keys
View keys modify the format of the trace and numeric
• View/Trace accesses menu keys that control the way
results are viewed.
• Display accesses menu keys that change the display.
Functions such as limit mask on/off and dots on/off
are available for some measurements.
5. Measure
keys
The Measure keys are used to select and set up a
specific measurement within the selected application.
See “Preparing for Measurements” on page 94 for more
detail.
• MEASURE accesses menu keys that select and
initiate the various measurements that are specific
to the current mode.
• Meas Setup accesses the setup parameters that are
specific to the current measurement.
• Restart causes the measurement that is currently in
process to stop, then start again at the beginning
Chapter 1
27
Getting Started
data on the display. See “View/Trace Key” on page 96
for more detail.
Getting Started
Front Panel Description
according to the current measurement setup
parameters.
• Meas Control accesses menu keys that affect the
measurement after it has been setup, for example
selecting a single or continuous measurement.
6. Mode keys select the measurement mode and mode parameters
See “Mode Setup” on page 87 for more detail.
• MODE accesses menu keys to select the instrument
mode. Each mode is independent of all other modes.
• Mode Setup accesses menu keys that affect
parameters that are specific to the current mode and
affect all measurements within that mode.
7. System keys access system features, that are used with all
instrument modes. See “Using System Keys” on page
56 for further explanation of system features.
• System accesses features that control instrument
configuration at the system level, like I/O
configuration and alignment, which affect all
instrument modes. Pressing System also returns the
instrument to local control, if it has been in remote
mode.
• Preset resets all parameters of the current mode
back to the factory defaults.
Getting Started
• Print immediately prints what is on the screen to the
printer, or saves a file to a floppy disc, according to
the parameters that are currently set in the Print
Setup menu. See “Using Print and Print Setup
Functions” on page 67 for more detail.
• Print Setup configures the transmitter tester for
printing to a printer, or saving an image file to the
floppy disc drive, and also allows you to select the
printer type.
• File accesses menu keys that control the file system
of the transmitter tester for saving and loading
instrument states. See “Using File and Save Keys”
on page 71 for more detail.
• Save saves the current instrument state in the File
menu. See “Using File and Save Keys” on page 71
for more detail.
8. Marker keys are used to obtain specific information about parts of
the displayed measurement (for example, to identify
the exact frequency of an offset). See “Using Markers”
28
Chapter 1
Getting Started
Front Panel Description
on page 98 for more detail.
• Marker accesses menu keys that allow manual
positioning of markers.
• Search automatically performs a peak search, and
accesses menu keys that automatically position
markers at preset locations on the trace (for
example, to determine the difference between the
amplitude of one peak and another).
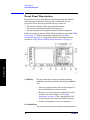
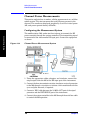
9. Probe Power The probe power input supplies power for external
probes; the three connectors are a ground, and a +15 V,
and a −12.6 V connector. The probe power supplies
power to high frequency probes and accessories, such as
preamplifiers, that are used as accessories to the
transmitter tester. The probe power provides a
maximum of 150 mA.
10. RF Input The 50 Ω RF input allows for input of an external RF
signal. The connector is a type N female, and is rated
for a maximum input of +35 dBm for measuring a CW
signal, and a maximum of 26 volts for a DC signal.
11. Data Entry keys are used to enter numeric values. Entries made
using data entry keys will be visible in the active
function area (see “Display Annotation” on page 35 to
locate the active function area).
• Units menu keys are used to enter units of
measurement. If the value you are entering is in
units of measurement, the units menu key menu
will automatically appear once you enter a digit.
After entering the desired numeric value, you
terminate the entry by pressing the appropriate
units of measurement menu key.
• Numeric keys enter numeric values as indicated on
the keys. In addition, decimal and positive and
negative sign keys are available for your use.
• The Step keys (these are the up and down arrow
keys) change numeric values in increments of the
Chapter 1
29
Getting Started
• The Enter key is used to terminate numeric data
where no units of measurement are being entered, or
where you want to terminate with the default unit of
measurement. For operations involving selection of a
unit of measurement (for example, dB, dBm,
Hz, s, degrees, radians), the Units menu key menu
(explained below) is used to terminate numeric
entries.
Getting Started
Front Panel Description
current step size.
• The Backspace key moves the cursor backwards one
space and erases the character in that space. You
can use the Backspace key to backspace characters
in the active function area.
• The RPG Knob changes numeric values in
increments of the current knob resolution.
12. Floppy Disk Drive. The floppy disk drive accepts 1.44 megabyte
disks. For an explanation of the operation of the floppy
disc drive see “Using Print and Print Setup Functions”
on page 67.
Getting Started
13. Menu keys Menu keys either activate a feature or access a further
menu key menu. An arrow on the right side of a menu
key label indicates that the key accesses a further
menu. The menu key which is currently active is
highlighted. Keys unavailable for use are greyed-out. If
a menu key menu has multiple pages, further pages
will be accessed by pressing the More key which is the
bottom key on any multi-page menu.
14. Return key The Return key exits the current menu and returns
you to the previous menu. If you are on page one of a
multi-page menu (a menu with a “More” key) the Return
key will exit the multi-page menu. When you activate a
different measurement, the return list is cleared. The
Return key will not return you to the previously
activated mode, nor will it alter any values you have
entered on previous menus.
15. Navigation keys are used to move around in the display, and to
return to the previous menu.
• The Tab Left feature is not implemented. This
feature will be implemented with a future firmware
update.
• The Tab Right feature is not implemented. This
feature will be implemented with a future firmware
update.
• The Home feature is not implemented. This feature
will be implemented with a future firmware update.
16. Window keys are used to move to a different window in the
display or to zoom the windows being displayed.
• The Next Window key switches between windows.
When a single window is being viewed it switches to
display the next window which is contained in the
30
Chapter 1
Getting Started
Front Panel Description
current multi-window display which, however, is not
initially visible on the display. When viewing
multiple windows, it activates the next window on
the display. The active window is indicated by a
green border.
• The Zoom key allows you to switch between a
multiple-window screen and a full-size display of the
window that is active.
17. Help key
The Help feature is not implemented. This feature will
be implemented with a future firmware update.
18. On/Off
switch turns on the transmitter tester. A green LED
will light below the Power switch when the instrument
has been turned on. When in standby mode a yellow
LED is visible above the On/Off switch.
19. Inputs
enable you to input one or more of the two following
external signals.
•
I input and Q inputs. There are two I and two Q
inputs (I and I; Q and Q). This functionality is
available if the BbIQ measurement personality
(Option B7C) is installed in your instrument.
Chapter 1
31
Getting Started
• External Trigger input. The external trigger allows
external triggering of measurements. The external
trigger accepts an external trigger signal between
−5 and +5 V, and has a nominal impedance of
> 10 kΩ. For more information on triggering, see
“Trigger Keys” on page 89.
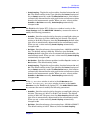
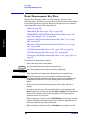
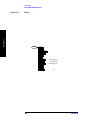
Getting Started
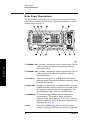
Rear Panel Description
Rear Panel Description
Getting Started
The diagram below illustrates all rear panel connections. For further
explanation of labels found on the rear panel see the section on safety
considerations on page 53.
1. TRIGGER 2 OUT provides a transmitter tester trigger output. This is
used to synchronize other test equipment with the
transmitter tester.
2. TRIGGER 1 OUT provides a transmitter tester trigger output. This is
used to synchronize other test equipment with the
transmitter tester.
3. EXT REF IN
allows the input of a 1 to 30 MHz external frequency
reference signal. The external reference frequency must
be entered by the user.
4. 10 MHz OUT provides an output of the transmitter tester’s internal
10 MHz frequency reference signal. This is used to lock
the frequency reference of other test equipment with
the transmitter tester. This is a switched output.
5. TRIGGER IN The external trigger allows external triggering of
measurements. The external trigger accepts an
external trigger signal between −5 and +5 V, and has a
nominal impedance of 10 k Ω. For more information on
triggering, see page 89.
6. SCSI
32
Currently the SCSI connection can only be used to
connect an external SCSI drive for firmware upgrades.
Chapter 1
Getting Started
Rear Panel Description
SCSI functionality will be fully implemented with a
future firmware update.
7. Line Power Input AC power line connection. The line voltage operates
at nominally 115 V (47 to 440 Hz) or at nominally 230 V
(47 H to 66 Hz). The input power ranges for the power
supply are 90 to 132 V or 195 to 250 Vrms. The power
supply automatically senses the input power and
switches between these two ranges. There is no
customer replaceable power fuse. When on, the
instrument consumes less than 350 W; when in standby
less than 20 W.
8. KYBD
This feature is not implemented. This feature will be
implemented with a future firmware update. The KYBD
enables connection of an external PS-2 keyboard using
a 6-pin mini-DIN connector. If no keyboard is available
you can use the numeric keyboard and the Alpha Editor
menu key feature to make the entries. The keyboard
must be plugged into the instrument prior to powering
the instrument on or the keyboard will not work.
9. GPIB
The GPIB allows the connection of a General Purpose
Interface Bus (GPIB) cable, which enables remote
instrument operation.
10. LAN-TP
The LAN-TP connector can be used:
- as a SICL server emulating IEEE 488.2 protocol
over LAN.
- for a TCP/IP socket programming port that can be
sent SCPI commands.
- for anonymous FTP operations to retrieve a screen
“gif” or screen “xwd” file from the ftp/pub.
NOTE
For more information on remote programming with your transmitter
tester, refer to the programmer’s guide.
Chapter 1
33
Getting Started
- for a telnet programming port that can be sent
SCPI commands.
Getting Started
Rear Panel Description
11. PARALLEL The PARALLEL connection supports remote printing.
The MONITOR allows connection of an external VGA
monitor, using a 15− pin mini D−SUB connector.
13. RS-232
The serial port RS-232 is not implemented. This feature
will be implemented with a future firmware update.
Getting Started
12. MONITOR
34
Chapter 1
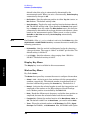
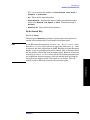
Getting Started
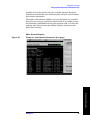
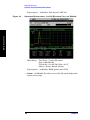
Display Annotation
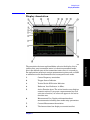
Display Annotation
1.
Center Frequency annotation.
2.
Trigger Source Indicator.
3.
Vertical Scale dB/Division Indicator.
4.
Reference Level Indicator (in dBm).
5.
Active Function Area. The active function area displays
numeric entries. If you press a measurement key that
activates a function, its value will appear in the active
function area.
6.
Measurement Bar. Displays information about
measurements including some mode setup parameters.
7.
Current Measurement Annotation.
8.
The Annunciators bar displays annunciators that
Chapter 1
35
Getting Started
The annotation features explained below refers to the display that is
visible when your transmitter tester is in basic measurement mode;
this is the default state of the transmitter tester when it is turned on.
For explanations relating to unique measurement options such as GSM
or cdmaOne see the documentation that accompanies each mode.
Getting Started
Display Annotation
indicate that hardware errors, other errors, or specific
instrument states, are detected in the instrument, as
explained below. Error indicators are shown in red text.
Where applicable, some states will appear in green,
indicating that the feature is active and performing
correctly. Informational annunciators are shown in
white text. To view error messages fully you will use
keys in the Show Errors menu (see page 56). The
current error message with the highest priority will
also appear in the Status/Info Bar that appears at the
bottom of the display. The following annunciators are
available:
Unlock - This annunciator indicates that one or
more of the internal phase-locked loops are unable to
maintain a phase-locked state.
Corr Off (corrections off) - This annunciator
appears when the Corrections menu key is set to off.
Err (error) - This annunciator appears when an
error message is placed in the history error queue. It
will persist until you use the Clear Error Queue(s) key
to clear the history error queue.
Getting Started
Ext Ref (external reference) - The green Ext Ref
annunciator indicates that the external reference
has been selected and the instrument is locked to it.
The red Ext Ref annunciator indicates that the
external reference has been selected, but the
instrument is not locked to that reference. Note that
the external reference on this instrument can be set
at any frequency between 1 and 30 MHz; if the
entered value does not correspond to the external
reference that is in use, a red Ext Ref annunciator
will appear.
NOTE
Be aware that the value entered for the external reference frequency
will persist, even after the instrument has been powered off. The user
must manually enter a new value for the external reference if a
different value is required, even if it corresponds with the default value.
An Ext Ref annunciator will appear only if the external reference has
been activated by the user.
36
Chapter 1
Getting Started
Display Annotation
ESec (even second clock) - The green ESec
annunciator indicates that the external even second
clock has been selected as the sync type and a sync
signal is present at the even second input (rear
panel Trigger In), and the measurement is using it
as the demodulation sync type. The red ESec
annunciator indicates that an external even second
clock has been selected as the sync type but a sync
signal is not present at the even second input (rear
panel Trigger In). In this case, the error message
Even Second Clock Missing will appear in the
Status/Info bar at the bottom of the display. The
even second clock detection is updated every 2
seconds.
Klock (keyboard lock) - The keyboard can be locked
remotely using SYSTem:KLOck. The Klock
annunciator will appear in white text when the
keyboard has been locked.
System Bar.
10.
Time and Date.
11.
Personality Mode Indicator.
12.
Graph (Window) Title.
13.
Averaging Indicator.
14.
Remote Status Indicator. The remote status indicator
contains four letters: “R”,“ L”, “T”, and “S”. The current
status is indicated by the letters that are highlighted.
“R” indicates that the instrument is in remote mode.
“L” indicates a listen state. “T” indicates a talk state.
“S” indicates a service request.
15.
Pass/Fail Status Indicator.
16.
Menu Title.
17.
Menu keys. A menu key that is currently active is
highlighted. Greyed-out menu keys are unavailable and
may require a password for use.
18.
Span annotation.
19.
Status/Info Bar. The current error message which has
the highest priority will appear in the Status/Info Bar.
A programmer can also send a message to the
Status/Info bar using a SCPI command.
Chapter 1
37
Getting Started
9.
Getting Started
Installing Optional Measurement Personalities
Installing Optional Measurement
Personalities
When you install a measurement personality, you need to follow a three
step process:
1. Determine whether your memory capacity is sufficient to contain all
the options you want to load. If not, decide which options you want to
install now, and consider upgrading your memory. Details follow in
“Do You Have Enough Memory to Load All Your Personality
Options?” on page 38.
2. Install the measurement personality firmware into the instrument
memory. Details follow in “Loading an Optional Measurement
Personality” on page 41.
3. Enter a license key that activates the measurement personality.
Details follow in “Obtaining and Installing a License Key” on page
42.
Getting Started
Adding measurement personalities requires the purchase of an upgrade
kit for the desired option. The upgrade kit contains the measurement
personality firmware and an entitlement certificate that is used to
generate a license key from the internet website. A separate license key
is required for each option on a specific instrument serial number and
host ID.
For the latest information on Agilent Spectrum Analyzer options and
upgrade kits, visit the following web location:
http://www.agilent.com/find/sa_upgrades
Do You Have Enough Memory to Load All Your
Personality Options?
If you do not have memory limitations then you can skip ahead to the
next section “Loading an Optional Measurement Personality” on
page 41. If after installing your options you get error messages relating
to memory issues, you can return to this section to learn more about
how to optimize your configuration.
If you have 64 MBytes of memory installed in your instrument, you
should have enough memory to install at least four optional
personalities, with plenty of memory for data and states.
The optional measurement personalities require different amounts of
memory. So the number of personalities that you can load varies. This is
also impacted by how much data you need to save. If you are having
memory errors you must swap the applications in or out of memory as
needed. If you only have 48 MBytes of memory, you can upgrade your
38
Chapter 1
Getting Started
Installing Optional Measurement Personalities
hardware to 64 MBytes.
To see the size of your installed memory for E4406A Transmitter
Testers:
1. Press the System key, MORE (1 of 3), and MORE (2 of 3) keys.
2. Read the File System Key - The total of the entries for Used and Free
memory will total the installed flash memory, either 48 or 64
MBytes.
If you have 48 MBytes of memory, and you want to install more than 3
optional personalities, you may need to manage your memory
resources. The following section, “How to Predict Your Memory
Requirements” on page 40, will help you decide how to configure your
installed options to provide optimal operation.
Getting Started
Chapter 1
39
Getting Started
Installing Optional Measurement Personalities
How to Predict Your Memory Requirements
If you plan to install many optional personalities, you should review
your memory requirements, so you can determine whether you have
enough memory. There is an Agilent “Memory Calculator” available
online that can help you do this, or you can make a calculated
approximation using the information that follows. You will need to
know your instrument’s installed memory size as determined in the
previous section and then select your desired applications.
To calculate the available memory on your E4406, see:
http://www.agilent.com/find/e4406a_firmware
Select the “Memory Calculator” link. You can try any combination of
available personalities to see if your desired configuration is compatible
with your installed memory.
You can manually estimate your total memory requirements by adding
up the memory allocations described in the following steps. Compare
the desired total with the available memory that you identified in the
previous section.
1. Program memory - Select option requirements from the table
“Measurement Personality Options and Memory Required” on
page 40.
Getting Started
2. Screens - .gif files need 20-25 kB each
3. State memory - State file sizes range from 21 kB for SA mode to
40 kB for W-CDMA. The state of every mode accessed since power-on
will be saved in the state file. File sizes can exceed 150 kB each when
several modes are accessed, for each state file saved.
TIP
State memory retains settings for all states accessed before the Save
State command. To reduce this usage to a minimum, reduce the modes
accessed before the Save State is executed. You can set the PSA to boot
into a selected mode by accessing the desired mode, then pressing the
System, Power On/Preset, Power On keys and toggle the setting to Last.
Measurement Personality Options and Memory Required
Personality Options
for E4406A Transmitter Tester a
Option
File Size
(E4406A Rev: A.10)
cdmaOne measurement personality
BAC
1.82 Mbytes
NADC measurement personality
BAE
1.10 Mbytes
PDC measurement personality
BAE
1.23 Mbytes
W-CDMA or W-CDMA, HSDPA, HSUPA
measurement personality
BAF, 210
5.00 Mbytes
40
Chapter 1
Getting Started
Installing Optional Measurement Personalities
Personality Options
for E4406A Transmitter Tester a
Option
File Size
(E4406A Rev: A.10)
cdma2000 or cdma2000 w/ 1xEV-DV
measurement personality
B78, 214
3.88 Mbytes
1xEV-DO measurement personality
204
4.84 Mbytes
GSM (with EDGE) measurement
personality
202
3.56 Mbytes
GSM measurement personality
BAH
2.51 Mbytes
EDGE upgrade from BAH measurement
personality
252 (202)
3.56 Mbytes
iDEN measurement personality
HN1
2.10 Mbytes
WiDEN measurement personality
HN1
1.58 Mbytes
Baseband I/Q Inputs
B7C
n/a (hardware only)
a. Available as of the print date of this guide.
Memory Upgrade Kits
The VSA 64 MByte Memory Upgrade kit part number is
E4406AU-ANE.
For more information about memory upgrade kits contact your local
sales office, service office, or see:
http://www.agilent.com/find/sa_upgrades
You must use a PC to load the desired personality option into the
instrument memory. Loading can be done from a firmware CD-ROM or
by downloading the update program from the internet. An automatic
loading program comes with the files and runs from your PC.
You can check the Agilent internet website for the latest E4406
firmware versions available for downloading:
http://www.agilent.com/find/e4406a_firmware
NOTE
When you add a new option, or update an existing option, you will get
the updated versions of all your current options as they are all reloaded
simultaneously. This process may also require you to update the
instrument core firmware so that it is compatible with the new option.
Depending on your installed hardware memory, you may not be able to
fit all of the available measurement personalities in instrument
memory at the same time. You may need to delete an existing option file
from memory and load the one you want. Use the automatic update
Chapter 1
41
Getting Started
Loading an Optional Measurement Personality
Getting Started
Installing Optional Measurement Personalities
program that is provided with the files. Refer to the table showing
“Measurement Personality Options and Memory Required” on page 40.
The approximate memory requirements for the options are listed in this
table. These numbers are worst case examples. Some options share
components and libraries, therefore the total memory usage of multiple
options may not be exactly equal to the combined total.
Obtaining and Installing a License Key
If you purchase an optional personality that requires installation, you
will receive an “Entitlement Certificate” which may be redeemed for a
license key specific to one instrument. Follow the instructions that
accompany the certificate to obtain your license key.
To install a license key for the selected personality option, use the
following procedure:
NOTE
You can also use this procedure to reinstall a license key that has been
deleted during an uninstall process, or lost due to a memory failure.
For E4406:
Getting Started
1. Press System, More, More, Install, Choose Option to accesses the alpha
editor. Use this alpha editor to enter letters (upper-case), and the
front-panel numeric keys to enter numbers for the option
designation. You will validate your option entry in the active
function area of the display. Then, press the Done key.
NOTE
Before you enter the license key for the EDGE Retrofit Option 252, you
must already have entered the license key for the GSM Option BAH.
2. Press License Key to enter the letters and digits of your license key.
You will validate your license key entry in the active function area of
the display. Then, press the Done key.
3. Press the Install Now key. The message “New option keys become
active after reboot.” will appear, along with the Yes/No menu:
press the Yes key and cycle the instrument power off and then on to
complete your installation process, or press the No key to cancel the
installation process.
Viewing a License Key
Measurement personalities purchased with your instrument have been
installed and activated at the factory before shipment. The instrument
requires a License Key unique to every measurement personality
purchased. The license key is a hexadecimal number specific to your
measurement personality, instrument serial number and host ID. It
enables you to install, or reactivate that particular personality.
42
Chapter 1
Getting Started
Installing Optional Measurement Personalities
Use the following procedure to display the license key unique to your
personality option that is already installed in your E4406:
Press System, More, More, Install, Choose Option to enter the letters
and numbers for the option you want. You can see the key on the
License Key menu key. Press the Done key.
NOTE
You will want to keep a copy of your license key in a secure location.
Press System, More, then Show System, and print out a copy of the
display that shows the license numbers. If you should lose your license
key, call your nearest Agilent Technologies service or sales office for
assistance.
Using the Uninstall Key on E4406A
This key will make the option unavailable for use, but will not delete it
from memory. The message “Application Not Licensed” will appear
in the Status/Info bar at the bottom of the display. Record the 12-digit
license key for the option before you delete it. If you want to use that
measurement personality later, you will need the license key to
reactivate the personality firmware.
NOTE
1. Press System, More (1 of 3), More (2 of 3), Uninstall, Choose Option to
access the alpha editor. Use this alpha editor to enter the letters
(upper-case), and the front-panel numeric keys to enter the numbers
(if required) for the installed option. You will validate your option
entry in the active function area of the display. Then, press the Done
key.
2. Pressing the Uninstall Now key will activate the Yes/No menu: press
the Yes key to continue your uninstall process, or press the No key to
cancel the uninstall process.
3. Cycle the instrument power off and then on to complete the uninstall
process.
Chapter 1
43
Getting Started
Using the Uninstall key does not remove the personality firmware from
the instrument memory, and does not free memory to be available to
install another option. If you need to free memory to install another
option, refer to the instructions for loading firmware updates available
at the URL: http://www.agilent.com/find/vsa/
Getting Started
Installing Optional Measurement Personalities
Ordering Optional Measurement Personalities
When you order a personality option, you will receive an entitlement
certificate. Then you will need to go to the Web site to redeem your
entitlement certificate for a license key. You will need to provide your
instrument serial number and host ID, and the entitlement certificate
number.
Required Information:
Front Panel Key Path:
Model #: (Ex. E4440A)
System, Show System
Instrument
Serial Number:
__________________
System, Show System
Getting Started
Host ID:
__________________
44
Chapter 1
Getting Started
Cables for Connecting to the Serial Port (RS-232)
Cables for Connecting to the Serial Port
(RS-232)
There are a variety of cables and adapters available for connecting to
PCs, and printers. Several of these are documented in the following
wiring diagrams. You need to find out what connections your equipment
uses to identify the cables and/or adapters that you will need.
HP 34398A
RS-232
Cable Kit
HP 34399A
RS-232
Adapter Kit
This kit comes with an RS-232, 9-pin female to 9-pin
female null modem/printer cable and one adapter 9-pin
male to 25-pin female (HP part number 5181-6641).
The adapter is also included in HP 34399A RS-232
Adapter Kit.
This kit includes four adapters to go from DB9 female
cable (HP 34398A) to PC/printer DB25 male or female,
or to modem DB9 female or DB25 female.
HP 24542U Cable
Figure 1-6
HP F1047-80002 Cable
Getting Started
Figure 1-5
Chapter 1
45
Getting Started
Getting Started
Cables for Connecting to the Serial Port (RS-232)
Figure 1-7
HP 24542G/H Cable
Figure 1-8
HP 92219J Cable
Figure 1-9
HP 13242G Cable
46
Chapter 1
Getting Started
Cables for Connecting to the Serial Port (RS-232)
HP 24542M Modem Cable
Figure 1-11
HP C2913A/C2914A Cable
Figure 1-12
Mouse Adapter (typical)
Chapter 1
Getting Started
Figure 1-10
47
Getting Started
Cables for Connecting to the Serial Port (RS-232)
HP 24542U Cable with 5181-6641 Adapter
Figure 1-14
HP 24542U Cable with 5181-6640 Adapter
Figure 1-15
HP 24542U Cable with 5181-6642 Adapter
Getting Started
Figure 1-13
48
Chapter 1
Getting Started
Cables for Connecting to the Serial Port (RS-232)
Figure 1-16
HP 24542U Cable with 5181-6639 Adapter
Figure 1-17
HP F1047-80002 Cable with 5181-6641 Adapter
Figure 1-18
HP F1047-80002 Cable with 5181-6640 Adapter
Getting Started
Chapter 1
49
Getting Started
Cables for Connecting to the Serial Port (RS-232)
HP F1047-80002 Cable with 5181-6642 Adapter
Figure 1-20
HP F1047-80002 Cable with 5181-6639 Adapter
Getting Started
Figure 1-19
50
Chapter 1
Getting Started
Safety Considerations
Safety Considerations
This section covers safety considerations relating to the installation and
use of the instrument.
Instrument Installation
Install the instrument so that the detachable power cord is readily
identifiable and is easily reached by the operator. The detachable power
cord is used to completely disconnect the instrument. The front panel
switch is only a standby switch which maintains standby power to some
parts of the instrument. It does not disconnect the instrument from the
power source. Alternatively, an externally installed switch or circuit
breaker (which is readily identifiable and is easily reached by the
operator) may be used as a disconnecting device.
The input power ranges for the power supply are 90 to 132 V, or 195 to
250 Vrms. The power supply automatically senses the input power and
switches between these two ranges. There is no customer replaceable
power fuse.
The power cord is connected to internal capacitors that may
remain live for 5 seconds after the plug is disconnected from its
power supply.
WARNING
If this product is to be energized via an external
autotransformer for voltage reduction, make sure that its
common terminal is connected to a neutral (earthed pole) of the
power supply.
CAUTION
This instrument has autoranging line voltage input, be sure the supply
voltage is within the specified range.
CAUTION
VENTILATION REQUIREMENTS: When installing the product in a
cabinet, the convection into and out of the product must not be
restricted. The ambient temperature (outside the cabinet) must be less
than the maximum operating temperature of the product by 4° C for
every 100 watts dissipated in the cabinet. If the total power dissipated
in the cabinet is greater than 800 watts, then forced convection must be
used.
Chapter 1
51
Getting Started
WARNING
Getting Started
Safety Considerations
Instrument Operation and Maintenance
The following warnings explain conditions which affect the safe
operation of the instrument.
WARNING
If this instrument is not used as specified, the protection
provided by the equipment could be impaired. This product
must be used in a normal condition (in which all means for
protection are in tact) only.
WARNING
To prevent electrical shock, disconnect the E4406A from mains
before cleaning. Use a dry cloth or one slightly dampened with
water to clean the external case parts. Do not attempt to clean
internally.
Explanation of Safety Symbols that are on the Instrument
The following list describes all safety symbols that are on the front and
rear panels of the transmitter tester.
The instruction documentation symbol. The product is marked with this
symbol when it is necessary for the user to refer to the instructions in the
documentation.
Getting Started
This symbol is used to mark the ON position of the power line switch.
This symbol is used to mark the OFF position of the power line switch.
This symbol is used to mark the STANDBY position of the power line switch.
This symbol indicates that the input power required is AC.
This symbol is used to mark the STANDBY/OFF position of the power line
switch.
This symbol is used to mark the On position of the power line switch.
52
Chapter 1
Getting Started
Safety Considerations
Safety Considerations for Service Personnel
NOTE
No one other than qualified service personnel are allowed to remove
the cover of the instrument. The following warnings apply to service
personnel. These warnings are found on the rear panel of the
instrument.
To Remove Outer Cover, Remove Strap Handle, 4 Bottom
Feet, and 4 Rear Feet.
To Remove CPU Assembly Unplug All Boards Connected to
CPU. When Removing CPU Keep Perpendicular with Rear
Panel
Getting Started
Chapter 1
53
Getting Started
Getting Started
Safety Considerations
54
Chapter 1
2
Using System Features
Using System Features
System keys access features that are used with all modes, including
alignment, configuring I/O, and file management.
55
Using System Features
Using System Keys
Using System Keys
System features are accessed through the System front panel key. These
are features that are not dependent on the currently selected
application mode or the particular measurement being made. They
apply to all modes and measurements.
The System key also performs the LOCAL function. If the instrument
was previously being controlled remotely by a computer, pressing the
System key will reactivate the front panel keys.
Print feature keys are accessed through the front panel Print Setup and
Print keys, which are explained on page 67.
File feature keys are accessed through the File and Save menu keys,
which are explained on page 71.
Each description of a system feature begins with a table that shows the
key path for all keys related to that feature.
NOTE
Most of the system features are not affected by pressing the Preset key
or by cycling the instrument power. These features will retain the last
value set by the user. Press System, More, Restore Sys Defaults, Yes to
reset the System parameters back to the factory defaults.
Install and Uninstall
Using System Features
The Install and Uninstall keys, which enable you to install and remove
measurement personalities, are described separately on page 38 of the
Getting Started chapter.
56
Chapter 2
Using System Features
Key Locations
Key Locations
All system, service, and basic features can be located by using the key
access table below. The key access path describes the key sequence you
enter to access the particular key.
Some features can only be used when specific measurements are active.
If a feature is not currently valid the key label for that feature will
appear as lighter colored text, will be greyed-out, or will not be
displayed at all.
Table 2-1
Key Access Locations
Key Access Path
10 MHz Out
System/Reference/
50 MHz Amptd
MODE/Service/
50 MHz Ref
Input/Input Port/
ADC Dither
Meas Setup/More(1 of 2)/Advanced/ More(1 of 2)/
ADC Range
Meas Setup/More(1 of 2) / Advanced /
Note: This feature is used when measure is set to either spectrum or
waveform.
Adjust Now
System/Alignments/Align Subsystem/Align 50 MHz Reference/
Note: Requires Password
Advanced
Meas Setup/More(1 of 2)
Align 50 MHz
Reference
System/Alignments/Align Subsystem/
Note: Requires Password
Align ADC
System/Alignments/Align Subsystem/
Align All Now
System/Alignments/
Align IF
System/Alignments/Align Subsystem/
Align RF
System/Alignments/Align Subsystem/
Alignments
System/
Align Subsystems
System/Alignments/
All
View/Trace/Trace Display/
Alpha Editor
The Alpha Editor is accessed by following the Menu Access Paths that
accompany the following key entries: Choose Option, License Key, and Host
Name.
AMPLITUDE/
Y Scale
Front Panel
Auto
Meas Setup/More(1 of 2)/Advanced/ More (1 of 2)/Data Packing/
Chapter 2
57
Using System Features
Key
Using System Features
Key Locations
Using System Features
Table 2-1
Key Access Locations
Key
Key Access Path
Auto
Meas Setup/More(1 of 2)/ Advanced /ADC Range /
Note: This feature is used when measurement is set to either spectrum or
waveform.
Auto Align
System/Alignments/
AutoPeak
Meas Setup/More(1 of 2)/ Advanced /ADC Range /
Note: This feature is used when measurement is set to either spectrum or
waveform.
AutoPeakLock
Meas Setup/More(1 of 2)/ Advanced /ADC Range /
Note: This feature is used when measurement is set to either spectrum or
waveform.
Auto Trig
Mode Setup/ Trigger/
Note: This feature is used when measurement is set to either spectrum or
waveform.
Average
View/Traces/ Display Traces/
Average
Meas Setup/
Note: This feature is used when measurement is set to either spectrum or
waveform.
Avg Mode
Meas Setup/ Average/
Note: This feature is used when measurement is set to either spectrum or
waveform.
Avg Number
Meas Setup/Average/
Note: This feature is used when measurement is set to either spectrum or
waveform.
Avg Trace
Marker/More(1 of 2)/ Marker Trace/
Avg Type
Meas Setup/ Average/
Note: This feature is used when measurement is set to either spectrum or
waveform.
Band Power
Marker/ Function/
Basic
MODE/
Blackman
Meas Setup/More(1 of 2)/ Advanced/ FFT Window/
Blackman- Harris
Meas Setup/More(1 of 2) /Advanced / FFT Window/ More(1 of 2)/
BMP
Print Setup/Print To: File/File Type
cdmaOne
MODE/
Center Freq
FREQUENCY/Channel/
Choose Option
System/More(1 of 3)/More(2 of 3) /Install/
Choose Option
System/More(1 of 3)/More(2 of 3) /Uninstall/
58
Chapter 2
Using System Features
Key Locations
Table 2-1
Key Access Locations
Key Access Path
Clear Error Queue(s)
System/Show Errors/
Color Print
Print Setup/Print To: Printer/Printer Type: Custom/Define Custom/Color
Printer: Yes
Color Printer
Print Setup/Print To: Printer/Printer Type: Custom/Define Custom
Comb
Input/IF Align Signal/Signal Type/
Config I/O
System/
Corrections
System/Alignments/
Counts
MODE/Basic, Meas Setup
Current
View/Trace/ Trace Display/
Current Trace
Marker/ More(1 of 2)/Marker Trace/
Custom
Print Setup/Print To: Printer/Printer Type
CW
Input/IF Align Signal/Signal Type/
Data Packing
Meas Setup/More(1 of 2)/
Decimation
Meas Setup/More(1 of 2)/ Advanced/More (1 of 2)/
Define Custom
Print Setup/Print To: Printer
Delay
Mode Setup/Trigger/Ext Front/
Delay
Mode Setup/Trigger/Ext Rear/
Delay
Mode Setup/Trigger/RF Burst/
Delay
Mode Setup/Trigger/Video/
Delta
Marker/
Diagnostics
System/More (1 of 3)/
Note: Requires Password
Display
Front Panel
Emulated GPIB
Name
System/Config I/O/ SICL Server
Emulated GPIB
Logical Unit
System/Config I/O/ SICL Server
Emulated GPIB
Address
System/Config I/O/ SICL Server
Enter
Front Panel
ESC
Front Panel
Chapter 2
Using System Features
Key
59
Using System Features
Key Locations
Using System Features
Table 2-1
Key Access Locations
Key
Key Access Path
Exit Main Firmware
System/ More (1 of 3)/More (2 of 3)/ Install/
Ext Front
Mode Setup/ Trigger/
Ext Rear
Mode Setup/ Trigger/
Fast ACP
Mode/ACP/Meas Setup/More(1 of 2)/
FFT Length
Meas Setup/More(1 of 2)/ Advanced/FFT Size/
Note: This feature is used when measurement is set to spectrum.
FFT Size
Meas Setup/ More(1 of 2)/ Advanced/
Note: This feature is used when measurement is set to spectrum.
FFT Window
Meas Setup/ More(1 of 2)/ Advanced/
Note: This feature is used when measurement is set to spectrum.
File
Front Panel
File System
System/More(1 of 3)/ More(2 of 3)/
File Location
Print Setup/Print to File
File Type
Print Setup/Print to File
Flat Top
Meas Setup/More(1 of 2)/ Advanced/ FFT Window/
Frame
MODE/Basic, Meas Setup/Trig Source
Free Run
Meas Setup//Trig Source/
FREQUENCY/
Channel
Front Panel
Freq Ref
System/ Reference/
Front Panel Test
MODE/Service/More(1 of 2)/
Function
Marker/ More(1 of 2)/
Gaussian
Meas Setup/More(1 of 2) /Advanced / FFT Window/
GIF
Print Setup/Print To: File/File Type
GPIB Address
System/Config I/O/
GSM
MODE/
Hamming
Meas Setup/More(1 of 2) /Advanced / FFT Window/
Hanning
Meas Setup/More(1 of 2) Advanced / FFT Window/
Help
Front Panel
Host Name
System/Config I/O/
IF Align
Input/ Input Port/
60
Chapter 2
Using System Features
Key Locations
Table 2-1
Key Access Locations
Key Access Path
IF Align Signal
Input/
Image
Print Setup/Print to File
Instrument Name
System/Config I/O/ SICL Server
Instrument Logical
Unit
System/Config I/O/ SICL Server
Input
Front Panel
Input Atten
Input/
Input Port
Input/
Install
System/More(1 of 3)/ More(2 of 3)/
Install Now
System/ More (1 of 3)/ More (2 of 3)/ Install/
IP Address
System/Config I/O/
I/Q Input Z
Input/
I/Q Waveform
Marker/Trace/
Note: This feature is used when measurement is set to either spectrum or
waveform.
K-B 70 dB
Meas Setup/More(1 of 2)/ Advanced / FFT Window/More(1 of 2)/
K-B 90 dB
Meas Setup/More(1 of 2)/ Advanced / FFT Window/More(1 of 2)/
K-B 110 dB
Meas Setup/More(1 of 2)/ Advanced / FFT Window/More(1 of 2)/
Landscape
Print Setup/Print To: Printer/Printer Type: Custom/Orientation
Language
Print Setup/Print To: Printer/Printer Type: Custom/Define Custom
Length Ctrl
Meas Setup/More(1 of 2)/ Advanced/FFT Size/
Note: This feature is used when measurement is set to spectrum.
Level
Mode Setup/Trigger/Ext Front/
Level
Mode Setup/Trigger/Ext Rear/
License Key
System/ More (1 of 3)/ More (2 of 3)/ Install/
Line
Meas Setup/ Trig Source/
Load State
File/
Local (System)
Note: Press the front panel System key to change from remote to local
control of the instrument
Log-Pwr Avg
Meas Setup/Average/Avg Type/
Chapter 2
Using System Features
Key
61
Using System Features
Key Locations
Using System Features
Table 2-1
Key Access Locations
Key
Key Access Path
Long
Meas Setup/More(1 of 2)/
Advanced/ More (1 of 2)/
Data Packing/
Manual
Meas Setup/More(1 of 2)/ Advanced /ADC Range/
Note: This feature is used when measurement is set to either spectrum or
waveform.
Marker
Front Panel
Maximum
Connections
System/Config I/O/ SICL Server
Mrkr All Off
Marker/More(1 of 2)/
Maximum
Meas Setup/ Average/ Avg Type/
Max Total Pwr
Input/
Measure
Front Panel
Meas BW
MODE/Basic, Meas Setup
Meas Control
Front Panel
Meas Interval
MODE/Basic, Meas Setup
Meas Setup
Front Panel
Medium
Meas Setup/More(1 of 2)/Advanced/ More (1 of 2)/Data Packing/
Minimum
Meas Setup/Average/ Avg Type/
Min Pnts/ RBW
Meas Setup/More(1 of 2)/ Advanced/FFT Size/
Note: This feature is used when measurement is set to spectrum.
MODE
Front Panel
Mode Setup
Front Panel
Next Window
Front Panel
Noise
Marker/ Function/
Normal
Marker/
Off
Marker/
Orientation
Print Setup/Print To: Printer
Pause
Meas Control
PCL3
Print Setup/Print To: File/File Type
PCL5
Print Setup/Print To: File/File Type
Peak Level
Mode Setup/ Trigger/ RF Burst/
62
Chapter 2
Using System Features
Key Locations
Table 2-1
Key Access Locations
Key Access Path
Power Stat CCDF
MODE/Basic, Meas Setup
Portrait
Print Setup/Print To: Printer/Printer Type: Custom/Orientation
Pre-ADC BPF
Meas Setup/ More(1 of 2)/ Advanced/
Note: This feature is used when measurement is set to either spectrum or
waveform.
Pre-FFT BW
Meas Setup/ More(1 of 2)/ Advanced/
Note: This feature is used when measurement is set to spectrum.
Pre-FFT Fltr
Meas Setup/ More(1 of 2)/ Advanced/
Note: This feature is used when measurement is set to spectrum.
Print
Front Panel
Printer
Print Setup/
Printer Type
Print Setup/Print To: Printer
Print Setup
Front Panel
Prints/Page
Print Setup/ Print To: Printer
Print To
Print Setup/
Pulse
Input/IF Align Signal/Signal Type/
Pwr Avg (RMS)
Meas Setup/Average/Avg Type/
Pwr vs Time
MODE/Service/
RBW Filter
Meas Setup/ More(1 of 2)/ Advanced
Note: This feature is used when measurement is set to spectrum.
Reference
System/
Ref Position
AMPLITUDE/Y Scale/ for spectrum or waveform - or - SPAN/XScale/ for
waveform.
Ref Values
AMPLITUDE/Y Scale/ for spectrum or waveform - or - SPAN/XScale/ for
waveform.
Res BW
Meas Setup/
Note: This feature is used when measurement is set to either spectrum or
waveform.
Restart
Front Panel
Restore Align
Defaults
System/Alignments/
Restore Meas
Defaults
Meas Setup/ More(1 of 2)
Chapter 2
Using System Features
Key
63
Using System Features
Key Locations
Using System Features
Table 2-1
Key Access Locations
Key
Key Access Path
Restore Sys
Defaults
System/ More(1 of 3)/ More (2 of 3) /
Return
Front Panel
RF
Input/Input Port/
Align RF
System/Alignments/Align Subsystem/
RF Burst
Mode Setup/ Trigger/
RF Envelope
View/Trace/
Note: This feature is used when measurement is set to waveform.
RF Envelope
Marker/Trace/
Note: This feature is used when measurement is set to waveform.
RF Inp Level
System/Alignments/Align Subsystem/ Align 50 MHz Reference/
Save
Front Panel
Save State
File/ or Save/
Scale Coupling
AMPLITUDE/Y Scale/ for spectrum or waveform - or - SPAN/XScale/ for
waveform.
Scale/Div
AMPLITUDE/Y Scale/ for spectrum or waveform - or - SPAN/XScale/ for
waveform.
SCPI LAN
System/Config I/O/
Search
Front Panel
Select
Marker/
Sensors
MODE/Service/
Server
System/Config I/O/ SICL Server
Service
MODE/
Service Password
System/More(1 of 3)/Show System/
Shape
Marker/More (1 of 2)/
Short
Meas Setup/More(1 of 2)/ Advanced/More (1 of 2)/Data Packing/
Show Errors
System/
Show System
System/More(1 of 3)/
SICL Server
System/Config I/O/
Signal Amptd
Input/IF Align Signal/
Signal Rate
Input/IF Align Signal/
64
Chapter 2
Using System Features
Key Locations
Table 2-1
Key Access Locations
Key Access Path
Signal Type
Input/IF Align Signal/
Slope
Mode Setup/Trigger/Ext Front
Slope
Mode Setup/Trigger/Ext Rear/
Slope
Mode Setup/Trigger/RF Burst/
Slope
Mode Setup/Trigger/Video/
Socket Port
System/Config I/O/ SCPI Lan
Span
Meas Setup/
SPAN/
X Scale
Front Panel
Spectrum
View/Trace/
Note: This feature is used when measurement is set to spectrum.
Spectrum
Marker/Trace/
Note: This feature is used when measurement is set to spectrum.
Spectrum Avg
Marker/Trace/
Note: This feature is used when measurement is set to spectrum.
Spectrum
(Freq Domain)
MODE/Service/
Spectrum
(Freq Domain)
MODE/Basic/
Store Abs Ampl to
EEROM
System/Alignments/Align Subsystem/ Align 50 MHz Reference/
Subnet Mask
System/Config I/O
Sweep Time
Meas Setup/ Can be accessed when measure is set to waveform.
System
Front Panel
Telnet Port
System/Config I/O/ SCPI Lan
Timebase Freq
MODE/Service/
Trace
Marker/
Trace Display
View/Trace/
Trigger
Mode Setup/
Note: This feature is used when measurement is set to either spectrum or
waveform.
Trig Holdoff
Mode Setup/ Trigger/
Note: This feature is used when measurement is set to either spectrum or
waveform.
Chapter 2
Using System Features
Key
65
Using System Features
Key Locations
Table 2-1
Key Access Locations
Key Access Path
Trig Source
Meas Setup/
Note: This feature is used when measurement is set to either spectrum or
waveform.
Uniform
Meas Setup/More(1 of 2)/Advanced / FFT Window/
Uninstall
System/ More (1 of 3)/ More (2 of 3)/
Uninstall Now
System/ More (1 of 3)/ More (2 of 3)/ Uninstall/
Verbose
System/Show Errors/
Video
Mode Setup/ Trigger/
View/Trace
Front Panel
Visible Align
System/Alignments/
Voltage Avg
Meas Setup/Average/ Avg Type/
Waveform
(Time Domain)
MODE/Basic/
Waveform
(Time Domain)
MODE/Service/
WindowLength
Meas Setup/More(1 of 2)/ Advanced/FFT Size/
Note: This feature is used when measurement is set to spectrum.
WMF
Print Setup/Print To: File/File Type
Zoom
Front Panel
Using System Features
Key
66
Chapter 2
Using System Features
Using Print and Print Setup Functions
Using Print and Print Setup Functions
Keys in the Print Setup menus enable you to print displayed screen
images to a variety of printers, as a file in a variety of formats to the C:
drive flash memory, or to the built-in floppy disk drive. The Print key is
used to execute choices made in the Print Setup menus.
Printing a Displayed Screen
1. Connect a compatible printer via the parallel port on the rear panel.
2. Press Print Setup, then toggle the Print To key to select Printer.
3. Press Printer Type, then select Custom.
4. Press Define Custom, then select a Language, either PCL3 or PCL5.
(In general, modern laser printers use PCL5 while inkjet printers
use PCL3.)
5. Select Color Printer Yes / No depending on the capability of the
printer.
6. If your printer uses PCL5 you can select Orientation, then
Portrait or Landscape as appropriate. Orientation is unavailable
with PCL3 printers, which always default to portrait orientation.
7. Toggle Color Print - On/Off to enable or disable color printing once
the Color Printer key (see above) is set to Yes.
8. Toggle Prints /Page (1 or 2) to select to print either one image (in
portrait orientation) covering half a page, or two images (in portrait
orientation), each covering half the page.
9. Press the Print key. A copy of the current display screen will be sent
to the printer according to the parameters set above.
10. If you want to reprint the most recently printed page, press
Reprint.
11.If you want to eject a page from a compatible printer, toggle
More (1 of 2), then Eject Page.
12. If a printer failure occurs (for example, if the printer hangs up),
press Reset Printer. It may also be necessary to cycle printer power.
Using System Features
Chapter 2
67
Using System Features
Using Print and Print Setup Functions
The following table illustrates the Print Setup menu. Level 1 shows key
choices available when the front panel key is pressed. Level 2 shows
key choices available when Print To is set to Printer and Level 1 keys are
pressed.
Front Panel Key
Level 1
Print Setup
Print To with Printer
selected
Printer Type
Level 2
None
Custom
Define Custom
Language PCL3/PCL5
Color Printer Yes/No
Orientation (Only active
for PCL5 language;
printers with PCL3
language default to
portrait orientation)
Portrait
Landscape
Color Print (Only active
when Color Print is set
to Yes- see above.)
On/Off
Prints/Page 1 / 2
More (1 of 2)
Reprint (Only active
after initial printing.)
Eject Page
Reset Printer
Using System Features
More (2 of 2)
68
Chapter 2
Using System Features
Using Print and Print Setup Functions
Printing a Screen Image to a File on A: or C: Drives
1. Press Print Setup, Print To. Toggle the Print To key to select File.
2. Press the File Type key, then select between gif, bmp, and wmf
formats.
3. To print a file to the floppy drive, toggle the File Location key to A:
and insert a 3.5” HD floppy disc, formatted for MS-DOS, into the
front panel disk drive.
To print a file to the internal flash memory, toggle the File Location
key to C:.
4. Select the Image format to be stored on the disk. Use Normal to store
an image that is identical to the currently displayed image, with a
black background. Use Invert, which provides a a light background
with a dark trace, to minimize ink and toner consumption.
5. Press HCOPy Dest, then select Printer. This enables you to generate
up to six files containing screen images.
Note:
if HCOPy Dest is set to FPanel only one file can be saved to memory or
a floppy disk. Any subsequent screen files will overwrite the file
currently saved in the A: or C: drives. For these reasons, Printer is
usually the preferred selection.
6. Press the front panel PRINT key. If you have set HCOPy to Printer, six
filenames will appear in the menu keys: screen1.xxx, screen2.xxx,
screen3.xxx, screen4.xxx, screen5.xxx, and screen6.xxx (the xxx
extension will be gif, bmp, or wmf, depending on the file type
selected in File Type). The destination drive name will also be
displayed.
Press the appropriate screen#.xxx key. Files written to the A: drive
will be located at A:screen#.xxx. Files written to the C: drive may
be accessed by the following path: /users/ftp/pub/screen#.xxx.
Six files may be stored at the same time to either location. Any
subsequent files stored to the same filename will overwrite the
existing file
Files located on the C: drive may be retrieved over the LAN by ftp
with the use of an external computer
Chapter 2
69
Using System Features
7. The disk may be removed from the A: drive once the LED on the
disk drive is off. Any files you have saved are now available to be
printed through use of an external computer and printer, or to be
imported into an electronic document.
Using System Features
Using Print and Print Setup Functions
The following table illustrates the keys used and key choices available
to print a screen image to either the A: internal floppy disk drive or the
internal C: drive flash memory. Level 1 shows key choices available
when the front panel key is pressed. Level 2 shows key choices
available when Print To is set to File and Level 1 keys are pressed.
Front Panel Key
Level 1
Print Setup
Print To with File
selected
File Type
Level 2
GIF
BMP
WMF
File Location A:/C:
Image Invert/Normal
HCOPy Dest
FPanel/Printer
Print
= Print to Key
Printer
(the six screen files
shown below are
available only when
HCOPy Dest is set to
Printer.)
screen1.xxx (xxx
depends on File Type)
screen2.xxx
screen3.xxx
screen4.xxx
screen5.xxx
Using System Features
screen6.xxx
70
Chapter 2
Using System Features
Using File and Save Keys
Using File and Save Keys
The File and Save keys enable you to save instrument states to memory
and to load instrument states into the instrument from memory. For
instructions on how to save a screen image to a floppy disc, see Saving a
Screen Image to a Floppy Disc on page 67.
Front Panel Key
Level 1
Level 2
Level 3
File
Load State
numeric entry
Enter
Save State
numeric entry
Enter
numeric entry
Enter
Save
Loading a State
1. Press File, Load State. A label in the active function area will read
Load State.
2. Use the numeric keypad to enter the number of the register from
which you desire to retrieve a state (you can retrieve states from
registers 0 to 19), then press the Enter key.
Saving a State
1.Press File, Save State or press the front panel Save key. An active
function labeled Save State will appear.
2. Use the numeric keypad to enter the desired state number (you can
enter values from 0 to 19), then press the Enter key.
Using System Features
Chapter 2
71
Using System Features
Using File and Save Keys
Using the Alpha Editor Keys
The alpha editor enables you to enter text. All text entries are displayed
in the active function area.
Level 1
Level 2
Level 3
Example
ABCDEFG
abcdefg
():;,’
V
HIJKLMN
hijklmn
_!? ~
W
OPQRSTU
opqrstu
+ - * / <> =
X
VWXYZ
vwxyz
|/\{} []
Y
Done
Done
@ # $% ^ &
Z
Space
Space
Space
More (1 of 3)
More (2 of 3)
More (3 of 3)
1. Pressing a key that requires you to enter a string gives you access to
the alpha editor. Choose Option, License Key, and Host Name are some
of those keys. When one of these keys is pressed, you will see the
menu which is shown in level 1 of the table above.
2. To enter an upper case letter, press the key which contains the letter
you wish to select. In the example table above, pressing VWXYZ lets
you select the key labelled upper case Y. The Y will then appear in
the active function area. Press More (1 of 3) to access the lower case
letters and More (2 of 3) to access mathematical symbols and
punctuation marks.
3. To enter a digit, 0 through 9, use the numeric keypad.
4. To enter a space, press the Space key, which is available on both the
letters and the symbols Alpha Editor menus.
5. Press the Return front panel key to return to the previous menu
without entering characters.
6. If you need to correct a character you have entered, you can use the
backspace key to move the cursor in the active function area to the
character you need to correct.
Using System Features
7. Once you have completed entering all characters, press the Done key.
8. Pressing the ESC key at any time prior to pressing the Done key will
clear the new entry and leave the previous entry unchanged.
72
Chapter 2
Using System Features
Using Input/Output Configuration Keys
Using Input/Output Configuration Keys
There are several keys available to help configure the instrument front
panel and rear panel inputs/outputs. These include the various buses,
external reference, and other types of I/O.
Configuring I/O
Press System, Config I/O to access keys and menus that enable you to
identify and change the current GPIB address, to identify and change
various LAN settings.
Front Panel Key
Level 1
Level 2
System
Config I/O
GPIB Address
Level 3/Entry
IP Address
Host Name
Alpha Editor
Subnet Mask
SCPI LAN
Telnet Port
Socket Port
SICL Server
Server
Maximum
Connections
Instrument Name
Instrument Logical
Unit
Emulated
GPIB Name
Emulated GPIB
Logical Unit
Emulated
GPIB Address
Ethernet Addr
• IP Address - Changes the IP (internet protocol) address, domain
name and node (host) name for the instrument. The IP address of
Chapter 2
73
Using System Features
• GPIB Address - Shows the current GPIB address (18 is the default
setting) and allows you to change this value. The new value is
displayed in the active function area. The GPIB port is always
active.
Using System Features
Using Input/Output Configuration Keys
the instrument can be changed by entering a numeric address
composed of numbers and decimal points.
• Host Name - Displays the host name of the instrument. Pressing
the key activates the alpha editor, which enables you to change the
host name. However, this will not change your LAN system
representation of the host name. You must work through your local
system administrator to change the host name. Changing it in the
instrument only changes the displayed information, it will not
enable LAN access with the new name.
• Subnet Mask - Changes the subnet mask of the instrument. The
subnet mask is a 32-bit address mask used in IP networks to
indicate the bits of an IP address that are used for the subnet
address. The default address is 255.255.0.0 for a class B network.
• SCPI LAN - Accesses the following keys:
Telnet Port - Turns on or off telnet programming over the LAN.
This key only affects new connections, not existing connections.
Enter the port number that you will use for your telnet
connection to the transmitter tester. The default port number is
5023.
Socket Port - Turns on or off socket programming over the LAN.
This key only affects new connections, not existing connections.
Enter the port number that you will use for your socket
connection to the transmitter tester. The default port number is
5025.
• SICL Server - Accesses the following keys. These keys are provided
for information only. The “value” of the settings cannot be changed.
Server - Indicates the on/off condition of the SICL IEEE 488.2
protocol LAN server.
Maximum Connections - Shows you the maximum number of
connections that can be accessed simultaneously. The default is 5.
Instrument Name - Shows you the name (same as the remote
SICL address) of your transmitter tester. The default is inst0.
Instrument Logical Unit - Shows you the unique integer
assigned to your transmitter tester when using SICL LAN. The
default is 8.
Using System Features
Emulated GPIB Name - Shows you the name (same as the
remote SICL address) of the device used when communicating
with your transmitter tester. The default is gpib7.
Emulated GPIB Logical Unit - Shows you the unique integer
assigned to your device when it is being controlled using SICL
LAN. The default is 8.
Emulated GPIB Address - Shows you the emulated GPIB
74
Chapter 2
Using System Features
Using Input/Output Configuration Keys
address assigned to your transmitter tester when it is a SICL
server. This address is set using the GPIB Address key.
• Ethernet Addr - Shows the Ethernet address. This is an
information only feature that can not be modified by the user.
NOTE
For more information about these and other remote programming
features, refer to the programmer’s guide for your transmitter tester.
File System
Press System, More (1 of 3), More (2 of 3) to access the File System key.
The label of the File System key shows the current amount of Used
memory and Free memory in units of megabyte (MB).
Reference
Press the Reference menu key to activate a menu which allows you to
select an external reference, or to deactivate a 10 MHz out signal on the
rear panel.
Front Panel
Key
Level 1
Level 2
Toggle
Entry
System
Reference
Freq Ref
Int/Ext
When toggled
to Ext, enter
any value
between 1
and 30 MHz
10 MHz Out
Off/On
• Freq Ref - Allows you to select an external or an internal (the
default) reference. When toggled to Ext (external) you will set the
external reference frequency by entering a value between 1 and 30
MHz. When the instrument is locked to an external reference a
green Ext Ref indicator will appear in the annunciator bar.
NOTE
• 10 MHz Out - Activates, or deactivates, the 10 MHz out signal on
the rear panel of the instrument. The 10 MHz out can be used to lock
Chapter 2
75
Using System Features
External reference values are persistent. This means that the external
reference frequency you select will remain active until it is changed,
even if the instrument is turned off and on, or preset. If the frequency
you have input to the rear panel external frequency connector is not the
same as the external frequency value you have manually set, a red Ext
Ref error indicator and a red Unlock error indicator will appear in the
annunciator bar.
Using System Features
Using Input/Output Configuration Keys
Using System Features
other test equipment to the same frequency reference that is used by
the transmitter tester. Once activated, the 10 MHz out feature is
persistent, so if it is set to On it will remain on, even if the
instrument has been preset, or powered off and then on.
76
Chapter 2
Using System Features
Using System Configuration and Alignment Keys
Using System Configuration and Alignment
Keys
There are number of different keys that can help you with
understanding the current instrument configuration and for hardware
alignment.
NOTE
Some features are intended for use only by service personnel and
cannot be accessed without a service password. If after pressing a key a
message appears requesting entry of a password, you should
understand this to indicate that this feature is meant for service use
only. The password is not available unless the user has purchased the
service guide.
Restore System Defaults
Press System, More (1 of 3), More (2 of 3) to access the Restore Sys
Defaults key. There are some instrument functions that stay set to the
last value that you selected even if you press the instrument preset key
or turn the power off and on. The Restore Sys Defaults key allows you to
preset those functions back to the original factory settings.
NOTE
Pressing this key will preset functions like the GPIB/IP address,
external reference/trigger settings and auto-alignment selection. You
will have to reset these items to return to the your previous setup.
Show Errors
Press System, Show Errors to activate a menu with features that
enable you to move around in the error history queue, and to clear the
error queue.
Front Panel Key
Level 1
Level 2
System
Show Errors
Top Page
Last Page
Next Page
Clear Error Queue(s)
Verbose
• Clear Error Queue(s) - The error history queue retains and
displays all errors once they have been detected, even if they are no
Chapter 2
77
Using System Features
Prev Page
Using System Features
Using System Configuration and Alignment Keys
longer detected after a period of time has elapsed. After reviewing
the error queue you will likely want to clear it before making
another measurement. Note that if an error condition exists
continuously, the error will not appear in the queue after the error
history queue has been cleared.
• Verbose - When an error is made in using the instruments
programming commands, the verbose feature displays the command
in which an error has been detected. An error indicator will appear
in the displayed command line immediately following the entry that
caused the error. This feature can help you troubleshoot
programming problems.
You can exit the error history queue display to return to a measurement
display by pressing the ESC or the Return key.
Show System
Press System, More (1 of 3), Show System to access the two-page show
system display. The first page shows firmware and option information
(see Figure 2-1). Press More (2 of 3) to access the second page, which
shows option and hardware status information (see Figure 2-2).
Under the Show System menu is a key that enables you to enter a
password, and four information-only keys, in a lighter font, that show
the serial number, model designation, firmware revision, and host ID
for your instrument.
NOTE
Diagnostics features require a service password. The password is only
available if the service guide has been purchased. All service diagnostic
features are described in the service guide.
Front Panel Key
Level 1
Level 2
System
Show System
Service Password
Model
Serial Number
Firmware Rev
Using System Features
Host ID
Next Page
Prev Page
Diagnostics
The display lists all the measurement options/modes available at the
time the firmware was installed or upgraded. It shows whether or not
the code for each option is currently installed in memory. It may not be
78
Chapter 2
Using System Features
Using System Configuration and Alignment Keys
possible to fit all the options into your available memory. Hardware
information includes the name of boards along with part, serial number,
and revision information.
The display also indicates whether you have the license key installed
that gives you access to a particular option/mode. It is possible to have
the license key installed but not have the program code, or to have the
program code with no license key. Either situation will prevent the
option from running.
Show System Displays
Figure 2-1
Firmware and Option Information (first page)
Using System Features
Chapter 2
79
Using System Features
Using System Configuration and Alignment Keys
Figure 2-2
Option and Hardware Information (second page)
System (Local)
Using System Features
Pressing the System front panel key will return the instrument to local
control if the instrument was in remote mode being controlled by an
external computer.
80
Chapter 2
Using System Features
Using System Configuration and Alignment Keys
Alignment
Press System, Alignments to access menus which enable you to align
the instrument. Press the ESC key to stop any alignment. The table
below diagrams the paths through which you will access alignment
feature keys. The feature in the cell that is greyed-out requires a
password.
Front
Panel Key
System
Level 1
Alignments
Level 2
Auto Align
Level 3
On/Alert/Off
Align All Now
Align Subsystems
Align RF
Align IF
Align ADC
Align 50 MHz
Reference
Align Current IF
Flatness
Align Current
Sysgain
Corrections
On/Off
Time Corr
Auto/On/Off
Restore AlignDefaults
Visible Align
Off/Low/High
Auto Align - Defaults to the alert state. When set to Alert, the auto
align feature causes a message to appear 24 hours after the last
alignment to tell you that the instrument needs to be aligned. This
message will also appear if there is a change of ambient temperature
greater than ± 3° C. Use the Align All Now key. If the message has
appeared and then the Mode is changed, the message will be cleared
without running an alignment.
• Align All Now - Immediately activates an alignment on all of the
instrument’s standard RF, IF, and ADC alignments. All other
operations are stopped and the alignments progress will be visible on
the display.
Align Subsystem - Allows you to activate one or a group of the
Chapter 2
81
Using System Features
When set to the On state an alignment (which slows down
measurements) automatically occurs every 5 minutes or when a
change in ambient temperature of greater than ± 3° C has occurred.
Using System Features
Using System Configuration and Alignment Keys
standard internal instrument alignments. Perform alignments on
circuitry relating to the following internal alignments. Press the ESC
key to cause any alignment to stop.
Align RF - Activates an alignment on the RF circuitry.
Align IF - Activates an alignment on the IF circuitry. The main
gain of the Analog IF is used to compensate for prefilter BW gain
variations so the gain of the entire IF path before the A/D
remains constant.
Align ADC - Activates an alignment on the ADC circuitry.
Align 50 MHz Reference - Enables a service technician to
adjust the amplitude of the internal 50 MHz reference signal for
absolute amplitude accuracy. The test equipment and the
adjustment procedure required are described in the E4406A
service guide.
NOTE
The Align 50 MHz reference feature can only be activated if you have a
service password. The password is not available unless the user has
purchased the service guide.
Align Current IF Flatness - Activates an immediate
measurement of the current IF flatness, for FFT spectral
amplitude compensation. Normally this alignment occurs in the
background when the instrument bandwidth is changed. Given
the current BW and Gain DAC settings for a measurement,
alignment is done using the comb calibration signal. The relative
amplitude of combs within the BW are compared to expected
amplitudes to generate the effective shape of the current IF path.
Using System Features
If Time Corrections are active, this alignment generates complex
IF responses (magnitude and phase) rather than just the original
scalar (magnitude) response. The complex alignment requires
reasonable delay estimation, and improved trigger compensation
so the phase response of several averaged measurements can be
unwrapped properly.
Align Current SysGain - Activates a fine-tuning adjustment of
the system gain. This is done by measuring the response of the
current system state configuration to the 50 MHz amplitude
reference signal. All subsequent measurements are then
compensated appropriately for absolute amplitude accuracy.
Normally this occurs in the background when the instrument
bandwidth is changed.
• Corrections - When set to On (the default state), the alignment
firmware applies many numerical corrections to improve amplitude
accuracy of the measurement. This includes an absolute amplitude
adjustment at center frequency, and IF flatness correction for FFT
82
Chapter 2
Using System Features
Using System Configuration and Alignment Keys
spans (spectral measurements). When corrections are Off, the
background alignments which determine corrections are disabled.
Corrections is a background feature which runs automatically, while
the instrument is on.
• Time Corr - Time corrections are the application of a complex filter
directly onto the time capture data. It compensates for the complex
(magnitude and phase) response of the analog and digital IF
hardware. Time corrections are less efficient (take more CPU cycles)
than frequency corrections when only scalar (magnitude) FFT
flatness is required, but for demod or other time-based (not FFT)
measurements, only time corrections can improve the flatness of
imperfect IF hardware. If the time correction functionality is set to
Auto (the default), the individual measurements activate the
corrections when they are needed.
• Restore Align Defaults - Restores the instrument’s align defaults.
This feature will only be needed if the instrument calibration locks
up, which may occur as a result of hardware problems. Once the
defaults are restored a message will appear informing you that
alignment is needed.
• Visible Align - When toggled to Off, the alignment traces which are
visible in the display during an alignment will be turned off, and the
alignment process will take less time. When set to High, every
alignment trace is shown, resulting in the alignment taking more
time than when Visible Align is set to Low (the default state), where
one out of ten traces is shown. Note that text showing alignment
results is displayed on screen when any alignment is activated, even
when the visible alignment is set to Off.
Using System Features
Chapter 2
83
Using System Features
Using System Features
Using System Configuration and Alignment Keys
84
Chapter 2
Setting the Mode
3
Setting the Mode
A set of mode parameters such as input and trigger settings applies to
each mode. These settings affect all measurements and measurement
setup parameters in the current mode.
85
Setting the Mode
Setting the Mode
Selecting a Mode
Selecting a Mode
The Mode menu key is used to select the measurement personality you
have purchased with your instrument, or to select the basic or service
modes, which are native to the instrument. Upon turn-on the
instrument will default to the basic mode.
• Mode - Accesses the measurement personality mode. Press the key
that corresponds to the mode you want to select, such as GSM or
cdmaOne. For a full explanation of the personality mode you have
purchased, see the documentation which comes with that option.
• Basic - This mode is useful for making measurements that are not
preset to industry standards. They can be used for troubleshooting
your devices. Press Mode, Basic to switch to the basic mode, and
bring up the measurements menu. For more information on these
measurements go to “Basic Measurements” on page 92.
• Service These features will help you check the functionality of your
instrument. Press Mode, Service, to switch to the service mode, and
bring up the service measurements menu. Features accessed
through this menu include tests which check the timebase frequency,
the sensors on the RF board, and the functionality of the front panel
keys. For more information on these features go to “Service
Measurements” on page 141.
The basic waveform and spectrum measurements are available as
well as a power vs time measurement which is used only for
self-diagnostic purposes. The measurement setup parameters that
you select while in Service mode are only used for service mode. The
Basic mode settings are independent. For descriptions of the
spectrum and waveform measurements refer to “Spectrum
(Frequency Domain) Measurements” on page 101 and “Waveform
(Time Domain) Measurements” on page 112.
Note that spectrum and waveform measurements are available in each
personality mode, as well as in the basic and service modes. Each with
their own independent mode settings.
Press Preset to set the instrument to a known factory default state. This
sets all parameters to their factory default values for the selected mode.
Preset does not switch the modes.
NOTE
Some features are intended for use only by service personnel and
cannot be accessed without a password. If after pressing a key, a
message appears requesting entry of a password, this means that the
feature is meant for service use only. The password is only available
through the service guide.
86
Chapter 3
Setting the Mode
Mode Setup
When you select a mode the instrument automatically presets settings
to defaults for that mode. These defaults apply to all measurements in
the mode.
Mode settings are persistent. When you switch from one mode to
another mode, the settings you have chosen for the modes will remain
active until you change them. This allows you to switch back and forth
between modes without having to reset settings each time. Presetting
the instrument will return all current mode settings to their default
values. Powering the instrument off and on will reset all mode settings
to their default values.
NOTE
Before making measurements, it is important to set the parameters
under the mode setup key for the device to be tested. These parameters
are not saved when you preset or power the instrument off and on, so
you may want to save them in an instrument state for later use.
The Mode Setup key accesses: (1) the Input key menu of features
including selecting inputs, changing input attenuation, and modifying
IF align settings, and (2) the Trigger key menu which lets you to choose
trigger setup states for the instrument.
Input Keys
By pressing the Input key you access menus that select an input port,
adjust input attenuation, and adjust the IF align signal.
Activate an Input Port and Adjust Input Power
• Input Port key. The Input Port menu key accesses a menu which
allows you to select one of the following input keys: RF, 50 MHz Ref,
and IF Align. These keys are explained below.
RF key. Use the RF key to reactivate the RF input after a
different input has been activated. This is a 50 Ω connector.
50 MHz Ref key. Selects the internal 50 MHz CW reference
signal. The displayed signal amplitude will be −25 dBm.
IF Align key. The IF align signal is an internal calibration signal
used during the auto align process.
Chapter 3
87
Setting the Mode
Mode Setup
Setting the Mode
Setting the Mode
Mode Setup
Adjust Input Attenuation and Input Power.
• Max Total Pwr key. The Max Total Pwr key can be activated only
when Input Port is set to RF. Max Total Pwr allows you to enter
maximum power levels (−15 dBm is the default value) for the RF
input. The maximum total power setting is coupled to the input
attenuation setting.
• I/Q Input Z key. The I/Q Input Z key can be activated only when Input
Port is set to I/Q. The I/Q Input Z key enables you to choose an input
impedance of either 50 Ω or 600 Ω. An input impedance of 600 Ω may
be needed for certain telecommunications applications.
• Input Atten key. The Input Atten feature can be activated only when
Port is set to RF. The Input Atten feature allows you to enter the
attenuation value. The input attenuation can be set at values from
0 to 40 dB in increments of 1 dB. The input attenuation setting is
coupled to the maximum total power setting.
NOTE
The Max Total Pwr and Input Atten settings are coupled together. When
you switch to a different measurement, the Max Total Pwr is kept
constant, but the Input Atten may change if the two measurements have
different mixer margins. Thus, you can directly set the transmitter
tester input attenuation, or you can set it indirectly by specifying the
maximum expected power at the UUT (Max Total Pwr setting).
Adjust the IF Align Signal.
NOTE
The IF align signal adjustments are advanced features. IF align rate,
amplitude and type should not be modified unless you are familiar with
IF align functionality.
• Signal Rate - The signal is modulated by a digital sequence that can
be set to 1 of 13 positions (rate 0 through 12) to cause the comb
spacing (or pulse timing) of the alignment signal to widen or narrow.
At the position of 1 the signal rate is set at its maximum value of
234.375 kHz. This frequency rate value will appear in the menu key
label. Each time the position integer is incremented, the signal rate
is halved. For example, at a position of 2 the signal rate is 117.188
kHz.
• Signal Amptd key. To modify the signal amplitude you will enter a
DAC value between 0 - 4095. The amplitude range is 0 to 50 dB.
Incrementing the DAC value increases the amplitude of the signal in
a linear fashion, and will be visible on screen. The default DAC value
is 500.
• Signal Type key. This menu allows you to select a CW (a tone that
appears in the center of the IF), comb, or pulse type signal as the IF
align signal.
88
Chapter 3
Setting the Mode
Mode Setup
The Trigger key accesses the mode setup menu for the following trigger
sources. See “Trigger Source” on page 96 for a description of trigger
sources including:
• RF Burst (Wideband)
• Video (IF Envlp)
• Ext Front
• Ext Rear
Pressing one of the trigger source keys will access the mode setup
menu. This menu is used to set the Delay, Level, and Slope for each
trigger source. Note that the actual trigger source is selected separately
for each measurement (under the Meas Setup key).
• Delay key. This key is used to set the delay time for trigger sources.
For trigger delay use positive values. For pre-trigger delay use
negative values. The range of the trigger delay is −500 ms to
+500 ms.
• Level key. For the RF Burst (Wideband) selection the level is relative
to the peak level of the RF signal (for the RF Burst trigger you will
enter a peak level value with a key labelled Peak Level, rather than
Level). For the Video selection the level is the value, in dBm at the
RF input, that will cause the trigger. For the Ext Front and Ext Rear
selections, the level range is −5 to +5 volts.
• Slope key. This key allows you to trigger off of the positive-going
edge (Pos) or the negative-going edge (Neg) of the trigger source
signal.
Other keys accessed under the Trigger key:
• Trig Holdoff key. Sets the period of time before the next trigger can
occur.
• Auto Trig key. Acts as a trigger timeout. If no trigger occurs by the
specified time, a trigger is automatically generated. When set to On
the instrument will take data when it receives a signal from the
current trigger source; if no signal is received in the expected time
period, the time period will default to the Free Run trigger default
time period. When set to Off (the default setting) data will only be
taken if a trigger has been set, and the Free Run trigger will not be
automatically activated.
Chapter 3
89
Setting the Mode
Trigger Keys
Setting the Mode
Setting the Mode
Mode Setup
• Frame Timer key. The frame timer feature uses the internal frame
clock to generate a trigger signal.
— Period key. Sets the period of the frame clock. Values between
33 ns and 559 ms can be entered.
— Offset key. Allows entry of offset values between 33 ns and 10 s.
— Reset Offset Display key. Resets the display of the Offset key to
0 s.
— Sync Source menu key. See keys listed below.
• Sync Source key menu.
— Off key. Deactivates any sync source trigger that has been
selected and returns you to the frame timer menu.
— Ext Front key. Synchronizes the measurement to an external
sync source, such as a frame clock signal. The starting point is the
point coinciding with the external trigger point plus the external
trigger delay.
— Ext Rear key. Synchronizes the measurement to an external
sync source, such as a frame clock signal. The starting point is the
point coinciding with the external trigger point plus the external
trigger delay.
Selecting the Frequency/Channel
Use the FREQUENCY/Channel front panel key to set the center frequency
or select the channel for the measurement you want to make.
90
Chapter 3
Making Measurements
4
Making Measurements
This chapter describes measurements that are available in the Basic
and Service modes. Basic mode measurements are common to many
modulation formats. Service mode measurements are used to check the
functionality of the instrument.
91
Making Measurements
Basic Measurements
Basic Measurements
Basic measurements are useful for making measurements that are not
specified in measurement standards, and will be useful if you need to
troubleshoot a measurement operation. In addition, having spectrum
and waveform measurements available independently of personality
modes provides extra flexibility.
Making Measurements
To access the Basic mode press the Mode key and select the Basic menu
key. The following measurements are then available by pressing the
Measure key:
“Spectrum (Frequency Domain) Measurements” on page 101
“Waveform (Time Domain) Measurements” on page 112
“Adjacent Channel Power (ACP) Measurements” on page 125
“Channel Power Measurements” on page 130
“Making Power Stat CCDF Measurements” on page 133
“Using Option B7C Baseband I/Q Inputs” on page 136
“Service Measurements” on page 141
When you press the key to select the measurement it will become the
active measurement, using settings and a display unique to that
measurement. Data acquisitions will automatically begin provided
trigger requirements, if any, are met.
92
Chapter 4
Making Measurements
The 3 Steps to Set Up and Make Measurements
The 3 Steps to Set Up and Make Measurements
All measurements need to be set up in 3 steps: first at the Mode level,
second at the Measurement level, then finally the result display may be
adjusted.
1. Select and Set Up the Mode
Press MODE - All licensed, installed Modes available are shown.
Press, or select Basic mode to make measurements of signals with
non-standard formats.
2. Select and Set Up the Measurement
Press MEASURE - Select a specific measurement to be performed
(e.g.). The measurement begins as soon as any required trigger
conditions are met. The resulting data is shown on the display or is
available for export.
Press Meas Setup - Make any adjustments as required to the selected
measurement settings. The settings only apply to this measurement.
3. Select and Set Up a View of the Results
Press Trace/View - Select a display format for the current
measurement data. Depending on the mode and measurement
selected, other graphical and tabular data presentations may be
available. X-Scale and Y-Scale adjustments may also be made now.
NOTE
A setting may be reset at any time, and will be in effect on the next
measurement cycle or View.
Step
Primary Key
Setup Keys
Related Keys
1. Select & set up
a Mode
MODE
System
Mode Setup,
Input (E4406),
FREQUENCY Channel
2. Select & set up
a Measurement
MEASURE
Meas Setup
Meas Control,
Restart
3. Select & set up
a View of the
Results
View/Trace (E4406),
SPAN X Scale,
AMPLITUDE Y Scale,
Display,
Next Window, Zoom
File, Save, Print,
Print Setup, Marker,
Search (E4406),
Chapter 4
93
Making Measurements
Press Mode Setup - Make any required adjustments to the mode
settings. These settings apply to all measurement in the mode.
Making Measurements
Preparing for Measurements
Preparing for Measurements
All measurements need to be set up in 3 steps: first at the Mode level,
second at the Measurement level, then finally the result display may be
adjusted. For details on setting up a measurement using these three
steps, refer to “The 3 Steps to Set Up and Make Measurements” on
page 93
Making Measurements
Using Measure Keys
The MEASURE front panel key allows you to activate one measurement
from those available in the current mode. The measurements that are
available will vary depending on which mode you have selected. It may
be a measurement personality mode, the basic mode, or the service
mode.
Measurement Control
Following your selection of the instrument mode and mode setup you
will use keys in the Meas Control keys to control processes that affect
the running of the current measurement.
• Measure - Toggles between Single and Cont (for continuous)
measurement states. When set to Single the measurement will
continue until it has reached the specified number of averages set by
the average counter. When set to Cont the measurement will run
continuously, and perform averaging according to the current
average type (repeat or exponential). The default is continuous. See
“Averaging” on page 95 for an explanation of averaging.
• Pause - Pauses the current measurement. Once toggled, the label of
the Pause key changes to read Resume. Measurement settings can be
change while it is paused. The Resume key continues the active
measurement from the point at which it was paused.
• Restart re-initiates the current measurement from the beginning
(including averaging), without changing the current measurement
settings. If the measurement is paused, then restart is the same as
resuming from the beginning of the measurement instead of from
the point at which it was paused.
Measurement Setup
The Meas Setup key accesses features that enable you to adjust
parameters of the current measurement, such as resolution bandwidth.
You will also use the Meas Setup menu to access Average, Trig Source,
and Advanced measure setup feature menus.
The following features can be used with many measurements:
94
Chapter 4
Making Measurements
Preparing for Measurements
• Res BW - Changes the resolution bandwidth of a given
measurement. Selection of a narrower bandwidth will result in a
longer data acquisition time.
• Restore Meas Defaults - Presets only the settings that are specific
to the selected measurement. This will set the measure setup
parameters to the factory defaults, only for the currently selected
measurement.
Averaging
• Avg Number - Modifies the number of times the current
measurement will be repeated with the results from the repeated
measurements averaged. Increased averages usually give more
accurate results. There will be an increase in the time taken to make
a measurement if the number of averages is increased.
• Avg Mode - Selects between an Exp (exponential) or a Repeat mode
of averaging. This selection only affects the averaging after the
number of N averages is reached (set using Avg Number). Normal
(linear) averaging is always used until the specified number of N
averages is reached. When Measure is set to Single, data acquisitions
are stopped when the number of averages is reached. Therefore Avg
Mode has no effect on single measurements.
Exponential averaging: When Measure is set at Cont (continuous)
data acquisitions will continue indefinitely. After N averages,
exponential averaging is used with a weighting factor of N (the
displayed average count stops at N). Exponential averaging
weights new data more than old data, which facilitates tracking
of slow-changing signals. The value of N is set through use of the
Average key or the Avg Bursts key.
Repeat averaging: When Measure is set at Cont, data acquisitions
will continue indefinitely. After N averages is reached, all
previous result data is cleared and the average count is set back
to 1. This is equivalent to pressing Measure, Single and then
pressing the Restart key each time the single measurement
finishes.
• Avg Type - Allows you to select type of averaging. Only the types of
averaging that are appropriate for the current measurement are
available in that measurement. The following average types are
available:
Pwr Avg - Averages the power, which is equivalent to the rms of
Chapter 4
95
Making Measurements
Features in the Average menu allow you to modify the number,
average mode, and type of averaging you use for the currently selected
measurement. The features available for averaging will vary slightly
depending on the measurement that is currently active. On the display
averaged trace results are shown in blue, while the instantaneous
signal is shown in yellow.
Making Measurements
Preparing for Measurements
the voltage. This is the default type of averaging.
Log-Pwr Avg - The log of the power is averaged. This is also
known as video averaging.
Voltage Avg - The voltage is averaged.
Maximum - The maximum values are retained.
Minimum - The minimum values are retained.
Making Measurements
Trigger Source
Changing the Trig Source alters the trigger source for the current
measurement only. Not all of the selections are available for all
measurements. Note that the RF Burst, Video, Ext Front, and Ext Rear
menu keys found in the Trigger menu enable you to change settings to
modify the delay, level, and slope for each of these trigger sources (as
described on page 89. Choose one of the following trigger sources:
• Free Run - Triggers at the time the data is requested, completely
asynchronous to the RF or IF signals.
• Video - Is an internal IF envelope trigger. It triggers on an absolute
threshold level of the signal passed by the IF.
• RF Burst - Is an internal wideband RF burst trigger that has an
automatic level control for burst signals.
• Ext Front - Activates the front panel Ext Trigger Input. The external
trigger must be a signal between −5 and +5 volts.
• Ext Rear - Activates the rear panel Trigger In. The external trigger
must be a signal between −5 and +5 volts.
• Frame - Uses the internal frame clock to generate a trigger signal.
The clock parameters are controlled under the Mode Setup key or the
measurement firmware, not both. See the specific measurement for
details.
• Line - Activates an internal line trigger. Sweep triggers occur at
intervals synchronized to the line frequency.
Rear panel TRIGGER 1 OUT and TRIGGER 2 OUT connectors are coupled
to the selected trigger source. These trigger outputs are always on the
rising edge with a pulse width of at least 1 µs.
Changing the View
The following keys enable you to select the desired view of the
measurement and to change scale parameters for the graphic window.
View/Trace Key
View/Trace - Selects a predefined view of the current measurement and
96
Chapter 4
Making Measurements
Preparing for Measurements
highlights the selected window. Once a window is selected, the X and Y
scale keys can be used to modify scale parameters. The types of
windows, and X and Y scale parameters that are available will vary,
depending on the measurement you have activated.
• Typical Measurement Windows
Spectrum window - Select this window if you want to view a
signal in parameters of frequency and power. Changes to
frequency span or power will sometimes affect data acquisition.
For more details see the section on spectrum measurements.
I/Q Waveform window - Select this window to view the I and Q
signal characteristics of the current measurement in parameters
of voltage and time. This window is in both the spectrum and
waveform measurements.
Press View/Trace, Spectrum, to view a spectrum measurement
window, or View/Trace, Waveform to view a waveform measurement
window.
• Trace Display
All - Displays both the current and the average trace.
Average - Displays only the average trace. The average trace is
shown in blue.
Current - Displays only the trace for the latest data acquisition.
The current trace is shown in yellow.
• Span / X Scale Keys
Span key. This key allows you to modify the frequency span.
Changes in span may affect data acquisition.
Scale/Div key. This key allows you to modify the X scale
parameter in units of time.
Sweep Time key. This key allows you to modify sweep time.
Changes in sweep time will affect data acquisition.
Ref Value key. This key allows you to set the value of the
reference level for X scale display in units of time.
Ref Position key. This key allows you to place the current
reference level on the left, the center, or the right of the display.
This is used for X scale display either in units of frequency or
time.
Scale/Coupling key. This key couples the scale/division to the
Chapter 4
97
Making Measurements
Signal Envelope window - Select this window to view a signal
in parameters of time and power. For more detail see the section
on waveform measurements. Both RF and BbIQ signals can be
viewed in this window.
Making Measurements
Preparing for Measurements
sweep time for measurements made in the time domain.
• Amplitude / Y Scale Keys
Scale/Div key. This key enables you to set the dB/Division (for the
Spectrum and the RF Envelope windows) or V/Division (for the
I/Q window).
Ref Value key. This key allows you to set the value of the reference,
in units of dB (for the RF Envelope window), or in units of mV (for
the I/Q window).
Making Measurements
Ref Position key. This key allows you to move the current
reference level to the top, center, or bottom of the display.
Using Markers
Markers enable you to make measurements on screen. Keys in the
Marker menu control the number and types of markers you can access.
Trace keys allow you to select the trace on which you will activate a
marker. The Search key enables you to perform an immediate peak
search and activate a marker at the peak signal.
Paths to access any of the features listed below will be found next to the
specific key listed in the key access table which begins on page 57.
Trace
The Trace keys allow you to select the trace that will be used for the
other marker keys. You can then use marker features to obtain the
results you desire. To access Trace keys press Marker, Trace.
NOTE
The selections in the Trace menu include traces on all windows for the
current measurement, including windows that are not currently
displayed.
When making waveform measurements you can activate the following
trace keys: RF Envelope and I/Q Waveform keys.
When making spectrum measurements you can activate: Spectrum,
Spectrum Avg, and I/Q Waveform keys. The spectrum average trace
feature places a marker on the average trace in the spectrum window.
Markers
Up to four markers can appear on the display simultaneously but only
one marker can be activated and moved at a time. This marker is called
the “active” marker. Press Marker to access the keys below, except for
the Shape and Marker All Off keys, which require you to press Marker,
More (1 of 2).
• Normal - Activates a single marker on the selected trace (as set by
the trace key) in units either of frequency or time, depending on the
98
Chapter 4
Making Measurements
Preparing for Measurements
measurement mode that is currently active. However, if a marker
has previously been activated, that marker will persist as the default
marker until it is changed. You can change the position of the
marker through use of the front panel step keys and RPG knob.
Annotation in the active function area and the upper right hand
corner of the display indicate the value of the active marker in units
of the window which contains that marker. Pressing Normal also
deactivates any marker delta functions which have been activated
previously.
• Delta - Places two markers on the selected trace or, if a marker is
already active, places a second marker at the position of the active
marker. You can activate up to two sets of delta markers. Annotation
in the active function area and in the upper-right corner of the
display show differences between the two markers in the units of the
window which contains that marker.
• Off - Turns off the selected marker (as set by the Select key).
• Marker All Off - Turns off all markers.
• Shape - Allows you to select markers in the shapes of diamonds,
crosses, squares, and lines. The line markers run vertically, from the
bottom to the top of the display, while the diamond, square, and
cross shapes simply allow you to distinguish different points on the
trace by using different shapes. You may use up to four different
shaped markers at a given time, although only one may be active.
Marker Functions
The marker Function menu key enables you to use two marker
functions: Band Power and Noise. These functions do not apply to all
measurements; if you attempt to press a function key for a function that
is not applicable to that measurement a message will appear telling you
that the function is not supported under the current measurement.
These functions are described below. Press Marker, Function to access
the following keys.
• Band Power - Allows you to place two markers to either side of a
band so you can measure the power within that band. You can use
the RPG knob to move the band markers; the numerical power
reading will be visible in the upper right corner of the display. This
feature is particularly useful for measuring channel power.
• Noise - Normalizes the equivalent amplitude of the measured noise
to a 1 Hz bandwidth, which is centered around the displayed marker.
This is done by sampling and displaying the average of 32 data
Chapter 4
99
Making Measurements
• Select - Enables you to select one, or more, of the four available
markers. Once selected, a marker can be activated, or deactivated,
by using the Normal, Delta, or Function keys. If a marker has
previously been turned on and assigned to a specific trace it will
become active on that trace when the Select key is pressed.
Making Measurements
Preparing for Measurements
points.
Search Marker
Making Measurements
The front panel Search key performs a peak search when pressed. A
marker will automatically be activated at the highest peak.
100
Chapter 4
Making Measurements
Spectrum (Frequency Domain) Measurements
Spectrum (Frequency Domain) Measurements
This section explains how to make a frequency domain measurement on
a cellular base station. An adjacent or an interfering signal can also be
applied, if desired, during spectrum measurements.
Configuring the Measurement System
Figure 4-1
Spectrum Measurement System
1. Using the appropriate cables, adapters, and circulator, connect the
output signal of the BTS to the RF input of the instrument.
2. Connect the base transmission station simulator or signal generator
to the BTS through a circulator to initiate a link constructed with
sync and pilot channels, if required.
3. Connect a BNC cable between the 10 MHz OUT port of the signal
generator and the EXT REF IN port of the instrument.
4. Connect the system controller to the BTS through the serial bus
cable to control the BTS operation.
Setting the BTS
From the base transmission station simulator and the system
controller, set up a call using loopback mode to allow the BTS to
transmit RF signal.
Chapter 4
101
Making Measurements
This example shows a base station (BTS) under test set up to transmit
RF power, and being controlled remotely by a system controller. The
transmitting signal is connected to the analyzer RF input port. Connect
the equipment as shown.
Making Measurements
Spectrum (Frequency Domain) Measurements
Measurement Procedure
Step 1. Press the Preset key to preset the instrument.
Step 2. Press the MODE, Basic keys to enable the Basic Mode measurements.
Step 3. To set the measurement center frequency press the FREQUENCY
Channel key, enter a numerical frequency using the front-panel keypad,
and complete the entry by selecting a units key, like MHz.
Making Measurements
Step 4. Press the SPAN key, enter a numerical span using the front-panel
keypad, and press the MHz key to set the measurement span in MHz.
Step 5. Press the MEASURE to initiate the spectrum measurement, which is the
default measurement for Basic.
NOTE
A display with both a Spectrum window and an I/Q Waveform window
will appear when you activate a Spectrum measurement. The active
window is outlined in green. Changes to FREQUENCY, Span, or
Amplitude settings will affect only the active window. Use the Next
Window key to select a different window, and the Zoom key to enlarge a
window.
The default display shows both Current (yellow trace) and Average (blue
trace) data. To make viewing the display easier, you can view either the
Current trace or Average separately.
• Press Trace/View, Trace Display, and select the trace(s) desired for
display.
102
Chapter 4
Making Measurements
Spectrum (Frequency Domain) Measurements
Figure 4-2
Spectrum Measurement - Spectrum and I/Q Waveform (Default
View)
Making Measurements
The spectrum measurement result should look like the above figure.
The measurement result values are shown in the summary result
window.
Step 6. Press the View/Trace key to display a menu allowing selection of another
measurement result display including the following:
• Spectrum - Provides a combination view of the spectrum graph in
parameters of power versus frequency with semi-log graticules, and
the I/Q waveform graph in parameters of voltage and time. Changes
to frequency span or power will sometimes affect data acquisition.
This is equivalent to changing the selected window with the Next
key.
• Spectrum (Time Domain) I/Q Waveform - (Key for PSA only) This graph is
shown below the Spectrum graph in the default dual-window display.
I/Q Waveform provides a view of the I/Q waveform in parameters of
voltage versus time in linear scale. Changes to sweep time or
resolution bandwidth can affect data acquisition.
Chapter 4
103
Making Measurements
Spectrum (Frequency Domain) Measurements
Spectrum (Time Domain) Measurement - I/Q Waveform Result
Making Measurements
Figure 4-3
104
Chapter 4
Making Measurements
Spectrum (Frequency Domain) Measurements
• Spectrum Linear - (for E4406A) Provides a view of the spectrum graph
in parameters of voltage versus frequency in linear scale. Changes to
frequency span or voltage can affect data acquisition.
Figure 4-4
Spectrum Measurement - Linear Spectrum View (for E4406A)
Making Measurements
*Meas Setup:
View/Trace = Spectrum Linear,
Span = 3.000 MHz,
Y Scale/Div = 5.00 mV, Ref Value = 30.0 mV,
Others = Factory default settings
*Input signals: −10.00 dBm, 9 channels of SR1, cdma2000 Rev 8
NOTE
(for E4406A) For the widest spans, the I/Q window becomes just “ADC
time domain samples”, because the I/Q down-conversion is no longer in
effect. This is not the case for E4406A Option B7C if the Input Port is set
to either I/Q, I only, or Q only and you have connected baseband I/Q
signals to the I/Q INPUT connectors.
• I and Q Waveform - (for E4406A) Provides individual views of the I
and Q signal waveform windows in parameters of voltage versus
time.
To select the I or Q trace view, press the Next key at the bottom of the
display. The selected window will have a green outline. To view the
window full size press the Zoom key.
Chapter 4
105
Making Measurements
Spectrum (Frequency Domain) Measurements
Spectrum Measurement - I and Q Waveform View (for E4406A)
Making Measurements
Figure 4-5
Figure 4-6
Spectrum Measurement - I and Q Waveform View (for E4406A)
*Meas Setup:
View/Trace = I and Q Waveform,
Others = Factory default settings
*Input signals: −10.00 dBm, PCCPCH + SCH
106
Chapter 4
Making Measurements
Spectrum (Frequency Domain) Measurements
Figure 4-7
Spectrum Measurement - I and Q Waveform View (for E4406A)
Making Measurements
*Meas Setup:
View/Trace = I and Q Waveform,
AMPLITUDE Y Scale = 5.00 mV,
Others = Factory default settings
*Input signals: −10.00 dBm, 9 channels of SR1, cdma2000 Rev 8
Figure 4-8
Spectrum Measurement - I and Q Waveform View (for E4406A)
*Meas Setup:
Chapter 4
View/Trace = I and Q Waveform,
Others = Factory default settings
107
Making Measurements
Spectrum (Frequency Domain) Measurements
*Input signals: −10.00 dBm, Pilot channel, 1xEV-DO
Spectrum Measurement - I and Q Waveform View (for E4406A)
Making Measurements
Figure 4-9
*Meas Setup:
View/Trace = I and Q Waveform
Span = 500.000 kHz,
Y Scale/Div = 5.0 mV, Ref Value = 0.0 V,
Others = Factory default settings
*Input signals: −20.00 dBm, EDGE pattern data (PN9)
• I/Q Polar - (for E4406A) Provides a view of the I/Q signal displayed in
a polar vector graph.
108
Chapter 4
Making Measurements
Spectrum (Frequency Domain) Measurements
Spectrum Measurement - I/Q Polar View (for E4406A)
Figure 4-11
Spectrum Measurement - I/Q Polar View (for E4406A)
Making Measurements
Figure 4-10
*Meas Setup:
View/Trace = I/Q Polar,
Others = Factory default settings
*Input signals: −10.00 dBm, PCCPCH + SCH
Chapter 4
109
Making Measurements
Spectrum (Frequency Domain) Measurements
Spectrum Measurement - I/Q Polar View (for E4406A)
Making Measurements
Figure 4-12
*Meas Setup:
View/Trace = I/Q Polar,
Others = Factory default settings
*Input signals: −10.00 dBm, Pilot channel of SR1, cdma2000 Rev 8
Figure 4-13
Spectrum Measurement - I/Q Polar View (for E4406A)
*Meas Setup:
110
View/Trace = I/Q Polar,
Others = Factory default settings
Chapter 4
Making Measurements
Spectrum (Frequency Domain) Measurements
*Input signals: −10.00 dBm, Pilot channel, 1xEV-DO
Figure 4-14
Spectrum Measurement - I/Q Polar View (for E4406A)
Making Measurements
*Meas Setup:
View/Trace = I/Q Polar
Span = 500.000 kHz,
Y Scale/Div = 5.0 mV, Ref Value = 0.0 V,
Others = Factory default settings
*Input signals: −20.00 dBm, EDGE pattern data (PN9)
Step 7. To make a measurement repeatedly, press Meas Control, Measure to
toggle the setting from Single to Cont.
Step 8. Press the Meas Setup, More (1 of 2) keys to check the keys available to
change the measurement parameters from the default condition
For more details about changing measurement parameters, see
“Spectrum (Frequency Domain) Measurement Concepts” on page 222
Chapter 4
111
Making Measurements
Waveform (Time Domain) Measurements
Waveform (Time Domain) Measurements
This section explains how to make waveform (time domain)
measurement on a cellular base station. Measurement of I and Q
modulated waveforms in the time domain disclose the voltages which
comprise the complex modulated waveform of a digital signal.
Making Measurements
Configuring the Measurement System
The base station (BTS) under test has to be set to transmit the RF
power remotely through the system controller. This transmitting signal
is connected to the instruments RF input port. Connect the equipment
as shown. An interfering or adjacent signal may supplied as shown.
Figure 4-15
Waveform Measurement System
1. Using the appropriate cables, adapters, and circulator, connect the
output signal of the BTS to the RF input of the instrument.
2. Connect the base transmission station simulator or signal generator
to the BTS through a circulator to initiate a link constructed with
sync and pilot channels, if required.
3. Connect a BNC cable between the 10 MHz OUT port of the signal
generator and the EXT REF IN port of the instrument.
4. Connect the system controller to the BTS through the serial bus
cable to control the BTS operation.
5. Connect an external trigger, if needed. Press Mode Setup, Trigger to
access a menu to set up inputs and levels for all triggers. You must
then select the appropriate trigger under the Meas Setup, Trigger
menu to direct the measurement to use your trigger settings.
112
Chapter 4
Making Measurements
Waveform (Time Domain) Measurements
Setting the BTS
From the base transmission station simulator and the system
controller, set up a call using loopback mode for the BTS to transmit the
RF signal.
Measurement Procedure
Step 1. Press the Preset key to preset the instrument.
Step 2. Press the MODE, Basic keys to enable the Basic Mode measurements.
Step 4. Press the SPAN key, enter a numerical span using the front-panel
keypad, and press the MHz key to set the measurement span in MHz.
Step 5. Press the MEASURE to initiate the Waveform measurement.
The default display shows both Current (yellow trace) and Average (blue
trace) data. To make viewing the display easier, you can view either the
Current trace or Average separately.
• Press Trace/View, Trace Display, and select the trace(s) desired for
display.
Step 6. Press SPAN X Scale, and the up or down arrow keys until the waveform
is shown at a convenient time scale for viewing.
The next figure shows an example of an RF Envelope (key is called
Signal Envelope on VSA) result for a waveform (time domain)
measurement. The measured values for the mean power and
peak-to-mean power are shown in the text window.
Chapter 4
113
Making Measurements
Step 3. To set the measurement center frequency press the FREQUENCY
Channel key, enter a numerical frequency using the front-panel keypad,
and complete the entry by selecting a units key, like MHz.
Making Measurements
Waveform (Time Domain) Measurements
Waveform Measurement - RF Envelope (Default View)
Making Measurements
Figure 4-16
*Meas Setup:
Trace/View = RF Envelope,
Others = Factory default settings
*Input signal: cdma2000 Rev 8, SR1, 9 Channel
114
Chapter 4
Making Measurements
Waveform (Time Domain) Measurements
Step 7. Press the Trace/View (for PSA) or View/Trace (for E4406A) key to display
the menu allowing selection of the other Waveform views, including the
following:
• Linear Envelope - (for E4406A Option B7C) Provides a combination
view of a linear signal envelope graph and a phase graph with linear
graticules. Use the Next Window and Zoom keys to select and enlarge
either graph.
Figure 4-17
Waveform Measurement - Linear Envelope View
Making Measurements
*Meas Setup:
Chapter 4
View/Trace = Linear Envelope View, GSM signal
Others = Factory defaults, except X and Y scales
115
Making Measurements
Waveform (Time Domain) Measurements
Waveform Measurement - Linear Envelope View
Making Measurements
Figure 4-18
*Meas Setup:
View/Trace = Linear Envelope View,
Others = Factory defaults, except X and Y scales
*Input signal: cdma2000 Rev 8, SR1, 9 Channel
Figure 4-19
Waveform Measurement - Linear Envelope View
*Meas Setup:
View/Trace = Linear Envelope View,
Others = Factory defaults, except X and Y scales
*Input signal: W-CDMA (3GPP 3.4 12-00), 1 DPCH,
116
Chapter 4
Making Measurements
Waveform (Time Domain) Measurements
Figure 4-20
Waveform Measurement - Linear Envelope View
Making Measurements
*Meas Setup:
View/Trace = Linear Envelope View,
Others = Factory defaults, except X and Y scales
*Input signal: EDGE Standard pattern (4-1s and 4-0s)
Chapter 4
117
Making Measurements
Waveform (Time Domain) Measurements
• I/Q Waveform - Provides a view of the I and Q waveforms together on
the same graph in parameters of voltage versus time in linear scale.
Changes to sweep time or resolution bandwidth can affect data
acquisition.
Waveform Measurement - I/Q Waveform View
NOTE
For the widest spans, the I/Q Waveform window becomes just “ADC
time domain samples”, because the I/Q down-conversion is no longer in
effect.
NOTE
For the widest spans the I/Q Waveform window becomes just “ADC
time domain samples”, because the I/Q down-conversion is no longer in
effect.
Making Measurements
Figure 4-21
118
Chapter 4
Making Measurements
Waveform (Time Domain) Measurements
• I and Q Waveform - (for E4406A Option B7C) Provides a combination
view of the I and Q signal waveform graphs in the linear scales.
Waveform Measurement - I and Q Waveform View
Figure 4-23
Waveform Measurement - I and Q Waveform View
Making Measurements
Figure 4-22
Chapter 4
119
Making Measurements
Waveform (Time Domain) Measurements
Waveform Measurement - I and Q Waveform View
Making Measurements
Figure 4-24
*Meas Setup:
View/Trace = I and Q Waveform View,
Others = Factory defaults, except X and Y scales
*Input signal: cdma2000 Rev 8, SR1, 9 Channel
Figure 4-25
Waveform Measurement - I and Q Waveform View
*Meas Setup:
120
View/Trace = I and Q Waveform View,
Others = Factory defaults, except X and Y scales
Chapter 4
Making Measurements
Waveform (Time Domain) Measurements
*Input signal: W-CDMA (3GPP 3.4 12-00), 1 DPCH,
• I/Q Polar - (for E4406A) Provides a view of the I/Q signal in a polar
vector graph.
Waveform Measurement - I/Q Polar View
Figure 4-27
Waveform Measurement - I/Q Polar View
Making Measurements
Figure 4-26
Chapter 4
121
Making Measurements
Waveform (Time Domain) Measurements
Waveform Measurement - I/Q Polar View
Making Measurements
Figure 4-28
*Meas Setup:
View/Trace = I/Q Polar View,
Others = Factory defaults, except X and Y scales
*Input signal: cdma2000 Rev 8, SR1, 9 Channel
Figure 4-29
Waveform Measurement - I/Q Polar View
*Meas Setup:
View/Trace = I/Q Polar View,
Others = Factory defaults, except X and Y scales
*Input signal: W-CDMA (3GPP 3.4 12-00), 1 DPCH,
122
Chapter 4
Making Measurements
Waveform (Time Domain) Measurements
Figure 4-30
Waveform Measurement - I/Q Polar View
Making Measurements
*Meas Setup:
View/Trace = I/Q Polar,
Trigger Source = Ext Rear,
Others = Factory default settings
*Input signal: −10 dBm, Idle slot, 1xEV-DO
Step 8. Press the AMPLITUDE Y Scale, and down arrow keys until the
waveforms are shown at a convenient voltage scale for viewing.
Step 9. Press the SPAN X Scale, and down arrow keys until the waveforms are
shown at a convenient time scale for viewing.
Step 10. Press the Marker, Trace, and I/Q Waveform keys to activate a marker.
Rotate the RPG knob until the marker is shown at a desired time in the
waveform for viewing the trace values at the time position of the
marker.
Step 11. To make a measurement repeatedly, press Meas Control, Measure to
toggle the setting from Single to Cont.
Step 12. Press the Meas Setup, More (1 of 2) keys to check the keys available to
change the measurement parameters from the default condition.
Using the Waveform Measurement to Set Up Triggering (for
burst signals)
You can use the waveform measurement to view your signal in the time
domain and to help select the appropriate trigger to acquire your signal.
Step 1. Activate the waveform measurement view:
Chapter 4
123
Making Measurements
Waveform (Time Domain) Measurements
Press MEASURE, Waveform (Time Domain).
Step 2. Adjust the scale of the x-axis to view the complete signal waveform:
Press SPAN X Scale, Scale/Div, then use the front-panel keypad to input
the scale/div, then press a units key, like µs, to complete the entry.
Step 3. Select a trigger source (free run is the default setting):
Press Meas Setup, Trig Source, then select one of the available trigger
sources.
Making Measurements
Step 4. Setup the trigger conditions:
Press Trig or for E4406A press Mode Setup, Trigger Setup, then choose a
trigger mode.
In the trigger mode set the delay, peak level and positive or negative
edge slope trigger. You can also setup trigger holdoff, auto trigger
timing and frame timer settings.
For more details about using PSA Option 122, 80 MHz BW Digitizing
Hardware, and PSA Option 140, 40 MHz Digitizing Hardware,
including detailed function descriptions, SCPI commands and concepts,
see the PSA Basic Mode Guide.
For more details about changing measurement parameters, see
“Waveform (Time Domain) Measurement Concepts” on page 223
124
Chapter 4
Making Measurements
Adjacent Channel Power (ACP) Measurements
Adjacent Channel Power (ACP) Measurements
This section explains how to make an adjacent channel power (ACP)
measurement on a cellular mobile station. ACP is a measurement of the
amount of interference, or power, in an adjacent frequency channel. The
results are displayed as a bar graph or as spectrum data, along with
measurement data at specified offset.
Configuring the Measurement System
Figure 4-31
Adjacent Channel Power Ratio Measurement System
1. Using the appropriate cables, adapters, and circulator, connect the
output signal from the MS to the RF input port of the instrument.
2. Connect the base transmission station simulator or signal generator
to the MS through a circulator to initiate a link constructed with the
sync and pilot channels, if required.
3. Connect a BNC cable between the 10 MHz OUT port of the signal
generator and the EXT REF IN port of the instrument.
4. Connect the system controller to the MS through the serial bus cable
to control the MS operation.
Setting the MS
From the base transmission station simulator and the system
Chapter 4
125
Making Measurements
The mobile station (MS) under test has to be set to transmit the RF
power remotely through the system controller. This transmitting signal
is connected to the instruments RF input port. Connect the equipment
as shown.
Making Measurements
Adjacent Channel Power (ACP) Measurements
controller, set up a call using loopback mode to transmit the RF power.
Measurement Procedure
Step 1. Press the Preset key to preset the instrument. The settings will default
to IS-95 standards.
Step 2. Press the MODE, Basic keys to enable the Basic Mode measurements.
Making Measurements
Step 3. Press the Mode Setup, Radio, Device keys and toggle to select MS or BTS.
Step 4. To use settings different than for an IS-95 signal, press the Meas Setup,
Offsets and Limits keys and select settings for your signal of interest. For
more information see “Adjacent Channel Power (ACP) Keys” on page
168.
Step 5. To set the measurement center frequency press the FREQUENCY
Channel key, enter a numerical frequency using the front-panel keypad,
and complete the entry by selecting a units key, like MHz. Depending on
the measurement selected, you may have other keys available to select
a channel or slot. For more information see “FREQUENCY Channel
Key Menu”.
Step 6. Press the MEASURE, ACP keys to initiate the adjacent channel leakage
power ratio measurement.
The following figure shows an example result of ACP (Total Pwr Ref)
measurements in the bar graph window. The absolute and relative
power levels on both sides of the carrier frequency are displayed in the
graphic window and text window.
126
Chapter 4
Making Measurements
Adjacent Channel Power (ACP) Measurements
Figure 4-32
Basic ACP Measurement - Bar Graph (Default) View
Making Measurements
The ACP Bar Graph measurement result should look like the above
figure. The bar graph (referenced to the total power) and a text window
are displayed. The text window shows the absolute total power
reference, while the lower and upper offset channel power levels are
displayed in both absolute and relative readings. In this example the
test failed because of excessive power in the lower region.
In the factory default condition, 5 of the total integration power levels,
centered at the carrier frequency and ±765.0 kHz and ±1.995 MHz
offset frequencies, are shown in the default result display. The
corresponding measured data is shown in the text window. Depending
on the Meas Type selection, one of the two following displays is obtained:
Bar Graph (Total Pwr Ref) - A histogram of powers referenced to
the total power
Bar Graph (PSD Ref) - A histogram of powers referenced to the
mean power spectral density of the carrier in dBm/Hz
Chapter 4
127
Making Measurements
Adjacent Channel Power (ACP) Measurements
Step 7. Press the View/Trace, Spectrum keys to see the ACP Spectrum graph
view with the bandwidth marker lines in the graph window. In the
factory default condition, the frequency spectrum with the FFT sweep
type is displayed with the bandwidth marker lines in the graph window.
The corresponding measured data in the text window is the total
integration power levels, in dBc and dBm, within the defined
bandwidth as shown in the figure below.
ACP Measurement - Spectrum View
Making Measurements
Figure 4-33
Step 8. If desired, select a Meas Type setting. Depending on the Meas Type
setting, one of the two following displays is obtained:
Spectrum (Total Pwr Ref) - A spectrum display referenced to the
total power
Spectrum (PSD Ref) - A spectrum display referenced to the mean
power spectral density of the carrier in dBm/Hz
You can improve the update speed of the displayed data values by
turning off the spectrum trace in Meas Setup.
If Sweep Type is set to Swp, the swept frequency ACPR is displayed as
shown below and only Spectrum is available for View/Trace.
While in this view, you can change the vertical scale by pressing the
AMPLITUDE Y Scale key.
Troubleshooting Hints
The adjacent channel power ratio measurement can reveal degraded or
128
Chapter 4
Making Measurements
Adjacent Channel Power (ACP) Measurements
defective parts in the transmitter section of the UUT. The following
examples are some areas which can contribute to poor ACPR:
• DC power supply control of the transmitter power amplifier, RF
power control of the pre-power amplifier stage, and/or I/Q control of
the baseband stage.
• Gain and output power levels of the power amplifier, caused by
degraded gain control and/or increased distortion.
• Amplifier linearity.
NOTE
If an external attenuator is used, be sure to use the Ext RF Atten key to
include the attenuation value in the displayed measurement result.
For more information on ACP measurements see “Adjacent Channel
Power (ACP) Measurement Concepts” on page 218.
Chapter 4
129
Making Measurements
Power amplifiers are one of the final stage elements of a base or mobile
transmitter and are a critical part of meeting the important power and
spectral efficiency specifications. Since ACPR measures the spectral
response of the amplifier to a complex wideband signal, it is a key
measurement linking amplifier linearity and other performance
characteristics to the stringent system specifications.
Making Measurements
Channel Power Measurements
Channel Power Measurements
This section explains how to make a cellular measurement on a cellular
mobile station. This test measures the total RF power present in the
channel. The results are displayed graphically as well as in total power
(dB) and power spectral density (dBm/Hz).
Making Measurements
Configuring the Measurement System
The mobile station (MS) under test has to be set to transmit the RF
power remotely through the system controller. This transmitting signal
is connected to the instruments RF input port. Connect the equipment
as shown.
Figure 4-34
Channel Power Measurement System
1. Using the appropriate cables, adapters, and circulator, connect the
output signal from the MS to the RF input port of the instrument.
2. Connect the base transmission station simulator or signal generator
to the MS through a circulator to initiate a link constructed with the
sync and pilot channels, if required.
3. Connect a BNC cable between the 10 MHz OUT port of the signal
generator and the EXT REF IN port of the instrument.
4. Connect the system controller to the MS through the serial bus cable
to control the MS operation.
130
Chapter 4
Making Measurements
Channel Power Measurements
Setting Up the MS
From the base transmission station simulator and the system
controller, set up a call using loopback mode for the MS to transmit RF
power.
Measurement Procedure
Step 1. Press the Preset key to preset the instrument.
Step 2. Press the System, Reference, Freq Ref keys to toggle the frequency
reference to EXT, if required. In the annunciator bar you will see EXT
REF displayed in green.
Step 4. Press the Mode Setup, Radio, Device keys and toggle to select MS or BTS.
Step 5. Press the MEASURE, Channel Power keys to initiate the channel power
measurement.
Step 6. Press the FREQUENCY Channel key to set the measurement center
frequency. This frequency should be at the exact center of the band for
which you want to measure the channel power.
Step 7. Press the Meas Setup, Chan Power Span keys to set the display span for
the channel power measurement. (This does not set the integration
bandwidth. See Integ BW in Step 8 below.) Enter a number by using the
front panel keypad, and selecting a unit of frequency like 1855, MHz, or
by rotating the RPG knob. This setting should be the exact desired span
of the channel for which you have set the center frequency in Step 5
above. See “Channel Power Keys” on page 176 for more information.
Step 8. Set the power measurement integration bandwidth for the channel
power measurement. Press the Integ BW key, and enter a number by
using the front panel keypad, and selecting a unit of frequency like
1855, MHz, or by rotating the RPG knob. The adjustment of this value is
coupled to the measurement span setting. The setting can be any
integer frequency between 10% and 61.5% of the span of the channel
which you set in Step 6 above. If desired, once the bandwidth setting is
accomplished, the channel power span may be reset to a value greater
than that allowed by the Span coupling function. The fastest
measurement speed is obtained by using a channel power span that is
only slightly greater than the integration bandwidths. Using Channel
Power Spans that are much greater than the integration bandwidths
slow the measurement and may degrade accuracy.
For more information see “Channel Power Measurement Concepts” on
page 219
Chapter 4
131
Making Measurements
Step 3. Press the MODE, More (1 of 2), Basic keys to enable Basic Mode
measurements.
Making Measurements
Channel Power Measurements
Channel Power Measurement Result
Making Measurements
Figure 4-35
Your result should look like the screen above. The total RF power in the
measurement channel span is shown at the left of the lower text
window. The vertical white lines indicate the integration bandwidth
setting.
Step 9. Press the Meas Setup, More (1 of 2) keys to check the keys available to
change the measurement parameters from the default condition.
Troubleshooting Hints
If an external attenuator is used, be sure to use the Ext RF Atten key to
include the attenuation value in the displayed measurement result.
The channel power measurement can reveal the effects of degraded or
defective parts in the transmitter section of the UUT. The following are
areas of concern which can contribute to performance degradation:
• DC power supply control of the transmitter power amplifier, RF
power control of the pre-power amplifier stage, and/or I/Q control of
the baseband stage.
• Gain and output power levels of the power amplifier, caused by
degraded gain control and/or increased distortion.
• Amplifier linearity.
132
Chapter 4
Making Measurements
Making Power Stat CCDF Measurements
Making Power Stat CCDF Measurements
This section explains how to make a power statistics CCDF
measurement on a cellular mobile station. Power Complementary
Cumulative Distribution Function (CCDF) curves characterize the
higher level power statistics of a digitally modulated signal.
Configuring the Measurement System
Figure 4-36
Power Statistics (CCDF) Measurement System
1. Using the appropriate cables, adapters, and circulator, connect the
output signal of the MS to the RF input of the instrument.
2. Connect the base transmission station simulator or signal generator
to the MS through a circulator to initiate a link constructed with
sync and pilot channels, if required.
3. Connect a BNC cable between the 10 MHz OUT port of the signal
generator and the EXT REF IN port of the instrument.
4. Connect the system controller to the MS through the serial bus cable
to control the MS operation.
Chapter 4
133
Making Measurements
The mobile station (MS) under test has to be set to transmit the RF
power remotely through the system controller. This transmitting signal
is connected to the instruments RF input port. Connect the equipment
as shown.
Making Measurements
Making Power Stat CCDF Measurements
Setting the MS
From the base transmission station simulator and the system
controller, set up a call using Rate Set 1 Fundamental Code Channel
loopback mode (Service Option 2) with 9600 bps data rate only required
for the MS to transmit the RF power as follows:
MS:
Band Class 1, Block Designator A, Class III
Frequency:
1855.000 MHz (preferred set channel number 100)
(= 100 × 0.050 + 1850.000 MHz)
Making Measurements
Output Power: −3 dBW (0.5 W) controlled by ‘0’ power control bits
134
Chapter 4
Making Measurements
Making Power Stat CCDF Measurements
Measurement Procedure
Step 1. Press the Preset key to preset the instrument.
Step 2. Press the MODE, Basic keys to enable the Basic Mode measurements.
Step 3. Press the Mode Setup, Radio, Device to toggle the device to MS.
Step 4. Press the FREQUENCY Channel, 1855, MHz keys to set the center
frequency to 1,855.000 MHz.
Step 5. Press the MEASURE, More (1 of 2), Power Stat CCDF keys to initiate the
power statistics CCDF measurement.
Power Statistics CCDF Measurement Results
Making Measurements
Figure 4-37
The CCDF measurement result should look like the above figure. The
measurement result values are shown in the summary result window.
Step 6. To make a measurement repeatedly, press Meas Control, Measure to
toggle the setting from Single to Cont.
Step 7. Press the Meas Setup, More (1 of 2) keys to check the keys available to
change the measurement parameters from the default condition.
Chapter 4
135
Making Measurements
Using Option B7C Baseband I/Q Inputs
Using Option B7C Baseband I/Q Inputs
Baseband I/Q Measurements Available for E4406A
VSA Series Transmitter Tester
The following measurements can be made using Baseband I/Q inputs:
• Channel Power
Making Measurements
• Power Stat CCDF
• Spectrum (Frequency Domain)
• Waveform (Time Domain)
NOTE
The following measurements can not be made using Baseband I/Q
Inputs:
• ACP
Baseband I/Q Measurement Overview
Baseband I/Q measurements are similar to RF measurements. To avoid
duplication, this section describes only the details unique to using the
baseband I/Q inputs. For generic measurement details, refer to the
previous “Making Measurements” sections.
To make measurements using baseband I/Q Inputs, make the following
selections:
• Select a measurement that supports baseband I/Q inputs. For
details see “Baseband I/Q Measurements Available for E4406A VSA
Series Transmitter Tester” on page 136.
• Select the appropriate circuit location and probe(s) for
measurements. For details see “Selecting Input Probes for Baseband
Measurements” on page 225.
• Select baseband I/Q input connectors. For details see Input Port Key
Menu in the Key Reference chapter.
• Select just I/Q Setup if desired. For details see IQ Setup Key Menu
in the Key Reference chapter.
• Select baseband I/Q input impedance. For details see I/Q Input Z
Key Menu in the Key Reference chapter.
• Select a baseband I/Q measurement results view. For details see
“Baseband I/Q Measurement Result Examples” on page 137.
136
Chapter 4
Making Measurements
Using Option B7C Baseband I/Q Inputs
Baseband I/Q Measurement Result Examples
The following are examples of new measurement result displays using
baseband I/Q Inputs. A notation below each example indicates the
nature of the input signal.
Channel Power Measurement
There is a new view for Channel Power measurements with baseband
I/Q Inputs: the Channel Power Spectrum view with 0 Hz center
frequency.
Figure 4-38
Channel Power - Baseband I/Q Inputs
cdma2000 (Rev. 8) Downlink, SR1 9 Channel, Baseband I/Q Inputs
Spectrum (Frequency Domain) Measurement
There are two new views with baseband I/Q input Spectrum
measurements: the Spectrum view with 0 Hz center frequency, and the
Spectrum Linear view with 0 Hz center frequency and the vertical scale
in volts.
If you have I only or Q only selected as the Input Port, a Spectrum view
does not have 0 Hz as the center frequency. It is displayed with 0 Hz at
the left margin, similar to a conventional spectrum display, except that
the start frequency remains 0 Hz regardless of Span, and the center
frequency is displayed as half the Span.
Chapter 4
137
Making Measurements
This measurement is not available if Input Port menu is set to I only or
Q only, as the total I/Q channel power cannot be measured.
Making Measurements
Using Option B7C Baseband I/Q Inputs
Spectrum View- Baseband I/Q Inputs
Making Measurements
Figure 4-39
W-CDMA (3GPP 3.4 12-00) Downlink, 1 DCPH, Baseband I/Q Inputs
Figure 4-40
Spectrum Linear View- Baseband I/Q Inputs
W-CDMA (3GPP 3.4 12-00) Downlink, 1 DCPH, Baseband I/Q Inputs
138
Chapter 4
Making Measurements
Using Option B7C Baseband I/Q Inputs
Figure 4-41
Basic Mode Spectrum I only View- Baseband I/Q Inputs
Making Measurements
W-CDMA (3GPP 3.4 12-00) Downlink, 1 DCPH, Baseband I/Q Inputs
Waveform (Time Domain) Measurement
There are two new views with baseband I/Q input Waveform (Time
Domain) measurements: the Linear Envelope view with the vertical
scale in volts, and the I and Q Waveform view with separate windows
for the I and Q traces.
Chapter 4
139
Making Measurements
Using Option B7C Baseband I/Q Inputs
Waveform Linear Envelope - Baseband I/Q Inputs
Making Measurements
Figure 4-42
W-CDMA (3GPP 3.4 12-00) Downlink, 1 DCPH, Baseband I/Q Inputs
Figure 4-43
I and Q Waveform View - Baseband I/Q Inputs
W-CDMA (3GPP 3.4 12-00) Downlink, 1 DCPH, Baseband I/Q Inputs
140
Chapter 4
Making Measurements
Service Measurements
Service Measurements
Service measurements help you check the functionality of your
instrument. They include a power vs. time measurement which is
intended strictly for diagnostic uses.
The spectrum and waveform measurements that can be accessed
through the service menu are explained in the section on basic
measurements. Refer to “Spectrum (Frequency Domain)
Measurements” on page 101 and “Waveform (Time Domain)
Measurements” on page 112.
Pwr vs Time on page 142
Timebase Frequency on page 146
50 MHz Amptd on page 148
Sensors on page 150
Spectrum on page 101
Waveform on page 112
Front Panel Test on page 152
Chapter 4
141
Making Measurements
To access the Service mode press the Mode key and select the Service
menu key. The following service measurements are available:
Making Measurements
Making the Power vs. Time Measurement
Making the Power vs. Time Measurement
Purpose
This measurement is provided for instrument internal testing and self
diagnostics.
Making Measurements
Power vs. Time measures the mean transmit power during the “useful
part” of GSM bursts and verifies that the power ramp fits the within
the defined mask. Power vs. Time also lets you view the rise, fall, and
“useful part” of the GSM burst.
Measurement Method
The instrument acquires a GSM signal in the time domain. The “T0”
point and the useful part are computed. If Burst Sync is set to Training
Seq, a GSM demodulation is performed to find “T0”. If Burst Sync is set
to RF Amptd, an approximation of “T0” will be used without performing
a demodulation. The average power in the useful part is then computed
and displayed, and the GSM limit mask is applied. The measurement
displays Pass when the burst fits within the bounds of the mask.
Making the Measurement
NOTE
The factory default settings provide a good starting point. For special
requirements, you may need to change some of the settings. Press Meas
Setup, More (1 of 2), Restore Meas Defaults at any time to return all
parameters for the current measurement to their default settings.
Select the desired center frequency.
Press Measure, Pwr vs Time to immediately make Power vs. Time the
active measurement.
To change any of the measurement parameters from the factory default
values, refer to the “Changing the Measurement Setup” section for this
measurement.
142
Chapter 4
Making Measurements
Making the Power vs. Time Measurement
Results
Power vs. Time Measurement Result - Burst View
Figure 4-45
Power vs. Time Measurement Result - Rise & Fall View
Making Measurements
Figure 4-44
Chapter 4
143
Making Measurements
Making the Power vs. Time Measurement
Changing the Measurement Setup
Making Measurements
Table 4-1
Power vs. Time Measurement Defaults
Measurement Parameter
Factory Default Condition
Avg Bursts
10 Off
Avg Mode
Exp
Avg Type
Pwr Avg (RMS)
Meas Time
1 Slot
Trig Source
RF Burst (Wideband)
Burst Sync
Training Seq
Advanced
NOTE
RBW Filter
Gaussian
Res BW
500.000 kHz
Parameters that are under the Advanced key seldom need to be
changed. Any changes from the default values may result in invalid
measurement data.
Make sure the Power vs. Time measurement is selected under the
Measure menu. The Meas Setup key will access a menu which allows you
to modify the averaging, trigger source, and burst sync for this
measurement (as described in the “Measurement Setup” section at the
beginning of this chapter). In addition, the following power vs. time
measurement parameters can be modified:
• Meas Time - allows you to measure more than one timeslot. Enter a
value in integer increments of “slots” with a range of 1 to 50. The
actual measure time in µs is set somewhat longer than the specified
number of slots in order to view the complete burst.
• Advanced - accesses a menu to change the following parameters:
RBW Filter - Choose the type of filter, either Gaussian or Flat
(Flatop). Gaussian is the best choice when looking at the overall
burst or the rising and falling edges, as it has excellent pulse
response. If you want to precisely examine just the useful part of
the burst, choose Flat.
Res BW - sets the resolution bandwidth.
144
Chapter 4
Making Measurements
Making the Power vs. Time Measurement
Changing the View
The View/Trace key will access a menu which allows you to select the
desired view of the measurement from the following selections:
• Burst - views the entire sweep as specified by the meas time. Figure
4-44 on page 143.
• Rise & Fall - zooms in on the rising and falling portions of the burst
being tested. Figure 4-45 on page 143.
NOTE
The limit test will still be performed on the entire burst, (viewed using
the Burst menu), when Rise & Fall is selected.
Making Measurements
Chapter 4
145
Making Measurements
Timebase Frequency
Timebase Frequency
Purpose
In the absence of a frequency counter, the measurement quickly
determines the frequency difference between the instrument’s 10 MHz
reference oscillator signal and an accurate, external 10 MHz frequency
standard.
Making Measurements
NOTE
The timebase frequency check is not as accurate as a measurement of
the 10 MHz Out signal (rear panel) using a frequency counter
referenced to a frequency standard.
Measurement Method
The internal 10 MHz reference signal is compared with a reliable
external 10 MHz signal which the user inputs into the front panel RF
connector. The transmitter tester subtracts its 10 MHz reference from
the input signal and displays the frequency difference.
Test Setup
An accurate external 10 MHz frequency signal, such as a house
standard, is connected to an attenuator, which attenuates the signal to
0 dB. The attenuated 10 MHz signal is connected to the RF input of the
transmitter tester. Pressing Mode, Service, Measure, Timebase
Frequency will result in the display of data described below.
NOTE
When setting up this test ensure that the reference is set to internal. To
check this press System, Reference. The Freq Ref menu key allows you to
toggle between Int (internal) and Ext (external). Make sure Int is
underlined.
146
Chapter 4
Making Measurements
Timebase Frequency
Results
Window One (Time Record)
Shows an I/Q display of the frequency difference between the input
signal and the internal 10 MHz signal.
Window Two (Magnitude)
Shows a polar representation of window one. This window shows how
much the phase error changes during the sampling period.
Window Three (Freq Error)
Window Four (numeric results)
Freq error: The error difference between the 10 MHz input signal and
the internal 10 MHz signal.
Magnitude: The magnitude of the external 10 MHz signal. While this
is an uncalibrated value, it gives the user an idea of the signal
amplitude.
Adjusting: A 0 will appear if the timebase adjustment is not being
performed. A 1 will appear if the adjustment is being performed.
Chapter 4
147
Making Measurements
Shows a stripchart of the timebase error in MHz vs. time. Each dot on
the horizontal axis is one sampling period.
Making Measurements
50 MHz Amplitude
50 MHz Amplitude
Purpose
To check the amplitude of the internal 50 MHz amplitude reference
signal.
Making Measurements
Measurement Method
The amplitude of an internal 50 MHz reference signal is compared with
the amplitude of a stable external 50 MHz signal which has been
measured with a power meter and then connected to the front panel RF
connector.
Test Setup
The 50 MHz amplitude feature enables you to measure the amplitude of
the internal 50 MHz reference signal. The amplitude of an internal 50
MHz reference signal is adjusted as close as possible to −25.00 dBm,
based on the relative measurement of the reliable external 50 MHz
signal, which is input by the user into the front panel RF connector.
Follow these steps to measure the amplitude of the 50 MHz amplitude
reference signal (a power meter and a reliable external source will be
needed to perform this test):
1. Set the external source to a frequency of 50 MHz at a power level of
−25 dBm (± 2 dBm).
2. Connect the external source to the power meter through a cable.
Adjust the power output of the source until the power meter reads
−25.00 dBm, or as close to −25.00 dBm, as possible.
3. Disconnect the power sensor and connect the source to the
transmitter tester.
4. Press Mode, Service, Measure, 50 MHz Amptd on the transmitter
tester. See next page for results.
148
Chapter 4
Making Measurements
50 MHz Amplitude
Results
Window One (RF Magnitude)
Shows the amplitude (unitless) of the external source as measured by
the transmitter tester.
Window Two (Cal Magnitude)
Shows the amplitude (unitless) of the 50 MHz input calibrator.
Window Three (Error)
Window Four (numeric results)
Cal Amplitude: The instrument’s internal ADC level when measuring
the internal 50 MHz calibrator amplitude.
RF Amplitude: The instrument’s internal ADC level when measuring
the external source amplitude
Error: The difference in ADC level between the 50 MHz internal
calibrator amplitude and the source amplitude.
Chapter 4
149
Making Measurements
Shows a stripchart of the amplitude error between the 50 MHz internal
calibrator and the external source amplitude.
Making Measurements
Sensors
Sensors
Purpose
The temperature of the RF board will vary over time and can adversely
affect the IF signal amplitude. Sensors on the RF board monitor
changes in temperature.
Making Measurements
Measurement Method
The sensor measurements are generated internally and do not require
any user interaction.
Test Setup
Press Mode, Service, Measure, Sensors.
Results
Window One (IF Signal Level)
Shows a stripchart of the IF signal amplitude in dBm.
Window Two (Cal Osc Level)
The Cal Oscillator window is not implemented.
Window Three (RF Temperature)
Shows a stripchart of the RF assembly temperature in Celsius.
Window Four (numeric results)
IF Signal Level: The ADC number for the detected 21.4 MHz IF
signal at the input to the AIF. Typical values with the input
attenuator set to 0 dB: 20 (no signal applied); 23(- 10 dBm); 27(- 5
dBm), and 38(0 dBm).
Cal Osc Level: Not implemented.
RF Temp: Shows current temperature in Celsius.
150
Chapter 4
Making Measurements
Sensors
Making Measurements
Chapter 4
151
Making Measurements
Front Panel Test
Front Panel Test
Purpose
The front panel test checks the functionality of the instrument front
panel keys and the RPG knob.
Making Measurements
Test Setup
Press Measure, More (1 of 2), Front Panel Test. Once the Front Panel
Test key is pressed you will see a display with three columns appear on
the screen. The entries on the left side of each column describe a key.
On the right side of each entry you will see a 0.
The front panel test requires you to press each of the front panel keys
(in any order, with the exception of the ESC key, which must be pressed
last), and to turn the RPG knob. The first time you press a key a 1 will
replace the 0 that originally appeared to the right of the key column.
Each additional instance of pressing a given key will result in an
increment to the number listed in the column to the right of the key
description. For example if you press the Zoom key four times, you will
see a 4 to the right of the Zoom entry.
Rotating the RPG knob will result in a rapidly incrementing, or
decrementing value appearing in the column to the right of the RPG
Knob entry. Rotate the RPG knob clockwise and counter-clockwise. You
will see negative or positive values appear, in ascending or descending
order, depending on the direction you have turned the RPG knob.
Note that the two step keys (the up and down arrow keys) are described
as the Rpg Dn and Rpg Up keys.
The ESC key must be pressed only after all other keys have been
pressed and the RPG knob has been rotated; pressing the ESC key will
cause the front panel test to be cancelled.
152
Chapter 4
Making Measurements
Front Panel Test
Results
The front panel test display shows a list of front panel keys and the
RPG knob, followed by a “times-pressed” indicator. You will see a count
of the number of times you have pressed a key next to that key on the
display, except for the knob, next to which you will see positive or
negative numbers in increments of 1.
Making Measurements
Troubleshooting Hints
If the front panel check fails contact the Agilent Technologies
instrument support center. See page 239.
Chapter 4
153
Making Measurements
Making Measurements
Front Panel Test
154
Chapter 4
Key Reference
5
Key Reference
This chapter provides detailed descriptions of the keys used to set up
and make Basic Mode measurements, including Mode Setup, Meas
Setup, and MEASURE. Keys that allow you to see different presentations
of the measurement results are also described, including Trace/View,
and Display, showing the associated screens.
155
Key Reference
Instrument Front Panel Highlights
Instrument Front Panel Highlights
The most commonly used function keys on the VSA and front panels are
located as shown in the illustrations below. The operation of the keys is
briefly explained on the following page. Refer to your User’s Guide for
complete details on all keys.
Selected E4406A VSA Series Front Panel Feature Locations
Key Reference
Figure 5-1
156
Chapter 5
Key Reference
Instrument Front Panel Highlights
Selected E4406A VSA Front-Panel Features
1. The On/Off switch toggles the AC Line power between On and
Standby. A green LED will light when the instrument is On. When
energized in the standby mode, a yellow LED is lit above the switch.
2. FREQUENCY Channel accesses a key menu to set the analyzer center
frequency in units of Hz, kHz, MHz, or GHz, or by channel number.
These parameters apply to all measurements in the current mode.
3. MODE accesses a key menu to select one of the measurement
personalities installed in the instrument. Each mode is independent
from all other modes.
4. Mode Setup accesses a key menu that sets parameters specific to the
current mode and can affect all measurements within that mode.
5. MEASURE accesses a display key menu to initiate one of the various
measurements that are specific to the current mode.
6. Meas Setup accesses the menus of test parameters that are specific to
the current measurement.
7. Restart causes a measurement to start again from the initial process
according to the current measurement setup parameters.
8. RF INPUT port: Type N connector for the E4406A. The maximum
input power level is shown next to the port.
10.The Display Menu keys allow you either to activate a feature or to
access a more detailed sub-menu. An arrow on the right side of a
menu key label indicates that the key has a further selection menu.
The active menu key is highlighted, however, grayed-out keys are
currently unavailable for use or only show information. If a menu
has multiple pages, successive pages are accessed by pressing the
More key located at the bottom of the menu.
11.Pressing the Return key allows you to exit the current menu and
display the previous menu. Often, pressing a menu key will invoke a
multi-page sub-menu. Pressing the Return key will show the menu
“above” it, not a previous page. When you activate another
measurement, the return list is cleared. The Return key will not
return you to a previously activated mode, nor will it alter any
values you have entered in previous menus.
12.Baseband I/Q Inputs (E4406A Option B7C only) Allow you to analyze
signals at baseband frequencies. See “Using Option B7C Baseband
I/Q Inputs” on page 136.
13.BNC Audio Input (PSA Option 233 Measuring Receiver only) Provides
Chapter 5
157
Key Reference
9. The Data Entry keypad is used to enter numeric values. Keypad
entries are displayed in the active function area of the screen and
become valid for the current measurement upon pressing the Enter
key or selecting a unit of measurement, depending on the parameter.
Key Reference
Instrument Front Panel Highlights
Key Reference
a 100 kohm input for audio measurements. Frequency range is
20 Hz to 250 kHz. Safe input level is 7 Vrms or 20 V DC.
158
Chapter 5
Key Reference
Front Panel Keys
Front Panel Keys
NOTE
Only front panel keys affected by selection of Basic mode are described
here. These key settings affect all of the measurements available under
the MEASURE key.
For information about the measurements and their setups, see the
individual measurement key descriptions in this chapter.
FREQUENCY Channel Key Menu
Key path: FREQUENCY Channel
NOTE
FREQUENCY Channel settings apply to all measurements in the mode.
• Center Freq - Selects a frequency that corresponds to the desired RF
channel to be measured. This is the current instrument center
frequency.
Span X Scale Key Menu
• Scale/Div - Only available in the Spectrum measurement with the IQ
Waveform display selected. It sets the horizontal scale by changing a
time value per division. The range is 1.00 ns to 1.00 s per division.
The default setting is 18.8 ms per division. However, since the Scale
Coupling default is On, this value is automatically determined by the
measurement results. When you set a value manually, Scale
Coupling automatically changes to Off.
• Ref Value - Only available in the Spectrum measurement with the IQ
Waveform display selected. It sets the reference value ranging from
−1.00 to 10.0 s. The default setting is 0.00 s. However, since the Scale
Coupling default is On, this value is automatically determined by the
measurement results. When you set a value manually, Scale
Coupling automatically changes to Off.
• Ref Position - Only available in the Spectrum measurement with the
IQ Waveform display selected. It sets the reference position to either
Left, Ctr (center) or Right. The default setting is Left.
• Scale Coupling - Only available in the Spectrum measurement with
the IQ Waveform display selected. It toggles the scale coupling
Chapter 5
159
Key Reference
• Span - Modifies the frequency span. The range is 10.000 Hz to 10.000
MHz with 1 Hz resolution, depending on the Res BW setting.
Changing the span causes the resolution bandwidth to change
automatically, and will affect data acquisition time. The Span key is
also accessible under the Meas Setup menu.
Key Reference
Front Panel Keys
function between On and Off. The default setting is On. Upon
pressing the Restart front-panel key or Restart menu key under the
Meas Control menu, this function automatically determines the scale
per division and reference values based on the measurement results.
When you set a value to either Scale/Div or Ref Value manually, Scale
Coupling automatically changes to Off.
AMPLITUDE Y Scale Key Menu
Key Path: AMPLITUDE Y Scale
The AMPLITUDE Y Scale key accesses the menu to set the desired
vertical scale and associated settings:
• Scale/Div - Allows you to enter a numeric value to change the vertical
display sensitivity. The range is 0.10 to 20.00 dB with 0.01 dB
resolution. The default setting is 10.00 dB. However, since the Scale
Coupling default is On, this value is automatically determined by the
measurement result. When you set a value manually, Scale Coupling
automatically changes to Off.
• Ref Value - Allows you to set the absolute power reference value
ranging from −250.00 to 250.00 dBm with 0.01 dB resolution. The
default setting is 10.00 dBm. However, since the Scale Coupling
default is On, this value is automatically determined by the
measurement result. When you set a value manually, Scale Coupling
automatically changes to Off.
Key Reference
• Ref Position - Allows you to set the display reference position to
either Top, Ctr (center), or Bot (bottom). The default setting is Top.
• Scale Coupling - Allows you to toggle the scale coupling function
between On and Off. The default setting is On. Upon pressing the
Restart front-panel key or Restart menu key under the Meas Control
menu, the scale coupling function automatically determines the
scale per division and reference values based on the measurement
results. When you set a value to either Scale/Div or Ref Value
manually, Scale Coupling automatically changes to Off.
MEASURE Key Menu
Key path: MEASURE
• Spectrum (Freq Domain) - Press this key to make frequency domain
spectrum measurements. The following windows are available:
— Spectrum graph with semi-log graticules and I/Q waveform graph
with linear graticules
• Waveform (Time Domain) - Press this key to make time domain
waveform measurements. The following windows are available:
— Signal Envelope graph with semi-log graticules and summary
160
Chapter 5
Key Reference
Front Panel Keys
data
— I/Q waveform graph and summary data
• CCDF - Press this key to make power statistics measurements. The
following windows are available:
— The tested CCDF curve shown on the right-hand side of the
display
— The average power and the power statistics data on the left-hand
side of the display
Meas Control Key Menu
Key path: Meas Control
• Restart - Press this key to repeat the current measurement from the
beginning, while retaining the current measurement settings. When
pressed, the scale coupling function is activated for an appropriate
display to the current input signal level. This is equivalent to the
Restart front panel key.
• Pause - Press this key to pause the current measurement until you
reactivate the measurement. Once toggled, the label of the Pause key
changes to read Resume. The Resume key, once pressed, continues
the active measurement from the point at which it was paused.
Chapter 5
161
Key Reference
• Measure - Press this key (not to be confused with the MEASURE front
panel key which has a different function) to toggle the measurement
state between Single and Cont (continuous). When set to Single, the
measurement will continue until it has reached the specified number
of averages set by the average counter. When set to Cont, the
measurement will run continuously and execute averaging according
to the current average mode, either repeat or exponential. The
default setting is Cont for most measurements, but the Code Domain
and Power Stat CCDF measurements have Single as the default.
Key Reference
Front Panel Keys
Mode Setup Key Menu
Key path: Mode Setup
Input Key Menu
Key Path: Mode Setup, Input
NOTE
You can also access this menu from the Input/Output front panel key.
• Input Port - Allows you to access the menu to select one of the signal
input ports as follows:
— RF - Measures an RF signal supplied to the front panel RF input
port.
— 50 MHz Ref - Allows you to measure the 50 MHz reference signal
to calibrate the instrument.
— IF Align - Allows you to configures the IF alignment signal. The
RF path is manually switched to bring in the internal alignment
signal.
Key Reference
• Input Atten - Controls the internal input attenuator setting. The
electronic attenuator range is 0 to 40 dB with 1 dB resolution. The
Input Atten key reads out the value that is used for the current
measurement. If more than one input attenuator value is used in a
single measurement, the value used at the carrier frequency will be
displayed. The Input Atten setting is coupled to the Max Total Pwr
setting.
When you use the internal preamplifier, Int Preamp, the electronic
attenuator selections using the Input Atten key are not available, and
the key is grayed out. Use the mechanical attenuator under
Attenuator, below.
• Ext RF Atten - Enters the external attenuation values. The Ext RF
Atten settings is coupled to the RF Input Range setting. This will allow
the instrument to display the measurement results referenced to the
output of the UUT.
• Int Preamp - (For PSA Option 1DS or Option 110) Controls the
internal RF input preamplifier. The internal preamplifier provides
+30 dB of gain and is useful for lower power measurements. The Int
Preamp setting default is Off. RF power values displayed for these
measurements are adjusted to compensate for the internal
preamplifier gain, and indicate power levels at the input port. The
preamplifier is only available for Modulation Accuracy (EVM and
Peak Code Domain Error) measurements, QPSK EVM, and Code
Domain measurements. If the Int Preamp is not available for a
particular measurement, the key is grayed out.
To avoid damaging the internal preamplifier, limit the total power
162
Chapter 5
Key Reference
Front Panel Keys
applied to the RF input to ≤+25 dBm.
When using the internal preamplifier, the electronic attenuator
selections using the Input Atten key are not available, and the key is
grayed out. Use the mechanical attenuator under More, Attenuator,
below.
• Attenuator - (For PSA Option 1DS or Option 110) When Int Preamp is
set to On, this key controls an internal mechanical input attenuator
setting. The choices are 0 dB, 10 dB, and 20 dB. The Attenuator key
shows the actual hardware value that is used for the current
measurement. The Attenuator setting is not coupled to the Max Total
Pwr setting.
The Attenuator is only available for measurements which can use the
Int Preamp: Modulation Accuracy (EVM and Peak Code Domain
Error) measurements, QPSK EVM, and Code Domain
measurements. If the Int Preamp is not available for a particular
measurement, the key is grayed out.
• IF Align Signal - Accesses the following menu to select one of the
signals to be used for IF alignment:
❏ Signal Rate - Sets a value to be used for dividing the fundamental
frequency of 468.75 kHz. The value ranges from 0 to 12 as the
power of 2.
❏ Signal Type - Accesses the following menu to select one of the
signal types:
❏ CW - Sets the IF alignment signal to CW.
❏ Comb - Sets the IF alignment signal to comb wave.
❏ Pulse - Sets the IF alignment signal to pulse wave.
Input Default Settings
Input Port
RF
Input Atten
0.00 dB
Ext RF Atten:
MS
BTS
0.00 dB
0.00 dB
Int Preamp
OFF
Attenuator
0 dB
Chapter 5
163
Key Reference
❏ Signal Amptd - Sets an amplitude value to be applied to the digital
analog converter, for the IF alignment signal. The value ranges
from 0 to 4095. This functionality is not available if the PSA
Option 122 or 140 wideband IF path is selected.
Key Reference
Front Panel Keys
Input Default Settings
0; = 468.75 kHz
DAC 500
CW
Key Reference
IF Align Signal:
Signal Rate
Signal Amptd
Signal Type
164
Chapter 5
Key Reference
Front Panel Keys
Trigger Key Menu
Key Path: Mode Setup, Trigger, <trigger type>
NOTE
The actual trigger source is selected individually for each measurement
under the Meas Setup key.
• RF Burst, Video (Envlp), Ext Front, Ext Rear- Pressing any one of these
trigger keys accesses the following triggering condition setup menu.
This menu is used to specify the Delay, Level and Slope settings for
each trigger source as follows:
— Delay - Enters a numerical value to modify the trigger delay time.
The range is −100.0 to +500.0 ms with 1 µs resolution. For trigger
delay use a positive value, and for pre-trigger use a negative
value.
— Level - Enters a numerical value to adjust the trigger level
depending on the trigger source selected.
❏ For RF Burst, the key label reads as Peak Level. The RF level
range is −25.00 to 0.00 dB with 0.01 dB resolution, relative to
the peak RF signal level. The realistic range can be down to
−20 dB.
❏ For Video (Envlp), the video level range is −200.00 to
+50.00 dBm with 0.01 dB resolution at the RF input. The
realistic range can be down to around −50 dBm depending on
the noise floor level of the input signal.
— Slope - Toggles the trigger slope between Pos at the positive-going
edge and Neg at the negative-going edge of the burst signal.
• Trig Holdoff - Sets the period of time before the next trigger can occur.
The range is 0.000 µs to 500.0 ms with 1 µs resolution.
For Option 122 or 140: When the wideband path is selected, the
trigger holdoff is the minimum time that must occur between trigger
events before a trigger is accepted. For example, a rising edge
external trigger with a 10 ms holdoff will not trigger until at least 10
ms has passed during which no rising edges have occurred.
This Option 123 definition changes slightly for negative slope video
triggers. For this case the instrument waits until it sees a time
interval following the trigger event that is free of additional trigger
events. This lets you trigger on the falling edge of a burst that may
contain trigger events.
• Auto Trig - Specifies a time for a trigger timeout and toggle the auto
trigger function between On and Off. The range is 1.000 ms to 1.000
Chapter 5
165
Key Reference
❏ For Ext Front or Ext Rear, the level range is −5.00 to +5.00 V
with 1 or 10 mV resolution.
Key Reference
Front Panel Keys
ks with 1 µs resolution. If no trigger occurs by the specified time, a
trigger is automatically generated.
• Frame Timer - Accesses the menu to manually control the frame
timer:
— Period - Sets the period of the frame clock. The range is 0.000 ns
to 559.0000 ms with 1 ns resolution.
— Offset - Sets the offset of the frame clock. The range is 0.000 to
10.00 s with 100 ns resolution over 1.000 µs range.
— Reset Offset Display - Displays the measurement without any
offset of the frame clock.
— Sync Source - Accesses the menu to select one of the sources to be
synchronized with.
For Option 122 or 140: The frame trigger will wait for, and sync
with, the first external trigger that is received after sync is turned
off. After the sync is received the frame trigger stays locked to
that event, ignoring any later triggers. The instrument will only
resync if the measurement settings are changed or if an
alignment occurs.
❏ Off - Turns the synchronizing source off for asynchronous tests.
❏ RF Burst (Wideband) - Selects the RF burst signal as the
synchronizing source. (Not available with Option 122 or 140
when using the wideband IF path.)
Key Reference
❏ Ext Front - Selects the external input signal from the front
panel input port as the synchronizing source. With Option 122
or 140, you can use the external front trigger setup menu to
change the trigger level or delay.
❏ Ext Rear - Selects the external input signal from the rear panel
input port as the synchronizing source. With Option 122 or
140, you can use the external rear trigger setup menu to
change the trigger level or delay.
Trigger Default Settings
RF Burst:
Delay
Peak Level
Slope
0.000 µs
−6.00 dB
Pos
Video (Envlp):
Delay
Level
Slope
0.000 µs
−6.00 dBm
Pos
166
Chapter 5
Key Reference
Front Panel Keys
Trigger Default Settings
Ext Front:
Delay
Level
Slope
0.000 µs
2.00 V
Pos
Ext Rear:
Delay
Level
Slope
0.000 µs
2.00 V
Pos
Trig Holdoff
0.000 ms
Auto Trig
100.0 ms; Off
Frame Timer:
Period
Offset
Sync Source
26.666667 ms
0.000 ms
Off
Key Reference
Chapter 5
167
Key Reference
Adjacent Channel Power (ACP) Keys
Adjacent Channel Power (ACP) Keys
NOTE
You must have selected ACP at Key Path: MEASURE to access these
menus.
Measurement Setup Key Menu
Key Path: Meas Setup
• Avg Number - Allows you to change the number of N averages.
• Avg Mode - Allows you to toggle the averaging mode between Exp
(exponential) and Repeat. This selection only effects on the averaging
result after the number of N averages is reached. The N is set using
the Avg Number key.
Key Reference
• Normal averaging: Normal (linear) averaging is always used
until the specified number of N averages is reached. When the
Measure key under Meas Control is set to Single, data acquisition is
stopped when the number of N averages is reached, thus Avg
Mode has no effect in the single measurement mode.
• Exponential averaging: When Measure is set to Cont, data
acquisition will continue indefinitely. Exponential averaging is
used with a weighting factor of N (the displayed count of averages
stops at N). Exponential averaging weights new data more
heavily than old data, which allows tracking of slow-changing
signals. The weighting factor N is set using the Avg Number key.
• Repeat averaging: When Measure is set to Cont, data
acquisition will continue indefinitely. After the number of N
averages is reached, all previous result data is cleared and the
average count displayed is set back to 1. This is equivalent to
being in Measure Single and pressing the Restart key each time the
single measurement finishes.
• Ref Channel - Allows you to access the following parameters for the
reference channel settings:
— Chan Integ BW - Allows you to specify the channel integration
bandwidth in which the carrier power is measured. The range is
1.000 kHz to 20.0000 MHz with the best resolution of 1 Hz.
— Avg Type - Allows you to set to power averaging type to either Pwr
Avg (RMS) or Maximum.
— Ref Chan Adv - Allows you to access the menu to change the
following advanced parameters for the reference channel:
❏ Sweep Time - Allows you to toggle the sweep time function
168
Chapter 5
Key Reference
Adjacent Channel Power (ACP) Keys
between Auto and Man (manual), and to set a value for the
sweep time ranging from 1.0 ms to 50.000 ms if set to Man. If
set to Auto, the reference channel measurement sweep time is
derived from the data points and the number of FFT segments.
❏ Data Points - Allows you to toggle the control function of the
number of data points between Auto and Man (manual), and to
set the number of data points ranging from 64 to 65536. The
automatic mode chooses the optimum number of points (= 2n+6
where n = 0 to 11) for the fastest measurement time with
acceptable repeatability. The minimum number of points that
could be used is determined by the sweep time and the
sampling rate. You can increase the length of the measured
time record (capture more of the burst) by increasing the
number of points, but the measurement will take longer.
❏ Res BW - This key is always grayed out. However, it allows you
to see the resolution bandwidth that is derived from the
combination of sweep time, data points, and FFT segments.
• Offset/Limits - Allows you to access the menu to change the following
parameters for offset frequency settings and pass/fail tests:
— Offset - Allows you to select one of five offsets (A through E). Only
one selection at a time (A, B, C, D, or E) is shown on this key
label. The remaining menu keys on the Offset/Limits menu then
apply to the selected offset.
— Offset Freq - Allows you to enter an offset frequency value and
toggle the offset function between On and Off. The range is 0.0 Hz
to 45.000 MHz. While this key is activated, enter an offset value
from the numeric keypad by terminating with one of the
frequency unit keys shown. Offsets A and B are defaulted as
follows for BS tests, while others are defaulted to 0.0 Hz and Off:
Offset A: 750.00 kHz, On
Offset B: 1.9800 MHz, On
One offset frequency center value corresponding to the Offset
menu selection is shown on this key label.
— Offset Side - Choose Neg (negative) or Pos (positive) to have
Chapter 5
169
Key Reference
❏ Num FFT Seg - Allows you to select the number of FFT
segments used in making the measurement of the reference
channel (carrier). In the automatic mode the measurement
optimizes the number of FFT segments required for the
shortest measurement time. The minimum number of
segments required to make a measurement is set by your
desired measurement bandwidth. Selecting more than the
minimum number of segments will give you more dynamic
range for making the measurement, but the measurement will
take longer to execute.
Key Reference
Adjacent Channel Power (ACP) Keys
single-sided offsets relative to the carrier, or Both (the default) to
have offset frequency pairs.
— Ref BW - Allows you to enter a reference bandwidth ranging from
300 Hz to 20.0000 MHz with the best resolution of 1 Hz. When
this parameter is changed, the integration bandwidth Integ BW
in the summary data window changes to that value.
— Avg Type - Choose the type of averaging between Pwr Avg (RMS) or
Maximum.
— Limit Setup - Allows you to access the menu to setup the limit
values and conditions.
❏ Abs Limit - Allows you to enter an absolute limit value ranging
from −200.00 to +50.00 dBm with 0.01 dB resolution.
❏ Fail - Allows you to access the following menu to select one of
the logic keys for fail conditions between the measurement
results and the test limits:
AND - Fail is shown if one of the relative ACP measurement
results is larger than Rel Lim (Car) or Rel Lim (PSD) AND one
of the absolute ACP measurement results is larger than
Abs Limit.
OR - Fail is shown if one of the relative ACP measurement
results is larger than Rel Lim (Car) or Rel Lim (PSD) OR one
of the absolute ACP measurement results is larger than
Abs Limit.
Key Reference
Absolute - Fail is shown if one of the absolute ACP
measurement results is larger than Abs Limit.
Relative - Fail is shown if one of the relative ACP
measurement results is larger than Rel Lim (Car) or Rel
(PSD).
❏ Rel Lim (Car)- Allows you to enter a relative limit value of the
carrier level ranging from −150.00 to +50.00 dBc with 0.01 dB
resolution. The default is −45.00 dBc for Offset A and
−60.00 dBc for Offset B.
❏ Rel Lim (PSD)- Allows you to enter a relative limit value of the
power spectral density level ranging from −150.00 to
+50.00 dB with 0.01 dB resolution. The default is −28.87 dB for
Offset A and −43.87 dB for Offset B.
— Offset Adv - Allows you to access the menu to change the following
advanced offset parameters:
❏ Sweep Time - Allows you to toggle the sweep time function
between Auto and Man (manual), and to set a value for the
sweep time ranging from 1.0 ms to 50.000 ms if set to Man. If
set to Auto, the offset channel measurement sweep time is
170
Chapter 5
Key Reference
Adjacent Channel Power (ACP) Keys
derived from the data points and the number of FFT segments.
❏ Data Points - Allows you to toggle the control function of the
number of data points between Auto and Man (manual), and to
set the number of data points ranging from 64 to 65536. If set
to Auto, the optimum number of points (= 2n+6 where n = 0 to
11) for the fastest measurement time with acceptable
repeatability is automatically determined. The minimum
number of points that could be used is determined by the
sweep time and the sampling rate. You can increase the length
of the measured time record (capture more of the burst) by
increasing the number of points, but the measurement will
take longer.
❏ Res BW - This key is always grayed out. However, it allows you
to see the resolution bandwidth that is derived from the
combination of sweep time, data points, and FFT segments.
❏ Num FFT Seg - The automatic mode selects the optimum
number of FFT segments to measure the offset, while making
the fastest possible measurement.
• Meas Type - Allows you to access the menu to select one of the
measurement reference types.
— Total Pwr Ref - Select this to set the total carrier power to the
measurement reference level and the measured data is shown in
dBc and dBm.
— PSD Ref - Select this to set the mean power spectral density of the
carrier to the measurement reference level and the measured
data is shown in dB and dBm/Hz.
• Fast ACP - Allows you to increase the speed of the measurement. A
time domain computation method is used rather than an FFT
transformation. When this faster measurement method is selected,
repeatability is slightly reduced.
• Spectrum Trace - Turns off the spectrum trace data calculations. This
is only applicable when using the Spectrum View. It speeds up the
display of the other measured data values by not calculating the
spectrum trace.
• Limit Test - Turns on or off the limit test function.
Chapter 5
171
Key Reference
❏ Relative Atten - Allows you to set a relative amount of
attenuation for the measurements made at your offsets. The
amount of attenuation is always specified relative to the
attenuation that is required to measure the carrier channel.
Since the offset channel power is lower than the carrier
channel power, less attenuation is required to measure the
offset channel and you get wider dynamic range for the
measurement.
Key Reference
Adjacent Channel Power (ACP) Keys
• Restore Meas Defaults - Allows you to preset only the settings that are
specific to the selected measurement by pressing Meas Setup, More (1
of 2), Restore Meas Defaults. This will set the measure setup
parameters, for the currently selected measurement only, to the
factory defaults.
The next table shows the factory default settings for adjacent channel
power ratio measurements.
Table 5-1
Adjacent Channel Power Measurement Defaults
Measurement Parameter
Factory Default Condition
View/Trace
Bar Graph (Total Pwr Ref)
Spectrum Trace
On
Avg Number
20; On
Avg Mode
Repeat
Key Reference
Ref Channel:
Chan Integ BW
Avg Type
Ref Chan Adv.:
Sweep Time
Data Points
Res BW
Num FFT Seg
Offset/Limits:
Offset
Offset Freq
Offset Side
Ref BW
Avg Type
Limit Setup:
Abs Limit
Fail
Rel Lim (Car)
Rel Lim (PSD)
Offset Adv.:
Sweep Time
Data Points
Res BW
Num FFT Seg
Relative Atten
1.23000 MHz
Pwr Avg (RMS)
546.1 µs; Auto
2048; Auto
1.620 kHz (grayed out)
1; Auto
A
A: 750.000 kHz; On
B: 1.98000 MHz; On
Both
30.000 kHz
Pwr Avg (RMS)
0.00 dBm
Relative
Α: −45.00 dBc
B: −60.00 dBc
A: −28.87 dB
B: −43.87 dB
11.20 ms; Auto
1024; Auto
79.0 Hz (grayed out)
1; Auto
0.00 dB
Meas Type
Total Pwr Ref
Trig Source
Free Run (Immediate)
Fast ACP
Off
172
Chapter 5
Key Reference
Adjacent Channel Power (ACP) Keys
Table 5-1
Adjacent Channel Power Measurement Defaults
Measurement Parameter
Factory Default Condition
Limit Test
On
Key Reference
Chapter 5
173
Key Reference
Adjacent Channel Power (ACP) Keys
View/Trace Key Menu
Key Path: View/Trace
The View/Trace key accesses the menu to select either Bar Graph or
Spectrum for the measurement result, depending on the Sweep Type
setting.
• Bar Graph - In the factory default condition 5 of the total integration
power levels, centered at the carrier frequency and ±765.0 kHz and
±1.995 MHz offset frequencies, are shown in the figure for the
“Results” section. The corresponding measured data is shown in the
text window. Depending on the Meas Type selection, one of the two
following displays is obtained:
Bar Graph (Total Pwr Ref) - A histogram of powers referenced
to the total power
Bar Graph (PSD Ref) - A histogram of powers referenced to the
mean power spectral density of the carrier in dBm/Hz
• Spectrum - In the factory default condition, the frequency spectrum
with the FFT sweep type is displayed with the bandwidth marker
lines in the graph window. The corresponding measured data in the
text window is the total integration power levels, in dBc and dBm,
within the defined bandwidth as shown in the figure below.
ACP Measurement - Spectrum View
Key Reference
Figure 5-2
Depending on the Meas Type setting, one of the two following
displays is obtained:
Spectrum (Total Pwr Ref) - A spectrum display referenced to
174
Chapter 5
Key Reference
Adjacent Channel Power (ACP) Keys
the total power
Spectrum (PSD Ref) - A spectrum display referenced to the
mean power spectral density of the carrier in dBm/Hz
You can improve the update speed of the displayed data values by
turning off the spectrum trace in Meas Setup.
Key Reference
Chapter 5
175
Key Reference
Channel Power Keys
Channel Power Keys
NOTE
You must have selected Channel Power at Key Path: MEASURE to use
these menus.
Measurement Setup Key Menu
Key Path: Meas Setup
• Avg Number - Allows you to change the number of N averages.
• Avg Mode - Allows you to toggle the averaging mode between Exp
(exponential) and Repeat. This selection only effects on the averaging
result after the number of N averages is reached. The N is set using
the Avg Number key.
Key Reference
• Normal averaging: Normal (linear) averaging is always used
until the specified number of N averages is reached. When the
Measure key under Meas Control is set to Single, data acquisition is
stopped when the number of N averages is reached, thus Avg
Mode has no effect in the single measurement mode.
• Exponential averaging: When Measure is set to Cont, data
acquisition will continue indefinitely. Exponential averaging is
used with a weighting factor of N (the displayed count of averages
stops at N). Exponential averaging weights new data more
heavily than old data, which allows tracking of slow-changing
signals. The weighting factor N is set using the Avg Number key.
• Repeat averaging: When Measure is set to Cont, data
acquisition will continue indefinitely. After the number of N
averages is reached, all previous result data is cleared and the
average count displayed is set back to 1. This is equivalent to
being in Measure Single and pressing the Restart key each time the
single measurement finishes.
• Integ BW - Allows you to specify the integration bandwidth in which
the power is measured. The range is 1.000 kHz to 10.0000 MHz with
1 Hz resolution. Since Integ BW is coupled to Chan Power Span in the
factory default condition, if you change the integration bandwidth
setting, the channel power span setting changes by a proportional
amount, 1.2 times the integration bandwidth, until a limit value is
reached.
• Chan Power Span - Allows you to set the frequency span for the
channel power measurement. The range is 1.000 kHz to
10.0000 MHz with 1 Hz resolution. This span is used for the current
integration bandwidth setting. Since Chan Power Span is coupled to
Integ BW in the factory default condition, if you change the
176
Chapter 5
Key Reference
Channel Power Keys
integration bandwidth setting, the channel power span setting
changes by a proportional amount, 1.2 times the integration
bandwidth, until a limit value is reached. However, the channel
power span can be individually set.
• Restore Meas Defaults - Allows you to preset only the settings that are
specific to the selected measurement by pressing Meas Setup, More (1
of 2), Restore Meas Defaults. This will set the measure setup
parameters, for the currently selected measurement only, to the
factory defaults.
• Advanced - Allows you to access the following menu to modify the
channel power measurement parameters:
NOTE
Parameters under the Advanced key seldom need to be changed. Any
changes from the factory default values may result in invalid
measurement data.
— Sweep Time - Allows you to manually change the sweep time and
also to toggle the sweep time control between Auto and Man
(manual). The range is 1.0 µs to 50.00 ms with 1 µs resolution. If
set to Auto, the sweep time derived from the data point setting is
shown on this key regardless of the manual entry range.
— Res BW - Shows information on the resolution bandwidth derived
from the sweep time. This key is always grayed out.
— Trig Source - Allows you to choose a trigger source from Free Run
(Immediate), Video (Envlp), RF Burst (Wideband), Ext Front, Ext Rear,
Frame, I/Q Input, or Line.
The next table shows the factory default settings for channel power
measurements.
Table 5-2
Channel Power Measurement Defaults
Measurement Parameter
Factory Default Condition
Meas Setup:
Avg Number
Chapter 5
200; On
177
Key Reference
— Data Points - Allows you to select the number of data points and
also to toggle the data point control between Auto and Man
(manual). The range is 64 to 65536 with the acceptable entry in
powers of 2 (for example: 64, 128, 512). If set to Auto, the optimum
number of points is determined for the fastest measurement time
with acceptable repeatability. The minimum number of points
that could be used is determined by the sweep time and the
sampling rate. You can increase the length of the measured time
record (capture more of the burst) by increasing the number of
points, but the measurement will take longer.
Key Reference
Channel Power Keys
Table 5-2
Channel Power Measurement Defaults
Measurement Parameter
Factory Default Condition
Avg Mode
Repeat
Integ BWa
5.00000 MHz
Chan Power Spana
6.00000 MHz
Advanced
Sweep Time
68.27 µs; Auto
Data Points
2048; Auto
Res BW (grayed out)
27.857 kHz (grayed out)
Trig Source
Free Run (Immediate)
Key Reference
a. The Integ BW setting proportionally changes the Chan Power
Span setting up to 10 MHz.
178
Chapter 5
Key Reference
Channel Power Keys
AMPLITUDE Y Scale Key Menu
Key Path: AMPLITUDE Y Scale
The AMPLITUDE Y Scale key accesses the menu to set the desired
vertical scale and associated settings:
• Scale/Div - Allows you to enter a numeric value to change the vertical
display sensitivity. The range is 0.10 to 20.00 dB with 0.01 dB
resolution. The default setting is 10.00 dB. However, since the Scale
Coupling default is On, this value is automatically determined by the
measurement result. When you set a value manually, Scale Coupling
automatically changes to Off.
• Ref Value - Allows you to set the absolute power reference value
ranging from −250.00 to 250.00 dBm with 0.01 dB resolution. The
default setting is 10.00 dBm. However, since the Scale Coupling
default is On, this value is automatically determined by the
measurement result. When you set a value manually, Scale Coupling
automatically changes to Off.
• Ref Position - Allows you to set the display reference position to
either Top, Ctr (center), or Bot (bottom). The default setting is Top.
Marker Key Menu
The Marker key is not available for this measurement function.
Chapter 5
179
Key Reference
• Scale Coupling - Allows you to toggle the scale coupling function
between On and Off. The default setting is On. Upon pressing the
Restart front-panel key or Restart menu key under the Meas Control
menu, the scale coupling function automatically determines the
scale per division and reference values based on the measurement
results. When you set a value to either Scale/Div or Ref Value
manually, Scale Coupling automatically changes to Off.
Key Reference
Spectrum (Frequency Domain) Keys
Spectrum (Frequency Domain) Keys
NOTE
You must have selected Spectrum under the MEASURE menu to access
these menus
Meas Setup Key Menu
Key Path: Meas Setup
• Span - Modifies the frequency span. The range is 10 Hz to 10 MHz
with 1 Hz resolution, depending on the Res BW setting. Changing
the span causes the resolution bandwidth to change automatically,
and will affect data acquisition time. For PSA Option 122 wideband
operation, the maximum span is 80 MHz. For PSA Option 140
wideband operation, the maximum span is 40 MHz.
• Res BW - Sets the resolution bandwidth for the FFT, and to toggle its
mode between Auto and Man (manual). If set to Auto, the resolution
bandwidth is set to Span/50 (2% of the span). If set to Man, you can
enter a value ranging from 100.0 mHz to 3.00000 MHz. A narrower
bandwidth will result in a longer data acquisition time.
• Average
Key Reference
— Avg Number - Changes the number of N averages.
— Avg Mode - Toggles the averaging mode between Exp (exponential)
and Repeat. This selection only effects on the averaging result
after the number of N averages is reached. The N is set using the
Avg Number key.
• Normal averaging: Normal (linear) averaging is always used
until the specified number of N averages is reached. When the
Measure key under Meas Control is set to Single, data
acquisition is stopped when the number of N averages is
reached, thus Avg Mode has no effect in the single
measurement mode.
• Exponential averaging: When Measure is set to Cont, data
acquisition will continue indefinitely. Exponential averaging is
used with a weighting factor of N (the displayed count of
averages stops at N). Exponential averaging weights new data
more heavily than old data, which allows tracking of
slow-changing signals. The weighting factor N is set using the
Avg Number key.
• Repeat averaging: When Measure is set to Cont, data
acquisition will continue indefinitely. After the number of N
averages is reached, all previous result data is cleared and the
average count displayed is set back to 1. This is equivalent to
180
Chapter 5
Key Reference
Spectrum (Frequency Domain) Keys
being in Measure Single and pressing the Restart key each time
the single measurement finishes.
—
Avg Type - Accesses the menu of the following average types
only for making spectrum (frequency domain) and waveform
(time domain) measurements:
❏ Pwr Avg (RMS) - Executes the true power averaging which is
calculated by averaging the rms voltage. This is the most
accurate type.
❏ Log-Pwr Avg (Video) - Simulates the traditional spectrum
analyzer type of averaging by calculating the log of the
power. This type of averaging will underestimate the power
when the signal is noise-like.
❏ Voltage Avg - Executes voltage averaging.
❏ Maximum - Captures peak voltage data. Simulates the
traditional spectrum analyzer peak hold function.
❏ Minimum - Captures the minimum voltage data, similar to
the maximum function.
• Trig Source
Key path: Meas Setup, Trig Source
NOTE
Changing the selection in the Trig Source menu alters the trigger source
for the selected measurement only.
— Video (Envlp) - An internal IF envelope trigger that occurs at the
absolute threshold level of the IF signal level.
— RF Burst (Wideband) - An internal wideband RF burst trigger that
has the automatic level control for burst signals. It triggers at the
level that is set relative to the peak RF signal (12 MHz
bandwidth) input level.
— Ext Front - Activates the front panel external trigger input (EXT
TRIGGER INPUT) port. The external signal must be between −5.00
and +5.00 V with 1 or 10 mV resolution.
— Ext Rear - Activates the rear-panel external trigger input
(TRIGGER IN) port. The external signal must be between −5.00 and
+5.00 V with 1 or 10 mV resolution.
— Frame - Uses the internal frame clock to generate a trigger signal.
The clock parameters are controlled under the Mode Setup key or
the measurement firmware, but not both. Refer to the specific
measurement section for details.
Chapter 5
181
Key Reference
— Free Run (Immediate) - A trigger occurs at the time the data is
requested, completely asynchronous with the RF or IF signal.
Key Reference
Spectrum (Frequency Domain) Keys
— Line - Sets the trigger to the internal line mode. Sweep triggers
occur at intervals synchronous to the line frequency. See the
specific measurement section for details.
• Restore Meas Defaults - Presets only the settings that are specific to
the selected measurement by pressing Meas Setup, More (1 of 2),
Restore Meas Defaults. This will set the measure setup parameters,
for the currently selected measurement only, to the factory defaults.
• (Narrowband) Advanced Accesses the menu to change the following
parameters.
NOTE
The advanced features should be used only if you are familiar with their
operation. Changes from the default values may result in invalid data.
The Narrowband key word is only present if you have Option B7J and
either Option 122 or 140 installed. Parameters that are under the
(Narrowband) Advanced key only affect the standard narrow band IF
path. The wideband IF advanced functions are found under the
Wideband Advanced key.
Key Reference
— Pre-ADC BPF - Toggles the pre-ADC bandpass filter function
between On and Off. The pre-ADC bandpass filter is useful for
rejecting nearby signals, so that sensitivity within the span range
can be improved by increasing the ADC range gain.
— Pre-FFT Fltr - Toggles the pre-FFT filter between Flat (flat top) and
Gaussian. The pre-FFT filter defaults to a flat top filter which has
better amplitude accuracy. The Gaussian filter has better pulse
response.
— Pre-FFT BW - Toggles the pre-FFT bandwidth function between
Auto and Man (manual). The pre-FFT bandwidth filter can be set
between 1 Hz and 10 MHz. If set to Auto, this pre-FFT bandwidth
is nominally 50% wider than the span. This bandwidth
determines the ADC sampling rate.
— FFT Window - Accesses the following selection menu. Unless you
are familiar with FFT windows, use the flat top filter (the default
filter).
❏ Flat Top - Selects this filter for best amplitude accuracy by
reducing scalloping error.
❏ Uniform - Select this filter to have no window active by using
the uniform setting.
❏ Hanning - Press this key to activate the Hanning filter.
❏ Hamming - Press this key to activate the Hamming filter.
❏ Gaussian - Press this key to activate the Gaussian filter with
the roll-off factor (alpha) of 3.5.
182
Chapter 5
Key Reference
Spectrum (Frequency Domain) Keys
❏ Blackman - Press this key to activate the Blackman filter.
❏ Blackman Harris - Press this key to activate the Blackman
Harris filter.
❏ K-B 70dB/90dB/110dB (Kaiser-Bessel) - Select one of the
Kaiser-Bessel filters with sidelobes at −70, −90, or −110 dBc.
— FFT Size - Accesses the menu to change the following parameters:
❏ Length Ctrl - Toggles the FFT and window length setting
function between Auto and Man (manual).
❏ Min Pts in RBW - Sets the minimum number of data points that
will be used inside the resolution bandwidth. The range is 0.10
to 100.00 points with 0.01 resolution. This key is grayed out if
Length Ctrl is set to Man.
❏ Window Length - Enters the FFT window length in the number
of capture samples, ranging from 8 to 1048576. This length
represents the actual quantity of I/Q samples that are
captured for processing by the FFT (“Capture Time” is the
associated parameter shown on the screen). This key is grayed
out if Length Control is set to Auto.
❏ FFT Length - Enters the FFT length in the number of captured
samples, ranging from 8 to 1048576. The FFT length setting is
automatically limited so that it is equal to or greater than the
FFT window length setting. Any amount greater than the
window length is implemented by zero-padding. This key is
grayed out if Length Control is set to Auto.
❏ Auto - Sets the ADC range automatically. For most FFT
spectrum measurements, the auto feature should not be
selected. An exception is when measuring a signal which is
“bursty”, in which case auto can maximize the time domain
dynamic range, if FFT results are less important to you than
time domain results.
❏ Auto Peak - Sets the ADC range automatically to the peak
signal level. Auto peak is a compromise that works well for
both CW and burst signals.
❏ Auto Peak Lock - Select this to hold the ADC range
automatically at the peak signal level. Auto peak lock is more
stable than auto peak for CW signals, but should not be used
for “bursty” signals.
❏ Manual - Accesses the selection menu of values, −6 to +24 dB
for E4406A or None to +18 dB for PSA, to set the ADC range
level. Also note that manual ranging is best for CW signals.
Chapter 5
183
Key Reference
— ADC Range - Accesses the menu to define one of the following ADC
ranging functions:
Key Reference
Spectrum (Frequency Domain) Keys
— Data Packing - Selects Auto (the default) or the Short (16 bit),
Medium (24 bit) and Long (32 bit) methods of data packing. The
short, medium, and long methods are not compatible with all
settings and should not be used unless you are familiar with data
packing methods. Auto is the preferred choice.
❏ Auto - The data packing value most appropriate for current
instrument settings is selected automatically.
❏ Short (16 bit) - Select this to pack data every 16 bits.
❏ Medium (24 bit) - Select this to pack data every 24 bits.
❏ Long (32 bit) - Select this to pack data every 32 bits.
— ADC Dither - Toggles the ADC dither function between Auto, On,
and Off. When set to Auto (the default), the ADC dither function
will be activated when a narrow bandwidth is being measured,
and deactivated when a wide bandwidth is being measured. “ADC
dither” refers to the introduction of noise to the digitized steps of
the analog-to-digital converter; the result is an improvement in
amplitude accuracy. Use of the ADC dither, however, reduces
dynamic range by approximately 3 dB.
Key Reference
— Decimation - Toggles the decimation function between Auto and
Man, and to set the decimation value. Auto is the preferred
setting, and the only setting that guarantees alias-free FFT
spectrum measurements. If you are familiar with the decimation
feature, you can change the decimation value by setting to Man,
but be aware that aliasing can result in higher values.
Decimation numbers 1 to 1000 describe the factor by which the
number of points are reduced. The default setting is 0, which
results in no data point reduction. Decimation by 3 keeps every
3rd sample, throwing away the 2 in between.
— IF Flatness - Toggles the IF flatness function between On and Off.
If set to On (the default), the IF flatness feature causes
background amplitude corrections to be performed on the FFT
spectrum. The Off setting is used for adjustment and
troubleshooting of the test instrument.
The following table shows the factory default settings for spectrum
(frequency domain) measurements.
Table 5-3
Spectrum (Frequency Domain) Measurement Defaults
Measurement Parameter
Factory Default Condition
Trace Display
All
Res BW
20.0000 kHz; Auto
184
Chapter 5
Key Reference
Spectrum (Frequency Domain) Keys
Table 5-3
Spectrum (Frequency Domain) Measurement Defaults
Measurement Parameter
Factory Default Condition
Averaging:
Avg Number
Avg Mode
Avg Type
Time Avg Num (Opt. 122 or 140)
25; On
Exp
Log-Pwr Avg (Video)
1
Trig Source
Free Run (Immediate)
Region/Limits:
Region
Upper Mask
Lower Mask
Offset Start
Offset Stop
Interval
A
A: −40.00 dB; On
A: −100.00 dB; Off
A: −667.0 µs
A: −25.0 µs
A: 642.0 µs
IF Path (requires Option B7J and
Option 122 or 140)
Narrow
Wideband IF Gain (Opt. 122 or
140)
0.00 dB
Wideband Filtering (Opt. 122 or
140
Filter Type
Filter Alpha
Filter BW
None
0.30
0.50
1.000 MHz (VSA), 10.000 MHz (PSA)
10.00 dB
I/Q Waveform View:
Capture Time
AMPLITUDE Y Scale - Scale/Div
188.00 µs
100.0 mV
Spectrum Linear View:
SPAN
AMPLITUDE Y Scale - Scale/Div
(for E4406A)
1.00000 MHz
100.0 mV
I and Q Waveform View:
Capture Time
AMPLITUDE Y Scale - Scale/Div
(for E4406A)
188.00µs
100.0 mV
I/Q Polar View:
I/Q Scale/Div
I or Q Origin
(for E4406A)
100.0 mV
0.00 V
(Narrowband) Advanced
Pre-ADC BPF
Chapter 5
On
185
Key Reference
Spectrum View:
SPAN
AMPLITUDE Y Scale - Scale/Div
Key Reference
Spectrum (Frequency Domain) Keys
Table 5-3
Spectrum (Frequency Domain) Measurement Defaults
Measurement Parameter
Factory Default Condition
Pre-FFT Filter
Flat
Pre-FFT BW
1.55000 MHz; Auto
FFT Window
Flat Top (High Amptd Acc)
FFT Size:
Length Control
Min Points/RBW
Window Length
FFT Length
Auto
3.100000
706 (VSA), 566 (PSA)
1024
ADC Range
Auto Peak
Data Packing
Auto
ADC Dither
Auto
Decimation
0; Auto
IF Flatness
On
Key Reference
Wideband Advanced (Option 122 or 140 PSA only)
ADC Correction
On
IF Flatness Corrections
On
Analog Filter
Auto, 80 MHz (Opt 122), 40 MHz (Opt
140)
WB ADC Dither
On
FFT Window
Flat Top (High Amptd Acc)
FFT Size:
Length Control
Min Points/RBW
Window Length
FFT Length
Auto
3.100
236 (Opt. 122), 118 (Opt. 140)
256 (Opt. 122), 128 (Opt. 140)
186
Chapter 5
Key Reference
Spectrum (Frequency Domain) Keys
View/Trace Key Menu
The View/Trace key allows you to select the desired view of the
measurement from the following. You can use the Next Window key to
move between the multiple windows (if any) and make it full size by
Zoom.
• Spectrum - Provides a combination view of the spectrum graph in
parameters of power versus frequency with semi-log graticules, and
the I/Q waveform graph in parameters of voltage and time. Changes
to frequency span or power will sometimes affect data acquisition.
This is equivalent to changing the selected window with the Next
key.
Key Reference
Chapter 5
187
Key Reference
Spectrum (Frequency Domain) Keys
Figure 5-3
Spectrum Measurement - Spectrum and I/Q Waveform (Default
View)
Key Reference
The spectrum measurement result should look like the above
figure. The measurement result values are shown in the summary
result window.
• Spectrum (Time Domain) I/Q Waveform - (Key for PSA only) This graph
is shown below the Spectrum graph in the default dual-window
display. I/Q Waveform provides a view of the I/Q waveform in
parameters of voltage versus time in linear scale. Changes to sweep
time or resolution bandwidth can affect data acquisition. Pressing
this button is equivalent to pressing the Next Window button on the
front panel. Press the Zoom key to view this display full-screen.
188
Chapter 5
Key Reference
Spectrum (Frequency Domain) Keys
• Spectrum Linear - (for E4406A) Provides a view of the spectrum graph
in parameters of voltage versus frequency in linear scale. Changes to
frequency span or voltage can affect data acquisition.
Figure 5-4
Spectrum Measurement - Linear Spectrum View (for E4406A)
*Meas Setup:
*Input signals: −10.00 dBm, 9 channels of SR1, cdma2000 Rev 8
NOTE
(for E4406A) For the widest spans, the I/Q window becomes just “ADC
time domain samples”, because the I/Q down-conversion is no longer in
effect. This is not the case for E4406A Option B7C if the Input Port is set
to either I/Q, I only, or Q only and you have connected baseband I/Q
signals to the I/Q INPUT connectors.
• I and Q Waveform - (for E4406A) Provides individual views of the I
and Q signal waveform windows in parameters of voltage versus
time.
To select the I or Q trace view, press the Next key at the bottom of the
display. The selected window will have a green outline. To view the
window full size press the Zoom key.
Chapter 5
189
Key Reference
View/Trace = Spectrum Linear,
Span = 3.000 MHz,
Y Scale/Div = 5.00 mV, Ref Value = 30.0 mV,
Others = Factory default settings
Key Reference
Spectrum (Frequency Domain) Keys
Spectrum Measurement - I and Q Waveform View (for E4406A)
Figure 5-6
Spectrum Measurement - I and Q Waveform View (for E4406A)
Key Reference
Figure 5-5
• I/Q Polar - (for E4406A) Provides a view of the I/Q signal displayed in
a polar vector graph.
190
Chapter 5
Key Reference
Spectrum (Frequency Domain) Keys
Figure 5-7
Spectrum Measurement - I/Q Polar View (for E4406A)
*Meas Setup:
View/Trace = I/Q Polar,
Others = Factory default settings
*Input signals: −10.00 dBm, Pilot channel, 1xEV-DO
Figure 5-8
Spectrum Measurement - I/Q Polar View (for E4406A)
Key Reference
• Trace Display - Press this key to reveal the trace selection menu. The
Chapter 5
191
Key Reference
Spectrum (Frequency Domain) Keys
currently selected trace type is shown on the Trace Display key.
— All - Views both the current trace and the average trace.
— Average - Views only the average trace (in blue color). See the
Meas Setup, Average keys to select different types of averaging.
— Current - Views only the trace (in yellow color) for the latest data
acquisition.
— I Trace - (for E4406A) Views only the I signal trace.
— Q Trace - (for E4406A) Views only the Q signal trace.
SPAN X Scale Key Menu
NOTE
The Spectrum or Linear Spectrum (for E4406A) window must be
active in the Spectrum or Spectrum Linear (for E4406A) view to access
the following Span X Scale key menu:
• Span - Modifies the frequency span. The range is 10.000 Hz to 10.000
MHz with 1 Hz resolution, depending on the Res BW setting.
Changing the span causes the resolution bandwidth to change
automatically, and will affect data acquisition time. The Span key is
also accessible under the Meas Setup menu.
Key Reference
NOTE
The I/Q Waveform (for E4406A) window must be active in the Spectrum
or Spectrum Linear (for E4406A) view to access the following Span X
Scale key menu:
• Scale/Div - Sets the horizontal scale by changing a time value per
division. The range is 1.00 ns to 1.00 s per division. The default
setting is 18.8 ms per division. However, since the Scale Coupling
default is On, this value is automatically determined by the
measurement results. When you set a value manually, Scale
Coupling automatically changes to Off.
• Ref Value - Sets the reference value ranging from −1.00 to 10.0 s. The
default setting is 0.00 s. However, since the Scale Coupling default is
On, this value is automatically determined by the measurement
results. When you set a value manually, Scale Coupling
automatically changes to Off.
• Ref Position - Sets the reference position to either Left, Ctr (center) or
Right. The default setting is Left.
• Scale Coupling - Toggles the scale coupling function between On and
Off. The default setting is On. Upon pressing the Restart front-panel
key or Restart menu key under the Meas Control menu, this function
automatically determines the scale per division and reference values
based on the measurement results. When you set a value to either
Scale/Div or Ref Value manually, Scale Coupling automatically
192
Chapter 5
Key Reference
Spectrum (Frequency Domain) Keys
changes to Off.
NOTE
The I/Q Polar window must be active in the I/Q Polar view (for
E4406A), for the SPAN X Scale key to access the following menu:
• I/Q Scale/Div - Sets the vertical and horizontal scales by changing the
value per division. The range is 1.00 nV to 20.00 V per division. The
default setting is 100.0 mV.
• I Origin or Q Origin - Sets the reference value ranging from −250.00 to
250.00 V. The default setting is 0.00 V.
AMPLITUDE Y Scale Key Menu
NOTE
The Spectrum or Linear Spectrum (for E4406A) window must be
active in the Spectrum or Spectrum Linear (for E4406A) view to access
the following AMPLITUDE Y Scale key menu:
• Scale/Div - Sets the vertical scale by changing an amplitude value per
division. The range is 0.10 dB to 20.00 dB per division or 1.00 nV to
20.00 V per division, respectively. The default setting is 10.00 dB or
100.0 mV. However, since the Scale Coupling default is On, this value
is automatically determined by the measurement results. When you
set a value manually, Scale Coupling automatically changes to Off.
• Ref Position - Sets the reference position to either Top, Ctr (center) or
Bot (bottom). The default setting is Ctr.
• Scale Coupling - Toggles the scale coupling function between On and
Off. The default setting is On. Upon pressing the Restart front-panel
key or Restart menu key under the Meas Control menu, this function
automatically determines the scale per division and reference values
based on the measurement results. When you set a value to either
Scale/Div or Ref Value manually, Scale Coupling automatically
changes to Off.
NOTE
The I or Q Waveform window must be active in the I and Q Waveform
view (for E4406A) for the AMPLITUDE Y Scale key to access the
following menu:
• Scale/Div - Sets the vertical scale by changing the amplitude value
per division. The range is 1.00 nV to 20.00 V per division. The
default setting is 100.0 mV. However, since the Scale Coupling
default is On, this value is automatically determined by the
Chapter 5
193
Key Reference
• Ref Value - Sets the reference value ranging from −250.00 to 250.00
dBm or −250.00 to 250.00 V. The default setting is 0.00 dBm or 0.00
V. However, since the Scale Coupling default is On, this value is
automatically determined by the measurement results. When you
set a value manually, Scale Coupling automatically changes to Off.
Key Reference
Spectrum (Frequency Domain) Keys
measurement results. When you set a value manually, Scale
Coupling automatically changes to Off.
• Ref Value - Sets the reference value ranging from −250.00 to 250.00 V.
The default setting is 0.00 V. However, since the Scale Coupling
default is On, this value is automatically determined by the
measurement results. When you set a value manually, Scale
Coupling automatically changes to Off.
• Ref Position - Sets the reference position to either Top, Ctr (center) or
Bot (bottom). The default setting is Ctr.
• Scale Coupling - Toggles the scale coupling function between On and
Off. The default setting is On. The Restart front-panel key or Restart
menu key under the Meas Control menu, this function automatically
determines the scale per division and reference values by the
measurement results. When you set a value to either Scale/Div or Ref
Value manually, Scale Coupling automatically changes to Off.
NOTE
The I/Q Polar window must be active in the I/Q Polar view (for
E4406A), for the AMPLITUDE Y Scale key to access the following menu:
• I/Q Scale/Div - Sets the vertical and horizontal scales by changing the
value per division. The range is 1.00 nV to 20.00 V per division. The
default setting is 100.0 mV.
Key Reference
• I Origin or Q Origin - Sets the reference value ranging from −250.00 to
250.00 V. The default setting is 0.00 V.
Display Key Menu
The Display Key is not active for this measurement.
Marker Key Menu
• Select 1 2 3 4 - Activates up to four markers with the corresponding
numbers, respectively. The selected number is underlined and its
function is defined by pressing the Function key. The default is 1.
• Normal - Activates the selected marker to read the frequency and
amplitude of the marker position on the spectrum trace. Marker
position is controlled by the RPG knob.
• Delta - Reads the differences in frequency and amplitude between the
selected marker and the next marker.
• Function Off - Selects marker function to be Band Power, Noise, or Off.
The default is Off. If set to Band Power, you need to select Delta.
• Trace Spectrum - Places the selected marker on the Spectrum,
Spectrum Avg, Spectrum Linear (for E4406A), Spectrum Avg Linear (for
E4406A), I/Q Waveform, I Waveform (for E4406A), or Q Waveform (for
194
Chapter 5
Key Reference
Spectrum (Frequency Domain) Keys
E4406A) trace. The default is Spectrum.
• Off - Turns off the selected marker.
• Shape Diamond - Accesses the menu to define the selected marker
shape to be Diamond, Line, Square, or Cross. The default shape is
Diamond.
• Marker All Off - Turns off all of the markers.
Peak Search Key
The front panel Search key performs a peak search when pressed. A
marker will automatically be activated at the highest peak.
Key Reference
Chapter 5
195
Key Reference
Waveform (Time Domain) Keys
Waveform (Time Domain) Keys
NOTE
You must have selected Waveform under the Key Path: MEASURE menu
to access these menus.
Measurement Setup Key Menu
Key Path: Meas Setup
• Sweep Time - Specifies the measurement acquisition time which is
used as the length of the time capture record. The range is 1.0 µs and
100.0 s, depending upon the resolution bandwidth setting and the
available internal memory size for acquisition points.
• Res BW - Sets the measurement bandwidth. The range is 10 Hz to 8
MHz using the Gaussian filter selected from RBW Filter under the
Advanced menu, or 10 Hz to 10 MHz using the Flat top filter selected
from RBW Filter. A larger bandwidth results in a larger number of
acquisition points and reduces the maximum value allowed for the
sweep time.
• Average
Key Reference
— Avg Number - Changes the number of N averages.
— Avg Mode - Toggles the averaging mode between Exp (exponential)
and Repeat. This selection only effects on the averaging result
after the number of N averages is reached. The N is set using the
Avg Number key.
• Normal averaging: Normal (linear) averaging is always used
until the specified number of N averages is reached. When the
Measure key under Meas Control is set to Single, data
acquisition is stopped when the number of N averages is
reached, thus Avg Mode has no effect in the single
measurement mode.
• Exponential averaging: When Measure is set to Cont, data
acquisition will continue indefinitely. Exponential averaging is
used with a weighting factor of N (the displayed count of
averages stops at N). Exponential averaging weights new data
more heavily than old data, which allows tracking of
slow-changing signals. The weighting factor N is set using the
Avg Number key.
• Repeat averaging: When Measure is set to Cont, data
acquisition will continue indefinitely. After the number of N
averages is reached, all previous result data is cleared and the
average count displayed is set back to 1. This is equivalent to
being in Measure Single and pressing the Restart key each time
196
Chapter 5
Key Reference
Waveform (Time Domain) Keys
the single measurement finishes.
—
Avg Type - Accesses the menu of the following average types
only for making spectrum (frequency domain) and waveform
(time domain) measurements:
❏ Pwr Avg (RMS) - Executes the true power averaging which is
calculated by averaging the rms voltage. This is the most
accurate type.
❏ Log-Pwr Avg (Video) - Simulates the traditional spectrum
analyzer type of averaging by calculating the log of the
power. This type of averaging will underestimate the power
when the signal is noise-like.
❏ Voltage Avg - Executes voltage averaging.
❏ Maximum - Captures peak voltage data. Simulates the
traditional spectrum analyzer peak hold function.
❏ Minimum - Captures the minimum voltage data, similar to
the maximum function.
CAUTION
If triggering is set incorrectly, averaged signal results can approach nil.
“HW Average” is displayed when averaging is ON.
TIP
If your measurement results vary or provide unexpected values, try
turning Averaging OFF and execute single, non-averaged
measurements to check your triggering setup. Press Meas Control,
Measure, Single to make non-continuous measurements.
Key Reference
• Trig Source
Key path: Meas Setup, Trig Source
NOTE
Changing the selection in the Trig Source menu alters the trigger source
for the selected measurement only.
— Free Run (Immediate) - A trigger occurs at the time the data is
requested, completely asynchronous with the RF or IF signal.
— Video (Envlp) - An internal IF envelope trigger that occurs at the
absolute threshold level of the IF signal level.
— RF Burst (Wideband) - An internal wideband RF burst trigger that
has the automatic level control for burst signals. It triggers at the
level that is set relative to the peak RF signal (12 MHz
bandwidth) input level.
— Ext Front - Activates the front panel external trigger input (EXT
TRIGGER INPUT) port. The external signal must be between −5.00
and +5.00 V with 1 or 10 mV resolution.
Chapter 5
197
Key Reference
Waveform (Time Domain) Keys
— Ext Rear - Activates the rear-panel external trigger input
(TRIGGER IN) port. The external signal must be between −5.00 and
+5.00 V with 1 or 10 mV resolution.
— Frame - Uses the internal frame clock to generate a trigger signal.
The clock parameters are controlled under the Mode Setup key or
the measurement firmware, but not both. Refer to the specific
measurement section for details.
— Line - Sets the trigger to the internal line mode. Sweep triggers
occur at intervals synchronous to the line frequency. See the
specific measurement section for details.
• Restore Meas Defaults - Presets only the settings that are specific to
the selected measurement by pressing Meas Setup, More (1 of 2),
Restore Meas Defaults. This will set the measure setup parameters,
for the currently selected measurement only, to the factory defaults.
• (Narrowband) Advanced Accesses the menu to change the following
parameters.
CAUTION
The advanced features should be used only if you are familiar with their
operation. Changes from the default values may result in invalid data.
Key Reference
The Narrowband key label word is only present if you have Option
B7J and either Option 122 or 140 installed. Parameters that are
under the (Narrowband) Advanced key only affect the standard
narrow band IF path. The wideband IF advanced functions are
found under the Wideband Advanced key.
— Pre-ADC BPF - Toggles the pre-ADC bandpass filter function
between On or Off. The default setting is Off. The pre-ADC
bandpass filter is useful for rejecting nearby signals, so that
sensitivity within the span range can be improved by increasing
the ADC range gain.
— RBW Filter - Toggles the resolution bandwidth filter selection
between Flat and Gaussian. If set to Gaussian, the filter provides
more even time-domain response, particularly for “bursts”. If set
to Flat, the filter provides a flatter bandwidth but is less accurate
for “pulse responses”. A flat top filter also requires less memory
and allows longer data acquisition times. For most waveform
applications, the Gaussian filter is recommended. The resolution
bandwidth range is 10 Hz to 8 MHz using the Gaussian filter or
10 Hz to 10 MHz using the Flat top filter.
— ADC Range - Accesses the menu to select one of the ADC ranging
functions:
❏ Auto - Automatically adjusts the signal range for optimal
measurement results.
❏ AutoPeak - Continuously searches for the highest peak signal.
198
Chapter 5
Key Reference
Waveform (Time Domain) Keys
❏ AutoPeakLock - Adjusts the range for the highest peak signal it
identifies. It retains the range settings determined by that
peak signal, even when the peak signal is no longer present.
❏ Manual - Accesses the selection menu of values, −6 to +24 dB
for E4406A or None to +18 dB for PSA, to set the ADC range
level. Also note that manual ranging is best for CW signals.
— Data Packing - Selects Auto (the default) or the Short (16 bit),
Medium (24 bit) and Long (32 bit) methods of data packing. The
short, medium, and long methods are not compatible with all
settings and should not be used unless you are familiar with data
packing methods. Auto is the preferred choice.
❏ Auto - The data packing value most appropriate for current
instrument settings is selected automatically.
❏ Short (16 bit) - Select this to pack data every 16 bits.
❏ Medium (24 bit) - Select this to pack data every 24 bits.
❏ Long (32 bit) - Select this to pack data every 32 bits.
— ADC Dither - Toggles the ADC dither function between On and Off.
The default setting is Off. If set to On, the ADC dither refers to the
introduction of noise to the digitized steps of the analog-to-digital
converter, and results in better amplitude linearity and resolution
in low level signals. However, it also results in reduced dynamic
range by approximately 3 dB.
Table 5-4
Waveform (Time Domain) Measurement Defaults
Measurement Parameter
Factory Default Condition
Sweep Time
2.000 ms
Res BW
100.000 kHz
Averaging:
Avg Number
Avg Mode
Avg Type
10; Off
Exp
Pwr Avg (RMS)
Trig Source
Free Run (Immediate)
IF Path (requires Option B7J and
Option 122 or 140)
Narrow
Chapter 5
199
Key Reference
— Decimation - Toggles the decimation function between On and Off,
and to set the decimation value. Decimation allows longer
acquisition times for a given bandwidth by eliminating data
points. Long time captures can be limited by the instrument data
acquisition memory. Decimation numbers 1 to 4 describe the
factor by which the number of points are reduced. The default
setting is 1, which results in no data point reduction.
Key Reference
Waveform (Time Domain) Keys
Key Reference
Table 5-4
Waveform (Time Domain) Measurement Defaults
Measurement Parameter
Factory Default Condition
Wideband IF Gain (Option 122 or
140)
0.00 dB
Wideband Filtering (Option 122 or
140)
Filter Type
Filter Alpha
Filter BW
None
0.30
0.50
Signal Envelope View
SPAN X Scale - Scale/Div
AMPLITUDE Y Scale - Scale/Div
(for E4406A)
200.0 µs
10.00 dB
RF Envelope View
SPAN X Scale - Scale/Div
AMPLITUDE Y Scale - Scale/Div
(for PSA)
200.0 µs
10.00 dB
Linear Envelope View
SPAN X Scale - Scale/Div
Linear Envelope window:
AMPLITUDE Y Scale - Scale/Div
Phase window:
AMPLITUDE Y Scale - Scale/Div
(for E4406A Option B7C)
200.0 µs
100.0 mV
30.0 deg
I/Q Waveform View:
SPAN X Scale -Scale/Div
AMPLITUDE Y Scale - Scale/Div
200.0 µs
100.0 mV
I and Q Waveform View:
SPAN X Scale -Scale/Div
AMPLITUDE Y Scale - Scale/Div
(for E4406A Option B7C)
200.0 µs
100.0 mV
I/Q Polar View:
I/Q Scale/Div
I or Q Origin
(for E4406A)
100.0 mV
0.00 V
(Narrowband) Advanced
Pre-ADC BPF
Off
RBW Filter
Gaussian
ADC Range
Auto
Data Packing
Auto
ADC Dither
Off
Decimation
Off
Wideband Advanced (Option 122 or 140)
ADC Correction
200
On
Chapter 5
Key Reference
Waveform (Time Domain) Keys
Table 5-4
Waveform (Time Domain) Measurement Defaults
Measurement Parameter
Factory Default Condition
IF Flatness Corrections
On
Analog Filter
Auto, 80 MHz (Opt 122), 40 MHz
(Opt 140)
WB ADC Dither
On
Trigger Interpolation
On
Key Reference
Chapter 5
201
Key Reference
Waveform (Time Domain) Keys
View/Trace Key Menu
Key Path: View/Trace
• RF Envelope (for E4406A) or Signal Envelope (for PSA) - Displays a
time domain graph of the signal. The measured values for the mean
power and peak-to-mean power are shown in the text window.
Key Reference
Figure 5-9
Waveform Measurement - RF Envelope (Default View)
*Meas Setup:
Trace/View = RF Envelope,
Others = Factory default settings
*Input signal: cdma2000 Rev 8, SR1, 9 Channel
• Linear Envelope - (for E4406A Option B7C) Provides a combination
view of a linear signal envelope graph and a phase graph with linear
graticules. Use the Next Window and Zoom keys to select and enlarge
either graph.
202
Chapter 5
Key Reference
Waveform (Time Domain) Keys
Figure 5-10
Waveform Measurement - Linear Envelope View
*Meas Setup:
View/Trace = Linear Envelope View, GSM signal
Others = Factory defaults, except X and Y scales
Key Reference
Chapter 5
203
Key Reference
Waveform (Time Domain) Keys
Key Reference
• I/Q Waveform - Provides a view of the I and Q waveforms together on
the same graph in parameters of voltage versus time in linear scale.
Changes to sweep time or resolution bandwidth can affect data
acquisition.
Figure 5-11
Waveform Measurement - I/Q Waveform View
NOTE
For the widest spans, the I/Q Waveform window becomes just “ADC
time domain samples”, because the I/Q down-conversion is no longer in
effect.
NOTE
For the widest spans the I/Q Waveform window becomes just “ADC
time domain samples”, because the I/Q down-conversion is no longer in
effect.
204
Chapter 5
Key Reference
Waveform (Time Domain) Keys
• I and Q Waveform - (for E4406A Option B7C) Provides a combination
view of the I and Q signal waveform graphs in the linear scales.
Figure 5-12
Waveform Measurement - I and Q Waveform View
Key Reference
Chapter 5
205
Key Reference
Waveform (Time Domain) Keys
• I/Q Polar - (for E4406A) Provides a view of the I/Q signal in a polar
vector graph.
Figure 5-13
Waveform Measurement - I/Q Polar View
*Meas Setup:
View/Trace = I/Q Polar View,
Others = Factory defaults, except X and Y scales
Key Reference
*Input signal: cdma2000 Rev 8, SR1, 9 Channel
• Trace Display - Press this key to access the trace selection menu. The
currently selected trace type is shown on the Trace Display key.
— All - Views both the current trace and the average trace.
— Average - Views only the average trace (in blue color). See the
Meas Setup, Average keys to select different types of averaging.
— Current - Views only the trace (in yellow color) for the latest data
acquisition.
— I Trace - (for E4406A) Views only the I signal trace.
— Q Trace - (for E4406A) Views only the Q signal trace.
SPAN X Scale Key Menu
Key Path: Span X Scale
NOTE
The SPAN X Scale key accesses the menu to modify the horizontal
parameters common to the scaled windows for this measurement. Use
the Sweep Time key under the Meas Setup menu to control the
206
Chapter 5
Key Reference
Waveform (Time Domain) Keys
horizontal time span for this measurement:
• Scale/Div - Sets the horizontal scale by changing a time value per
division. The range is 1.0 ns to 1.000 s per division with 0.01 ns
resolution. The default setting is 200.0 µs per division. However,
since the Scale Coupling default is On, this value is automatically
determined by the measurement result. When you set a value
manually, Scale Coupling automatically changes to Off.
• Ref Value - Sets the reference value ranging from −1.0 to 10.0 s. The
default setting is 0.00 s. However, since the Scale Coupling default is
On, this value is automatically determined by the measurement
result. When you set a value manually, Scale Coupling automatically
changes to Off.
• Ref Position - Sets the reference position to either Left, Ctr (center) or
Right. The default setting is Left.
• Scale Coupling - Toggles the scale coupling function between On and
Off. The default setting is On. Upon pressing the Restart front-panel
key or Restart menu key under the Meas Control menu, this function
automatically determines the scale per division and reference values
based on the measurement results. When you set a value to either
Scale/Div or Ref Value manually, Scale Coupling automatically
changes to Off.
NOTE
For E4406A, if the I/Q Polar window is active in the I/Q Polar view, the
SPAN X Scale key accesses the following menu:
• I or Q Origin - Sets the reference value ranging from −250.00 to
250.00 V. The default setting is 0.00 V.
Chapter 5
207
Key Reference
• I/Q Scale/Div - Sets the vertical and horizontal scales by changing a
value per division. The range is 1.00 nV to 20.00 V per division. The
default setting is 100.0 mV.
Key Reference
Waveform (Time Domain) Keys
AMPLITUDE Y Scale Key Menu
Key Path: AMPLITUDE Y Scale
NOTE
If the RF Envelope (for PSA) or Signal Envelope (for E4406A) window
is active in the RF Envelope (for PSA) or Signal Envelope (for E4406A)
view, the AMPLITUDE Y Scale key accesses the following menu:
• Scale/Div - Sets the vertical scale by changing an amplitude value per
division. The range is 0.10 to 20.00 dB per division with 0.01 dB
resolution. The default setting is 10.00 dB per division. However,
since the Scale Coupling default is On, this value is automatically
determined by the measurement result. When you set a value
manually, Scale Coupling automatically changes to Off.
• Ref Value - Sets the reference value ranging from −250.00 to 250.00
dBm. The default setting is 0.00 dBm. However, since the Scale
Coupling default is On, this value is automatically determined by the
measurement result. When you set a value manually, Scale Coupling
automatically changes to Off.
Key Reference
• Ref Position - Sets the reference position to either Top, Ctr (center) or
Bot (bottom). The default setting is Top.
• Scale Coupling - Toggles the scale coupling function between On and
Off. The default setting is On. Upon pressing the Restart front-panel
key or Restart menu key under the Meas Control menu, this function
automatically determines the scale per division and reference values
based on the measurement results. When you set a value to either
Scale/Div or Ref Value manually, Scale Coupling automatically
changes to Off.
NOTE
For E4406A with Option B7C, if the Linear Envelope window is active
in the Linear Envelope view, the AMPLITUDE Y Scale key accesses the
following menu:
• Scale/Div - Sets the vertical scale by changing an amplitude value per
division. The range is 1.00 nV to 20.00 V per division. The default
setting is 100.0 mV per division. However, since the Scale Coupling
default is On, this value is automatically determined by the
measurement result. When you set a value manually, Scale Coupling
automatically changes to Off.
• Ref Value - Sets the reference value ranging from −250.00 to 250.00 V.
The default setting is 0.00 V. However, since the Scale Coupling
default is On, this value is automatically determined by the
measurement result. When you set a value manually, Scale Coupling
automatically changes to Off.
• Ref Position - Sets the reference position to either Top, Ctr (center) or
Bot (bottom). The default setting is Top.
208
Chapter 5
Key Reference
Waveform (Time Domain) Keys
• Scale Coupling - Toggles the scale coupling function between On and
Off. The default setting is On. Upon pressing the Restart front-panel
key or Restart menu key under the Meas Control menu, this function
automatically determines the scale per division and reference values
based on the measurement results. When you set a value to either
Scale/Div or Ref Value manually, Scale Coupling automatically
changes to Off.
NOTE
For E4406A with Option B7C, if the Phase window is active in the
Linear Envelope view, the AMPLITUDE Y Scale key accesses the menu to
modify the following parameters:
• Scale/Div - Sets the vertical scale by changing an amplitude value per
division. The range is 0.10 to 3600.0 deg per division. The default
setting is 30.00 deg. However, since the Scale Coupling default is On,
this value is automatically determined by the measurement result.
When you set a value manually, Scale Coupling automatically
changes to Off.
• Ref Value - Sets the reference value ranging from −36000.0 to 36000.0
deg. The default setting is 0.00 deg. However, since the Scale
Coupling default is On, this value is automatically determined by the
measurement result. When you set a value manually, Scale Coupling
automatically changes to Off.
• Ref Position - Sets the reference position to either Top, Ctr (center) or
Bot (bottom). The default setting is Ctr.
NOTE
If the I/Q Waveform window is active in the I/Q Waveform view
(or the I Waveform, or Q Waveform window is active in the I and Q
Waveform view for E4406A with Option B7C), the AMPLITUDE Y Scale
key accesses the menu to modify the following parameters:
• Scale/Div - Sets the vertical scale by changing an amplitude value per
division. The range is 1.00 nV to 20.00 V per division. The default
setting is 100.0 mV. However, since the Scale Coupling default is On,
this value is automatically determined by the measurement result.
When you set a value manually, Scale Coupling automatically
changes to Off.
• Ref Value - Sets the reference value ranging from −250.00 to 250.00 V.
The default setting is 0.00 V. However, since the Scale Coupling
Chapter 5
209
Key Reference
• Scale Coupling - Toggles the scale coupling function between On and
Off. The default setting is On. Upon pressing the Restart front-panel
key or Restart menu key under the Meas Control menu, this function
automatically determines the scale per division and reference values
based on the measurement results. When you set a value to either
Scale/Div or Ref Value manually, Scale Coupling automatically
changes to Off.
Key Reference
Waveform (Time Domain) Keys
default is On, this value is automatically determined by the
measurement result. When you set a value manually, Scale Coupling
automatically changes to Off.
• Ref Position - Sets the reference position to either Top, Ctr (center) or
Bot (bottom). The default setting is Ctr.
• Scale Coupling - Toggles the scale coupling function between On and
Off. The default setting is On. Upon pressing the Restart front-panel
key or Restart menu key under the Meas Control menu, this function
automatically determines the scale per division and reference values
based on the measurement results. When you set a value to either
Scale/Div or Ref Value manually, Scale Coupling automatically
changes to Off.
NOTE
For E4406A, if the I/Q Polar window is active in the I/Q Polar view, the
SPAN X Scale or AMPLITUDE Y Scale key accesses the menu to modify the
following parameters:
• I/Q Scale/Div - Sets the vertical and horizontal scales by changing a
value per division. The range is 1.00 nV to 20.00 V per division. The
default setting is 100.0 mV.
• I or Q Origin - Sets the reference value ranging from −250.00 to
250.00 V. The default setting is 0.00 V.
Display Key Menu
Key Reference
The Display key is not available for this measurement.
Marker Key Menu
Key Path: Marker
The Marker front-panel key accesses the menu to configure the markers.
• Select 1 2 3 4 - Activates up to four markers with the corresponding
numbers, respectively. The selected number is underlined and its
function is defined by pressing the Function key. The default is 1.
• Normal - Activates the selected marker to read the time position and
amplitude of the marker on the RF envelope or Signal Envelope
trace. Marker position is controlled by the RPG knob.
• Delta - Reads the differences in frequency and either time position or
amplitude, between the selected marker and the next marker.
• Function Off - Selects the marker function to be Band Power, Noise, or
Off. The default is Off. If set to Band Power, you need to select Delta.
• Trace - Places the selected marker on RF Envelope (for PSA), Signal
Envelope (for E4406A), or I/Q Waveform. Also, for E4406A with Option
210
Chapter 5
Key Reference
Waveform (Time Domain) Keys
B7C, you can place the marker on Linear Envelope, Linear Phase, I
Waveform, or Q Waveform.
• Off - Turns off the selected marker.
• Shape Diamond - Accesses the menu to define the selected marker
shape to be Diamond, Line, Square, or Cross. The default shape is
Diamond.
• Marker All Off - Turns off all of the markers.
Peak Search Key
Key Path: Search
The front panel Search key performs a peak search when pressed. A
marker will automatically be activated at the highest peak.
NOTE
In the Waveform measurement, the Mean Pwr (Entire Trace) value
plus the Pk-to-Mean value will sum to equal the current Max Pt. value
as shown in the data window below the RF Envelope or Signal Envelope
display. If you do a marker peak search (Search) with averaging turned
off, the marker will find the same maximum point. However, if you turn
averaging on, the Pk-to-Mean value will use the highest peak found for
any acquisition during averaging, while the marker peak will look for
the peak of the display, which is the result of n-averages. This will
usually result in differing values for the maximum point.
Key Reference
Chapter 5
211
Key Reference
Power Stat CCDF Keys
Power Stat CCDF Keys
NOTE
You must have selected Power Stat CCDF under the MEASURE menu to
access these menus.
Meas Setup Key Menu
Key Path: Meas Setup
• Meas BW - Allows you to set the measurement bandwidth according
to the channel bandwidth.
• Counts - Allows you to set the accumulated number of sampling
points for data acquisition. The range is 1.000 kpt (killo points) to
2.00000 Gpt (Giga points) with 1 kpt resolution. While this key is
activated, enter a value from the numeric keypad and terminate
with one of the unit keys shown.
• Meas Interval - Sets the number of data points that will be used as the
measurement interval.
Key Reference
• Wideband Setup - Allows you to configure the wideband hardware
path.
— Wideband IF Gain - Sets the gain for the wideband IF path in 2 dB
steps from −12 to +12 dB. Increasing the gain can increase the
amplitude of small signals as long as you don’t overdrive the
hardware. Wideband gain should usually be adjusted after
setting the input attenuation.
— Wideband Filtering - Accesses the keys to configure the optional
channel filter. The default is no filtering.
❏ Filter Type - Selects None for no filtering, or Raised Cosine, RRC
(root-raised cosine), Nyquist, Root Nyquist, or Gaussian.
❏ Filter Alpha - Specifies the channel filter alpha for cosine and
Nyquist filters applied within the wideband digital IF. This
filter alpha is the ratio of transition bandwidth divided by 2, to
filter bandwidth. Pressing Filter Alpha allows you to enter this
numeric value.
❏ Filter BW - Specifies the bandwidth of the filter with respect to
the sample rate (i.e. BW/sample rate) of channel filter.
— Sample Rate - Sets the sampling rate. This parameter is coupled
with the Meas BW. Changes to either Sample Rate or Meas BW will
affect both parameters.
— Block Size - Shows the number of samples within one Meas
Interval. This key is for information only. It is always grayed out.
212
Chapter 5
Key Reference
Power Stat CCDF Keys
— Wideband Advanced - Accesses the advanced settings for the
wideband IF hardware path.
NOTE
Parameters under the Wideband Advanced key seldom need to be
changed. Any changes from the default advanced values may result in
invalid measurement data.
❏ ADC Corr - Turning corrections on performs an ADC calibration
to reduce the spectral image and applies the corrections.
❏ IF Flat Corr - Turns IF flatness corrections on and off in all
wideband IF measurements.
❏ WB ADC Dither Toggles the wideband dither signal on or off.
The “ADC dither” refers to the introduction of noise to the
digitized steps of the analog-to-digital converter; the result is
an improvement in amplitude accuracy. Use of the ADC dither,
however, reduces the dynamic range by approximately 3 dB. It
should only be turned off when measuring a noise-like signal
and the 1 to 2 dB extra dynamic range is needed. The
wideband dither control does not affect the ADC dither in the
narrowband IF path.
❏ Trig Interp - This key toggles the Trigger interpolation function
on or off.
• Trigger
Key path: Meas Setup, Trig Source
Changing the selection in the Trig Source menu alters the trigger source
for the selected measurement only.
— RF Burst) — Video (Envlp) - An internal IF envelope trigger that occurs at the
absolute threshold level of the signal passed by the IF signal
level.
— Ext Front - Activates the front panel external trigger input (EXT
TRIGGER INPUT) port. The external signal must be between −5.00
and +5.00 V with 1 or 10 mV resolution.
— Ext Rear - Activates the rear-panel external trigger input
(TRIGGER IN) port. The external signal must be between −5.00 and
+5.00 V with 1 or 10 mV resolution.
• Trig Holdoff - Sets the period of time before the next trigger can occur.
The range is 0.000 µs to 500.0 ms with 1 µs resolution.
For Option 122 or 140: When the wideband path is selected, the
trigger holdoff is the minimum time that must occur between
trigger events before a trigger is accepted. For example, a rising
Chapter 5
213
Key Reference
NOTE
Key Reference
Power Stat CCDF Keys
edge external trigger with a 10 ms holdoff will not trigger until at
least 10 ms has passed during which no rising edges have
occurred.
This Option 123 definition changes slightly for negative slope
video triggers. For this case the instrument waits until it sees a
time interval following the trigger event that is free of additional
trigger events. This lets you trigger on the falling edge of a burst
that may contain trigger events.
• Auto Trig - Specifies a time for a trigger timeout and toggle the auto
trigger function between On and Off. The range is 1.000 ms to 1.000
ks with 1 µs resolution. If no trigger occurs by the specified time, a
trigger is automatically generated.
• Frame Timer - Accesses the menu to manually control the frame
timer:
— Period - Sets the period of the frame clock. The range is 0.000 ns
to 559.0000 ms with 1 ns resolution.
— Offset - Sets the offset of the frame clock. The range is 0.000 to
10.00 s with 100 ns resolution over 1.000 µs range.
— Reset Offset Display - Displays the measurement without any
offset of the frame clock.
— Sync Source - Accesses the menu to select one of the sources to be
synchronized with.
Key Reference
For Option 122 or 140: The frame trigger will wait for, and
sync with, the first external trigger that is received after sync
is turned off. After the sync is received the frame trigger stays
locked to that event, ignoring any later triggers. The
instrument will only resync if the measurement settings are
changed or if an alignment occurs.
❏ Off - Turns the synchronizing source off for asynchronous tests.
❏ Ext Front - Selects the external input signal from the front
panel input port as the synchronizing source. With Option 122
or 140, you can use the external front trigger setup menu to
change the trigger level or delay.
• Ext Rear - Selects the external input signal from the rear
panel input port as the synchronizing source. With Option
122 or 140, you can use the external rear trigger setup
214
Chapter 5
Key Reference
Power Stat CCDF Keys
menu to change the trigger level or delay.
Trigger Default Settings
RF Burst:
Delay
Peak Level
Slope
0.000 µs
−6.00 dB
Pos
Video (Envlp):
Delay
Level
Slope
0.000 µs
−6.00 dBm
Pos
Ext Front:
Delay
Level
Slope
0.000 µs
2.00 V
Pos
Ext Rear:
Delay
Level
Slope
0.000 µs
2.00 V
Pos
Trig Holdoff
0.000 ms
Auto Trig
100.0 ms; Off
Frame Timer:
Period
Offset
Sync Source
26.666667 ms
0.000 ms
Off
Key Reference
Chapter 5
215
Key Reference
Key Reference
Power Stat CCDF Keys
216
Chapter 5
6
Concepts
217
Concepts
This chapter provides details about how the various measurements are
performed by the instrument.
Concepts
Adjacent Channel Power (ACP) Measurement Concepts
Adjacent Channel Power (ACP) Measurement
Concepts
Purpose
Adjacent Channel Power (ACP) is the power contained in a specified
frequency channel bandwidth relative to the total carrier power. It may
also be expressed as a ratio of power spectral densities between the
carrier and the specified offset frequency band.
As a composite measurement of out-of-channel emissions, ACP
combines both in-band and out-of-band specifications to provide useful
figures-of-merit for spectral regrowth and emissions produced by
components and circuit blocks without the rigor of performing a full
spectrum emissions mask measurement.
To maintain a quality call by avoiding channel interference, it is
important to measure and reduce any adjacent channel leakage power
transmitted from a mobile phone. The characteristics of adjacent
channel leakage power are mainly determined by the transmitter
design, particularly the low-pass filter.
Measurement Method
This ACP measurement analyzes the total power levels within the
defined carrier bandwidth and at given frequency offsets on both sides
of the carrier frequency. This measurement requires the user to specify
measurement bandwidths of the carrier channel and each of the offset
frequency pairs up to 5. Each pair may be defined with unique
measurement bandwidths.
Concepts
It uses an integration bandwidth (IBW) method that performs a time
domain data acquisition and applies FFT to get a frequency domain
trace. In this process, the channel integration bandwidth is analyzed
using the automatically defined resolution bandwidth (RBW), which is
much narrower than the channel bandwidth. The measurement
computes an average power of the channel over a specified number of
data acquisitions, automatically compensating for resolution
bandwidth and noise bandwidth.
If Total Pwr Ref is selected as the measurement type, the results are
displayed as relative power in dBc and as absolute power in dBm. If
PSD Ref (Power Spectral Density Reference) is selected, the results are
displayed as relative power in dB, and as absolute power in dBm/Hz.
218
Chapter 6
Concepts
Channel Power Measurement Concepts
Channel Power Measurement Concepts
Purpose
The Channel Power measurement is a common test used in the wireless
industry to measure the total transmitted power of a radio within a
defined frequency channel. This procedure measures the total power
within the defined channel. This measurement is applied to design,
characterize, evaluate, and verify transmitters and their components or
devices for base stations and mobile stations.
Measurement Method
The Channel Power measurement reports the total transmitted power
within the channel bandwidth, 1.23000 MHz. The measurement
acquires a number of points representing the input signal in the time
domain. It transforms this information into the frequency domain using
FFT and then calculates the channel power. The effective resolution
bandwidth of the frequency domain trace is proportional to the number
of points acquired for FFT. The fastest FFT process is achieved using a
number of acquired points that is a power of 2 (for example: 64, 128,
512).
Since the measurement is optimized for speed and accuracy, you are
permitted to change only the number of acquired data points in powers
of 2, not the actual resolution bandwidth which is shown in gray.
However, if absolute sweep time is required, it can be changed to the
user’s specific value at the expense of reduced speed. At no time will
both sweep time and data points be set to manual because of conflicting
parameter settings. This flexibility is available through the Advanced
menu of the channel power measurement.
To improve repeatability, you can increase either the number of
averages or the number of data points with longer time record length.
The channel power graph is shown in the graph window, while the
absolute channel power in dBm and the mean power spectral density in
dBm/Hz are shown in the text window.
For E4406A Option B7C, this measurement is available for use with
either the RF input or baseband I/Q inputs. For detailed operation, see
the “Using Option B7C Baseband I/Q Inputs” section.
Concepts
Chapter 6
219
Concepts
Power Stat CCDF Measurement Concepts
Power Stat CCDF Measurement Concepts
Purpose
Many of the digitally modulated signals now look noise-like in the time
and frequency domain. This means that statistical measurements of the
signals can be a useful characterization. Power Complementary
Cumulative Distribution Function (CCDF) curves characterize the
higher level power statistics of a digitally modulated signal. The curves
can be useful in determining design parameters for digital
communications systems.
The power statistics CCDF measurement can be affected by many
factors. For example, modulation filtering, modulation format,
combining the multiple signals at different frequencies, number of
active codes, and correlation between symbols on different codes with
spread spectrum systems will all affect measurement results. These
factors are all related to modulation and signal parameters. External
factors such as signal compression and expansion by nonlinear
components, group delay distortion from filtering, and power control
within the observation interval also affect the measurement.
Both the amplifier designer and the system integrator must make sure
that the PA (and other components) can handle the PAR that the signal
exhibits for the different data rates, while maintaining a good ACL
performance. You can use the complementary cumulative distribution
function to help you with this job.
The complementary cumulative distribution function (CCDF) fully
characterizes the power statistics of a signal [15].
CCDF curves can help you in several situations:
• To determine the headroom required when designing a component
[15].
Concepts
• To confirm the power statistics of a given signal or stimulus. CCDF
curves allow you to verify if the stimulus signal provided by another
design team is adequate. For example, RF designers can use CCDF
curves to verify that the signal provided by the digital signal
processing (DSP) section is realistic.
• To confirm that a component design is adequate or to troubleshoot
your subsystem or system design, you can make CCDF
measurements at several points of a system. For example, if the
ACLR of a transmitter is too high, you can make CCDF
measurements at the input and output of the PA. If the PA design is
220
Chapter 6
Concepts
Power Stat CCDF Measurement Concepts
correct, the curves will coincide. If the PA compresses the signal, the
PAR of the signal is lower at the output of the PA.
Measurement Method
The power measured in power statistics CCDF curves is actually
instantaneous envelope power defined by the equation:
2
2
P = ( I + Q ) ⁄ Z0
(where I and Q are the quadrature voltage components of the waveform
and Zo is the characteristic impedance).
A CCDF curve is defined by how much time the waveform spends at or
above a given power level. The percent of time the signal spends at or
above the level defines the probability for that particular power level.
For capturing a lower probability down to 0.0001%, this measurement
is made in the single mode by setting Measure under Meas Control to
Single. To make the power statistics CCDF measurement, the
instrument uses digital signal processing (DSP) to sample the input
signal in the channel bandwidth.
The Gaussian distribution line as the band-limited Gaussian noise
CCDF reference line, the user-definable reference trace, and the
currently measured trace can be displayed on a semi-log graph. If the
currently measured trace is above the user reference trace, it means
that the higher peak power levels against the average power are
included in the input signal.
For E4406A, Option B7C, in addition to RF input signals, baseband I/Q
input signals can be measured using the Option B7C “Baseband I/Q
Inputs”.
Concepts
Chapter 6
221
Concepts
Spectrum (Frequency Domain) Measurement Concepts
Spectrum (Frequency Domain) Measurement
Concepts
Purpose
The spectrum measurement provides spectrum analysis capability for
the instrument. The control of the measurement was designed to be
familiar to those who are accustomed to using swept spectrum
analyzers.
This measurement is FFT (Fast Fourier Transform) based. The
FFT-specific parameters are located in the Advanced menu. Also
available under basic mode spectrum measurements is an
I/Q window, which shows the I and Q signal waveforms in parameters
of voltage versus time. The advantage of having an I/Q view available
while in the spectrum measurement is that it allows you to view
complex components of the same signal without changing settings or
measurements.
Measurement Method
The measurement uses digital signal processing to sample the input
signal and convert it to the frequency domain. With the instrument
tuned to a fixed center frequency, samples are digitized at a high rate,
converted to I and Q components with DSP hardware, and then
converted to the frequency domain with FFT software.
For E4406A Option B7C, this measurement is available for both the RF
input and baseband I/Q inputs. For details on Baseband I/Q operation
see the section on “Using Option B7C Baseband I/Q Inputs”.
Troubleshooting Hints
Concepts
Changes made by the user to advanced spectrum settings, particularly
to ADC range settings, can inadvertently result in spectrum
measurements that are invalid and cause error messages to appear.
Care needs to be taken when using advanced features.
222
Chapter 6
Concepts
Waveform (Time Domain) Measurement Concepts
Waveform (Time Domain) Measurement
Concepts
Purpose
The waveform measurement is a generic measurement for viewing the
input signal waveforms in the time domain. This measurement is how
the instrument performs the zero span functionality found in
traditional spectrum analyzers.
Basic mode waveform measurement data may be displayed using either
a Signal Envelope window, or an I/Q window which shows the I and Q
signal waveforms in parameters of voltage versus time. The advantage
of having an I/Q view available while making a waveform measurement
is that it allows you to view complex components of the same signal
without changing settings or measurements.
For E4406A, an I/Q Polar display is also available to view the I and Q
waveforms in a polar plot. This display shows the instantaneous
relationship between the I and Q waveform voltages.
The waveform measurement can be used to perform general purpose
power measurements in the time domain with excellent accuracy.
Measurement Method
The instrument makes repeated power measurements at a set
frequency, similar to the way a swept-tuned spectrum analyzer makes
zero span measurements. The input analog signal is converted to a
digital signal, which then is processed into a representation of a
waveform measurement. The measurement relies on a high rate of
sampling to create an accurate representation of a time domain signal.
For E4406A with Option B7C, this measurement is available for use
with both the RF input and baseband I/Q inputs. For details on
Baseband I/Q operation see the section on “Using Option B7C Baseband
I/Q Inputs”.
Concepts
Chapter 6
223
Concepts
Baseband I/Q Inputs (Option B7C) Measurement Concepts
Baseband I/Q Inputs (Option B7C)
Measurement Concepts
The E4406A VSA Option B7C Baseband I/Q Inputs provides the ability
to analyze baseband I/Q signal characteristics of mobile and base
station transmitters. This option may be used only in conjunction with
the following personalities:
• Basic mode (available in all VSA Series Transmitter Testers)
• Option BAF W-CDMA Measurement Personality
• Option B78 cdma2000 Measurement Personality
• Option 202 GSM with EDGE
• Option 252 GSM to GSM with EDGE upgrade
What are Baseband I/Q Inputs?
Option B7C consists of a Baseband Input module, four 50 Ω BNC
connectors, and internal cabling. The four BNC connectors are grouped
into pairs at the upper left corner of the front panel. The upper two
connectors labeled “I” and “Q” are the “unbalanced” inputs.
In practice, an unbalanced or “single-ended” baseband measurement of
an I or Q signal is made using a probe connected to the I or Q connector.
A simultaneous I/Q unbalanced single-ended measurement may be
made using two probes connected to the I and Q input connectors.
If “balanced” signals are available, they may be used to make a more
accurate measurement. Balanced signals are signals present in two
separate conductors, are symmetrical about ground, and are opposite in
polarity, or out of phase by 180 degrees.
Concepts
Measurements using balanced signals can have a higher signal to noise
ratio resulting in improving accuracy. Noise coupled into each
conductor equally in a “common mode” to both signals may be separated
from the signal. The measure of this separation is “common-mode
rejection”.
To make a balanced measurement, the lower two connectors labeled “I”
and “Q” are used in conjunction with the I and Q inputs. The terms
“I-bar” and “Q-bar” may be applied to the signals, as well as the inputs
themselves. Probes (customer provided) must be used to input balanced
baseband I/Q signals. This may be referred to as a balanced
measurement.
Balanced baseband measurements are made using the I and I
connectors for I only signal measurements, while the Q and Q
connectors are used for a Q only signal measurement. Balanced
224
Chapter 6
Concepts
Baseband I/Q Inputs (Option B7C) Measurement Concepts
measurements of I/Q require differential probe connections to all four
input connectors. For details of probe selection and use, refer to
“Selecting Input Probes for Baseband Measurements” on page 225.
What are Baseband I/Q Signals?
In transmitters, the term baseband I/Q refers to signals that are the
fundamental products of individual I/Q modulators, before the I and Q
component signals are combined, and before up conversion to IF or RF
frequencies.
In receivers, baseband I/Q analysis may be used to test the I and Q
products of I/Q demodulators, after an RF signal has been down
converted and demodulated.
Why Make Measurements at Baseband?
Baseband I/Q measurements are a valuable means of making
qualitative analyses of the following operating characteristics:
• I/Q signal layer access for performing format-specific demodulation
measurements (e.g. CDMA, GSM, W-CDMA):
• Modulation accuracy – i.e. I/Q plane metrics
— rho
— error vector magnitude; rms, peak, or 95%
— carrier feed-through
— frequency error
— magnitude and phase errors
• Code-domain analysis (including code-specific metrics)
2
• CCDF of I + Q
2
• Single sideband (SSB) metrics for assessing output quality
• Basic analysis of I and Q signals in isolation including: DC content,
rms and peak to peak levels, CCDF of each channel
Selecting Input Probes for Baseband Measurements
The selection of baseband measurement probe(s) and measurement
Chapter 6
225
Concepts
Comparisons of measurements made at baseband and RF frequencies
produced by the same device are especially revealing. Once signal
integrity is verified at baseband, impairments can be traced to specific
stages of up conversion, amplification, or filtering by RF analysis.
Likewise, impairments to signal quality that are apparent at RF
frequencies may be traceable to baseband using baseband analysis.
Concepts
Baseband I/Q Inputs (Option B7C) Measurement Concepts
method is primarily dependent on the location of the measurement
point in the circuit. The probe must sample voltages without imposing
an inappropriate load on the circuit.
The following measurement methods may be used with baseband I/Q
inputs:
• 50 Ω Unbalanced - This is the measurement method of choice if
single-ended or unbalanced baseband I and/or Q signals are
available in 50 Ω coaxial transmission lines and are terminated in a
coaxial connectors. Adapters necessary to convert to a 50 Ω
BNC-type male connector must be of 50 Ω impedance.
The methods are as follows:
— I only measurement using one single-ended probe connected to
the I input connector (available in the Basic mode)
— Q only measurement using one single-ended probe connected to
the Q input connector (available in the Basic mode)
— I/Q measurement using two single-ended probes connected to the
I and Q input connectors
• 600 Ω Balanced - This is the measurement method of choice if
balanced baseband signals having a 600 Ω impedance are available.
The methods are as follows:
— I only measurement using one differential probe or two
single-ended probes connected to the I and I inputs (available in
the Basic mode)
— Q only measurement using one differential probe or two
single-ended probes connected to the Q and Q inputs (available in
the Basic mode)
— I/Q measurement using two differential probes or four
single-ended probes connected to the I, Q, I, and Q input
connectors
• 1 MΩ Unbalanced - High input impedance is the measurement
method of choice if single-ended or unbalanced baseband signals to
be measured lie in a trace on a circuit board and are sensitive to
loading by the probe. This is the default input connector setting.
Concepts
When making 1 MΩ measurements, the reference input impedance
may be adjusted. 1 MΩ unbalanced measurements may be made as
follows:
— I only measurement using one single-ended probe connected to
the I input connector (available in the Basic mode)
— Q only measurement using one single-ended probe connected to
the Q input connector (available in the Basic mode)
226
Chapter 6
Concepts
Baseband I/Q Inputs (Option B7C) Measurement Concepts
— I/Q measurement using two single-ended probes connected to the
I and Q input connectors
• 1 MΩ Balanced - High input impedance measurements may also be
made if differential or balanced signals are available. 1 MΩ balanced
measurements may be made as follows:
— I only measurement using one differential probe or two
single-ended probes connected to the I and I inputs (available in
the Basic mode)
— Q only measurement using one differential probe or two
single-ended probes connected to the Q and Q inputs (available in
the Basic mode)
— I/Q measurement using two differential probes or four
single-ended probes connected to the I, Q, I, and Q input
connectors
This is the measurement method of choice if differential or balanced
baseband signals to be measured lie in a trace on a circuit board and
are sensitive to loading by the probe. When making 1 MΩ
measurements, the reference input impedance may be adjusted.
Concepts
Chapter 6
227
Concepts
Baseband I/Q Inputs (Option B7C) Measurement Concepts
The following table lists the probes currently available from Agilent,
which are suitable for use under various measurement conditions:
Table 6-1
Agilent Probes - Balanced and Unbalanced
Probe Type
Description
Unbalanced
(single-ended)
1144A 800 MHz Active Probeabc
54701A 2.5 GHz Active Probebcd
1145A 750 MHz 2-Channel Active Probeabc
85024A High Frequency Probebe
41800A Active Probebf
10020A Resistive Divider Probebc
54006A 6 GHz Passive Divider Probeg
Balanced
(differential)
1141A 200 MHz Active Differential Probeabc
N1025A 1 GHz Active Differential Probebh
a. Not compatible with 3-wire power interface. Needs 1142A
power supply. For two channels, you will need either two
1142A power supplies or one 1142A power supply and one
01144-61604 1-input, two-output adapter cable.
b. Two probes needed to cover both I and Q inputs.
c. Output connector is BNC-type.
d. Not compatible with 3-wire power interface. Requires use of
1143A power supply that can power two 54701A probes.
e. 85024A bandwidth is 300 kHz to 3 GHz. Output connector is
N-type. Power is 3-wire connector (+15 V, −12.6 V, ground).
f. 41800A bandwidth is 5 Hz to 500 MHz. Output connector is
N-type. Power is 3-wire connector (+15 V, −12.6 V, ground).
g. 54006A output connector is 3.5 mm
h. 3.5 mm output connector, requires ±15 V supply.
Refer to the current Agilent data sheet for each probe for specific
information regarding frequency of operation and power supply
requirements.
The E4406A Transmitter Tester provides one “three-wire” probe power
connector on the front panel. Typically, it can energize one probe. If you
plan on operating more than one probe, make sure you provide
sufficient external power sources as required.
Concepts
Baseband I/Q Measurement Views
Measurement result views made in the Basic mode, or by other
compatible optional personalities, are available for baseband signals if
they relate to the nature of the signal itself. Many measurements which
relate to the characteristics baseband I and Q signals have when mixed
and up converted to signals in the RF spectrum can be made as well.
However, measurements which relate to the characteristics of an up
228
Chapter 6
Concepts
Baseband I/Q Inputs (Option B7C) Measurement Concepts
converted signal that lie beyond the bandwidth available to the
Baseband I/Q Input circuits can not be measured (the limits are up to
5 MHz bandwidth for individual I and Q signals, and up to 10 MHz for
composite I/Q signals).
Some measurement views are appropriate for use with both RF and
baseband I/Q signals without any modification, while other views must
be altered. Some examples of measurements with identical results
views are QPSK EVM, Code Domain, and CCDF. For Spectrum
measurements, identical views include the I and Q Waveform view and
the I/Q Polar view. For Waveform measurements, identical views
include the I/Q Waveform view, the Signal Envelope view, and the I/Q
Polar view.
At RF frequencies, power measurements are conventionally displayed
on a logarithmic vertical scale in dBm units, whereas measurements of
baseband signals using Baseband I/Q inputs may be conveniently
displayed as voltage using a linear vertical scale as well as a log scale.
Spectrum Views and 0 Hz Center Frequency
Some views must be altered to account for the fundamental difference
between RF and baseband I/Q signals. For Spectrum measurements of
I/Q signals this includes using a center frequency of 0 Hz for Spectrum
views and the Spectrum Linear view. Occupied Bandwidth and Channel
Power results are also displayed using a center frequency of 0 Hz.
The center frequency of baseband I/Q Spectrum displays is 0 Hz.
Frequencies higher than 0 Hz are displayed as “positive” and those
below 0 Hz are “negative”. The “negative” portion of a multi-channel
baseband signal below 0 Hz corresponds to the portion of the signal that
would lie below the carrier center frequency when it is up converted, if
no spectral inversion occurs. As 0 Hz is a fixed center frequency, the
FREQUENCY Channel front-panel key has no active menu for baseband
I/Q Spectrum measurements.
I only and Q only Spectrum views are conventional, displayed with 0 Hz
at the left margin of the vertical axis. When up converted or multiplied,
an I only or Q only signal could ultimately lie above or below the carrier
center frequency, but in either case it will only occupy half the
bandwidth. As 0 Hz is a fixed start frequency, the FREQUENCY Channel
front panel key has no active menu keys. Use Span to change horizontal
scale. The center frequency is displayed as half the current Span.
Waveform Views for Baseband I/Q Inputs
Chapter 6
229
Concepts
For Waveform measurements, two new displays are available
exclusively for baseband I/Q input signals; the I and Q Waveform view,
which separates the individual I and Q traces, and the I/Q Polar view.
Since the horizontal axis for Waveform measurements is Time, the
FREQUENCY Channel front-panel key has no active menu for baseband
I/Q Waveform measurements. Use Span to change horizontal scale. A
Concepts
Baseband I/Q Inputs (Option B7C) Measurement Concepts
Linear Envelope view is also available to display baseband signals that
employs linear voltage units on the vertical axis.
Waveform Signal Envelope Views of I only or Q only
The I and Q Waveform of an I/Q signal is very different from the
complex signal displayed in the Waveform Signal Envelope view. That
is because the Signal Envelope is a product of both the I and Q
modulation waveforms.
However, an I and Q Waveform measurement of an I only or Q only
signal is exactly the same signal displayed in the Waveform Signal
Envelope view. That is because an I only or Q only waveform
determines the I only or Q only signal envelope. Thus, the Waveform
Signal Envelope view can be used to measure an I only or Q only
waveform directly.
Comparing RF and Baseband I/Q Measurement Views
The following table compares the measurement views for RF inputs and
baseband I/Q inputs.
Concepts
Table 6-2
RF vs. Baseband I/Q Input Measurement Views by Measurement
Measurement
Views for RF Input
Measurements
Views for Baseband I/Q
Inputs Measurements
Mods to RF View
for Baseband I/Q
Inputs
Channel Power
Channel Power
Channel Power
Center Freq = 0 Hz
ACP
FFT, Fast Bar Graph,
Spectrum
Measurement
Not Available
n/a
Power Stat
CCDF
CCDF
CCDF
none
Spectrum
(Freq Domain)
Spectrum
Spectrum Linear
I and Q Waveform
I/Q Polar
Spectrum
Spectrum Linear
I and Q Waveform
I/Q Polar
Center Freq = 0 Hz
(Spectrum Views)
Y axis = V, dBm
(Spectrum Linear)
Waveform
(Time Domain)
Signal Envelope
I/Q Waveform
I/Q Polar
Signal Envelope
I/Q Waveform
I/Q Polar
Linear Envelope
I and Q Waveform
Y axis = V, dBm
(Linear Envelope)
Results screens for the above measurements unique to baseband I/Q
inputs are shown in the section “Using Option B7C Baseband I/Q
Inputs” on page 136.
230
Chapter 6
Concepts
Other Sources of Measurement Information
Other Sources of Measurement Information
Additional measurement application information is available through
your local Agilent Technologies sales and service office. The following
application notes treat digital communications measurements in much
greater detail than discussed in this measurement guide.
• Application Note 1298
Digital Modulation in Communications Systems - An Introduction
Agilent part number 5965-7160E
• Application Note
Characterizing Digitally Modulated Signals with CCDF Curves
Agilent part number 5968-5858E
Instrument Updates at www.agilent.com
These web locations can be used to access the latest information about
the instrument, including the latest firmware version.
http://www.agilent.com/find/vsa
Concepts
Chapter 6
231
Concepts
Concepts
Other Sources of Measurement Information
232
Chapter 6
If You Have a Problem
7
If You Have a Problem
This chapter will help you identify the causes of some problems you
may encounter, offers warranty information, and provides instructions
for returning your instrument to Agilent Technologies.
For information about error messages and functional tests, see the
Instrument Messages and Functional Tests document.
233
If You Have a Problem
If You Have a Problem
Problem Symptoms and Solutions
Problem Symptoms and Solutions
The following section describes some transmitter tester problem
symptoms and possible solutions to those problems. They include:
“Key or Feature Does Not Appear in Menu” on page 234
“Frequency Unlock or External Reference Missing - Error Messages”
on page 235
“LAN External Loopback Test Failed - Error Message” on page 235
“Instrument Fails Alignment - Error Message” on page 235
“Measurement Keys Do Not Appear after Pressing the Mode Key” on
page 236
“Instrument Power-On Problem” on page 236
“LAN Communication Problem” on page 236
“Instrument Keyboard is Locked” on page 236
Key or Feature Does Not Appear in Menu
Symptom: You are unable to locate a key for a feature you want to use
in a particular measurement.
Solution 1: Many features are available only for making specific
measurements, and do not apply to other measurements. Verify that
the feature you are seeking is available for that particular
measurement by examining the key access table on page 57. Notes in
the key access path column indicate whether a feature can only be used
with a particular measurement. You can also review the section which
documents the measurement you are using, and indicates which
features apply to that measurement.
Solution 2: Some features are only available when using a specific
mode. Review the section describing the mode to verify that a feature is
available.
Solution 3: Some features of the transmitter tester are not yet
available and will be implemented with a future firmware release. For
an update on the status of firmware upgrades you can check the
following URL: http://www.agilent.com/find/vsa/.
234
Chapter 7
Frequency Unlock or External Reference Missing Error Messages
Symptom: A frequency unlock error message, or an external reference
missing error message, appears in the annunciator bar just above the
data window.
Solution 1: The red Ext Ref message indicates that the external
reference is not locked. The external reference can be any frequency
between 1 and 30 MHz. If you have connected an external reference you
must enter it’s frequency into the instrument. The value you entered
must correspond to the external reference that is in use, or it will
generate the error. Note that the value entered for the external
reference frequency will persist, even after the instrument has been
powered off and then on.
A green Ext Ref message indicates that the instrument is using an
external reference and it is properly locked.
Solution 2: If you want to use the internal reference signal, toggle the
Freq Ref key to the Int (internal) setting.
LAN External Loopback Test Failed - Error Message
Symptom: During booting the instrument you see a message which
reads LAN external loopback test failed.
Solution: This message indicates that no LAN cable is connected to the
instrument. You can ignore this message if you don’t want to use the
LAN.
Instrument Fails Alignment - Error Message
Symptom: An error message indicates that the instrument has failed
alignment. This message appears either at power on during the
self-alignment, or when the Align All Now key is pressed.
Solution: These alignments will fail if an external 50 MHz signal, at a
power level greater than 0 dB, is connected to the RF input of the
transmitter tester. Remove the 50 MHz signal to fix this problem.
Chapter 7
235
If You Have a Problem
If You Have a Problem
Problem Symptoms and Solutions
If You Have a Problem
If You Have a Problem
Problem Symptoms and Solutions
Measurement Keys Do Not Appear after Pressing the
Mode Key
Symptom: After pressing the MODE key, you have selected a particular
mode (like Basic, Service, or one of the measurement personalities), but
the menu for the mode you have selected does not appear on the menu
keys.
Solution: If you were already in the mode that you selected, you must
press the MEASURE key to display the available measurements.
Instrument Power-On Problem
Symptom: The instrument will not power-on. The instrument is
plugged in, but the green LED above the front panel power switch is not
on. The yellow standby LED may be flashing or may be extinguished.
Something appears to be causing the instrument power supply to shut
down.
Solution: An external device or internal assembly is causing the
instrument to shut down, or the power supply may be in thermal
shutdown. Inspect the instrument to ensure that it is receiving
adequate air flow. Disconnect all devices from the rear panel and
remove anything connected to the front panel probe power jack. If after
powering the instrument off, the instrument powers on, determine
which device caused the problem.
LAN Communication Problem
Symptom: You cannot communicate with the instrument over the
LAN.
Solution: Make sure the correct IP address, subnet mask, and host
name are stored in the instrument. Press System, Config I/O, then read
the IP address, subnet mask and host name which are shown on the
corresponding menu key labels. The default subnet mask of 255.255.0.0
should be sufficient for most closed network applications. If the Restore
Sys Defaults key has been used recently, the IP address, subnet mask,
and host name will have been reset to factory defaults. (The IP address
is changed to 10.10.10.10., the subnet mask is changed to
255.255.0.0., and the host name is set to VSA.)
Instrument Keyboard is Locked
Symptom: The keyboard is locked and does not respond to attempts to
activate features.
Solution: A programmer can lock the keyboard remotely using the
SCPI KLOCk command. You can confirm if this is the reason the
keyboard is locked by examining the annunciator bar; a message saying
Klock will appear if this command has been executed.
236
Chapter 7
Warranty Information
Warranty
This Agilent Technologies instrument product is warranted against
defects in material and workmanship for a period of three years from
date of shipment. During the warranty period, Agilent Technologies
will, at its option, either repair or replace products that prove to be
defective.
For warranty service or repair, this product must be returned to a
service facility designated by Agilent Technologies. Buyer shall prepay
shipping charges to Agilent Technologies and Agilent Technologies shall
pay shipping charges to return the product to Buyer. However, Buyer
shall pay all shipping charges, duties, and taxes for products returned
to Agilent Technologies from another country.
Agilent Technologies warrants that its software and firmware
designated by Agilent Technologies for use with an instrument will
execute its programming instructions when properly installed on that
instrument. Agilent Technologies does not warrant that the operation of
the instrument, or software, or firmware will be uninterrupted or
error-free.
LIMITATION OF WARRANTY
The foregoing warranty shall not apply to defects resulting from
improper or inadequate maintenance by Buyer, Buyer-supplied
software or interfacing, unauthorized modification or misuse, operation
outside of the environmental specifications for the product, or improper
site preparation or maintenance.
NO OTHER WARRANTY IS EXPRESSED OR IMPLIED. AGILENT
TECHNOLOGIES SPECIFICALLY DISCLAIMS THE IMPLIED
WARRANTIES OF MERCHANTABILITY AND FITNESS FOR A
PARTICULAR PURPOSE.
EXCLUSIVE REMEDIES
THE REMEDIES PROVIDED HEREIN ARE BUYER’S SOLE AND
EXCLUSIVE REMEDIES. AGILENT TECHNOLOGIES SHALL NOT
BE LIABLE FOR ANY DIRECT, INDIRECT, SPECIAL, INCIDENTAL,
OR CONSEQUENTIAL DAMAGES, WHETHER BASED ON
CONTRACT, TORT, OR ANY OTHER LEGAL THEORY.
Chapter 7
237
If You Have a Problem
If You Have a Problem
Warranty Information
If You Have a Problem
If You Have a Problem
Agilent Technologies Test and Measurement Support, Services, and Assistance
Agilent Technologies Test and Measurement
Support, Services, and Assistance
Agilent Technologies aims to maximize the value you receive, while
minimizing your risk and problems. We strive to ensure that you get
the test and measurement capabilities you paid for and obtain the
support you need. Our extensive support resources and services can
help you choose the right Agilent products for your applications and
apply them successfully. Every instrument and system we sell has a
global warranty. Support is available for at least five years beyond the
production life of the product. Two concepts underlie Agilent’s overall
support policy: “Our Promise” and “Your Advantage.”
Our Promise
Our Promise means your Agilent test and measurement equipment will
meet its advertised performance and functionality. When you are
choosing new equipment, we will help you with product information,
including realistic performance specifications and practical
recommendations from experienced test engineers. When you use
Agilent equipment, we can verify that it works properly, help with
product operation, and provide basic measurement assistance for the
use of specified capabilities, at no extra cost upon request. Many
self-help tools are available.
Your Advantage
Your Advantage means that Agilent offers a wide range of additional
expert test and measurement services, which you can purchase
according to your unique technical business needs. Solve problems
efficiently and gain a competitive edge by contracting with us for
calibration, extra-cost upgrades, out-of-warranty repairs, and on-site
education and training, as well as design, system integration, project
management, and other professional engineering services. Experienced
Agilent engineers and technicians worldwide can help you maximize
your productivity, optimize the return on investment of your Agilent
instruments and systems, and obtain dependable measurement
accuracy for the life of those products.
By internet, phone, or fax, get assistance with all your test &
measurement needs.
238
Chapter 7
Table 7-1
Contacting Agilent
Online assistance: http://www.agilent.com/find/assist
United States
(tel) 1 800 452 4844
Japan
(tel) (+81) 426 56 7832
(fax) (+81) 426 56 7840
New Zealand
(tel) 0 800 738 378
(fax) (+64) 4 495 8950
Canada
(tel) 1 877 894 4414
(fax) (905) 282 6495
Latin America
(tel) (305) 269 7500
(fax) (305) 269 7599
Australia
(tel) 1 800 629 485
(fax) (+61) 3 9210
5947
Europe
(tel) (+31) 20 547 2323
(fax) (+31) 20 547
2390
Asia Call Center Numbers
Country
Phone Number
Fax Number
Singapore
1-800-375-8100
(65) 836-0252
Malaysia
1-800-828-848
1-800-801664
Philippines
(632) 8426802
1-800-16510170 (PLDT
Subscriber Only)
(632) 8426809
1-800-16510288 (PLDT
Subscriber Only)
Thailand
(088) 226-008 (outside Bangkok)
(662) 661-3999 (within Bangkok)
(66) 1-661-3714
Hong Kong
800-930-871
(852) 2506 9233
Taiwan
0800-047-866
(886) 2 25456723
People’s Republic
of China
800-810-0189 (preferred)
10800-650-0021
10800-650-0121
India
1-600-11-2929
000-800-650-1101
Returning Your Instrument to Agilent Technologies
If you are returning your transmitter tester to Agilent Technologies for
servicing, fill out and attach a blue repair tag to the instrument. Repair
tags are located at the end of this chapter.
Include as much information as possible about the problem. Record any
error messages that appeared on the display and include performance
test results or any other specific data on the performance of the
instrument.
Ship the instrument in the original factory packaging materials, if they
are available. If not, use similar packaging to properly protect the
instrument.
Return the instrument to the nearest Agilent Technologies sales and
service office. Contact the nearest office as shown in table shown above
to determine the address to which the instrument should be sent.
Chapter 7
239
If You Have a Problem
If You Have a Problem
Agilent Technologies Test and Measurement Support, Services, and Assistance
If You Have a Problem
If You Have a Problem
Agilent Technologies Test and Measurement Support, Services, and Assistance
240
Chapter 7
Menu Maps
8
Menu Maps
These menu maps are in alphabetical order by the front panel key label
or oval cross-reference label. You can locate detailed information about
each key/function at the page number listed in the figure title for each
menu.
241
Menu Maps
Basic Measurement Key Flow
Basic Measurement Key Flow
The key flow diagrams, shown in a hierarchical manner on the
following pages, will help you grasp the overall functional relationships
for the front-panel keys and the menu keys displayed at the extreme
right side of the screen. The diagrams are:
“Mode” on page 244
“Mode Setup Key Flow (page 161)” on page 245
“FREQUENCY, AMPLITUDE & Meas Control Flows (page 159,
page 160, and page 161)” on page 246
Menu Maps
“Spectrum (Freq Domain) Measurement Key Flow (1 of 3) (page
180)” on page 247
“Waveform (Time Domain) Measurement Key Flow (1 of 4) (page
196)” on page 250
“ACP Measurement Key Flow (1 of 2) (page 168)” on page 254
“CHP Measurement Key Flow (page 176)” on page 256
“Power Stat CCDF Measurement Key Flow (1 of 2) (page 212)” on
page 257
Use these flow diagrams as follows:
• There are some basic conventions:
Meas Setup
I/Q Error (Quad View)
<Bot for EVM>
Avg Number 20 On|Off
An oval represents one of the front-panel keys.
This box represents one of the menu keys displayed.
This represents an explanatory description on its specific key.
This box represents one of the default condition menu keys
displayed. Default conditions are shown as much as possible with
underlined parameters or values displayed on those menu key
labels.
• Follow the measurement diagram from left to right and top to
bottom.
• A single menu key may allow multiple choices. For example; the
Device menu key reveals two choices, Base or Mobile. The underlined
choice is the current state of the instrument. To change choices,
press the menu key one time.
• When entering a numeric value of FREQUENCY, for example, use the
numeric keypad and terminate the entry with the appropriate unit
selection from the menu keys displayed.
• When entering a numeric value of Slot (Std), for example, use the
242
Chapter 8
Menu Maps
Basic Measurement Key Flow
numeric keypad and terminate with the Enter front-panel key.
• Instead of using the numeric keypad to enter a value, it may be
easier to use the RPG knob or Up/Down keys.
Menu Maps
Chapter 8
243
Menu Maps
Basic Measurement Key Flow
Mode
Menu Maps
Figure 8-1
MODE
Basic
GSM
EDGE w/GSM
cdmaOne
NADC
PDC
W-CDMA
1xEV-DO
cdma2000
<without Option 210>
<with Option 214>
<without Option 214>
iDEN
WiDEN
Service
244
<mode>
Chapter 8
Menu Maps
Basic Measurement Key Flow
Figure 8-2
Mode Setup Key Flow (page 161)
MODE
Basic
Mode Setup
Input
Input Port
RF
50 MHz Ref
IF Align
Input Atten 0.00 dB
Ext RF Atten
IF Align Signal
Menu Maps
Signal Rate 0 = 468.75 kHz
Signal Amptd DAC 500
Signal Type CW
CW
Comb
Pulse
Trigger
RF Burst
Delay 0.000 s
Peak Level −6.00 dB
Slope Pos|Neg
Video (IF Envlp)
Delay 0.000 s
Level −6.00 dBm
Slope Pos|Neg
Ext Front
Delay 0.000 s
Level 2.00 V
Slope Pos|Neg
Ext Rear
Delay 0.000 s
Level 2.00 V
Slope Pos|Neg
Trig Holdoff 0.000000000 s
Auto Trig 100.0 ms On|Off
Frame Timer
Period 250.0000 µs
Offset 0.000 s
Reset Offset Display
Sync Source Off
Off
Ext Front
Ext Rear
Chapter 8
<mode setup-basic>
245
Menu Maps
Basic Measurement Key Flow
FREQUENCY, AMPLITUDE & Meas Control Flows (page 159,
page 160, and page 161)
Menu Maps
Figure 8-3
MODE
Basic
FREQUENCY Channel
Center Freq 1.000000 GHz
AMPLITUDE Y Scale
Scale/Div
Ref Value
Ref Position Top|Ctr|Bot
Scale Coupling On|Off
Meas Control
Restart
Measure Single|Cont
Pause
<mode_level>
246
Chapter 8
Menu Maps
Basic Measurement Key Flow
Figure 8-4
Spectrum (Freq Domain) Measurement Key Flow (1 of 3) (page
180)
MEASURE
Spectrum (Freq Domain)
Meas Setup
Span 1.00000 MHz
Res BW 20.0000 kHz Auto|Man
Average
Avg Number 25 On|Off
Avg Mode Exp|Repeat
Avg Type Log-Pwr Avg (Video)
Pwr Avg (RMS)
Log-Pwr Avg (Video)
Voltage Avg
Menu Maps
Maximum
Minimum
Trig Source Free Run (Immediate)
Free Run (Immediate)
Video (IF Envlp)
RF Burst (IF Wideband)
Ext Front
Ext Rear
Frame
Line
Restore Meas Defaults
Advanced
Pre-ADC BPF 1.93750 MHz On|Off
Pre-FFT Fltr Gaussian|Flat
Pre-FFT BW 1.55000 MHz Auto|Man
FFT Window Flat Top (High Amptd Acc)
Flat Top (High Amptd Acc)
Uniform
Hanning
Hamming
Gaussian (Alpha 3.5)
Blackman
Blackman-Harris
K-B 70 dB (Kaiser-Bessel)
K-B 90 dB (Kaiser-Bessel)
K-B 110 dB (Kaiser-Bessel)
FFT Size
Length Ctrl Auto|Man
(a)
Chapter 8
(c)
Min Pnts/RBW 3.100000
<if Length Ctrl = Auto>
Window Length 706
<if Length Ctrl = Man>
FFT Length 1024
<if Length Ctrl = Man>
<spctrm_1>
247
Menu Maps
Basic Measurement Key Flow
Figure 8-5
Spectrum (Freq Domain) Measurement Key Flow (2 of 3) (page
180)
(a)
(c)
ADC Range Auto Peak
Auto
Auto Peak
AutoPeakLock
Manual
−6 dB
0 dB
+6 dB
+12 dB
Menu Maps
+18 dB
+24 dB
< with 12-bit ADC>
Data Packing Auto
Auto
Short (16 bit)
Medium (24 bit)
Long (32 bit)
ADC Dither Auto|On|Off
Decimation 0 Auto|Man
IF Flatness On|Off
View/Trace
Spectrum
SPAN X Scale
Span 1.00000 MHz
AMPLITUDE Y Scale
Scale/Div 10.00 dB
Ref Value 0.00 dBm
Ref Position Top|Ctr|Bot
Scale Coupling On|Off
Spectrum Linear
SPAN X Scale
Span 1.00000 MHz
AMPLITUDE Y Scale
Scale/Div 100.0 mV
Ref Value 500.0 mV
Ref Position Top|Ctr|Bot
Scale Coupling On|Off
(a) (b)
248
<spctrm_2>
Chapter 8
Menu Maps
Basic Measurement Key Flow
Figure 8-6
Spectrum (Freq Domain) Measurement Key Flow (3 of 3) (page
180)
(a) (b)
I and Q Waveform
SPAN X Scale
Span 1.00000 MHz
AMPLITUDE Y Scale
Scale/Div 100.0 mV
Ref Value 0.00 V
Ref Position Top|Ctr|Bot
Scale Coupling On|Off
I/Q Polar
Menu Maps
SPAN X Scale
Span 1.00000 MHz
AMPLITUDE Y Scale
Scale/Div 100.0 mV
Ref Value 0.00 V
Ref Position Top|Ctr|Bot
Scale Coupling On|Off
Trace Display All
<for Spectrum, and Spectrum Linear Window>
All
Average
(a)
Current
Marker
Select 1|2|3|4
Normal
Delta
Function Off
Band Power
Noise
Off
Trace Spectrum
<w_spctrm3_linear>
Spectrum
(a)
Spectrum Avg
Spectrum Linear
Spectrum Avg Linear
}
<for E4406A>
}
<for E4406A>
I/Q Waveform
I Waveform
Q Waveform
Off
Shape Diamond
Diamond
Line
Square
Cross
Marker All Off
Chapter 8
<w_spctrm4_marker>
249
Menu Maps
Basic Measurement Key Flow
Figure 8-7
Waveform (Time Domain) Measurement Key Flow (1 of 4) (page
196)
MEASURE
Waveform (Time Domain)
Meas Setup
Sweep Time 1.0 µs
Res BW 100.000 kHz
Average
Avg Number 10 On|Off
Avg Mode Exp|Repeat
Avg Type Pwr Avg (RMS)
Pwr Avg (RMS)
Log-Pwr Avg (Video)
Menu Maps
Maximum
Minimum
Trig Source Free Run (Immediate)
Free Run (Immediate)
Video (IF Envlp)
RF Burst (IF Wideband)
Ext Front
Ext Rear
Frame
Line
Restore Meas Defaults
Advanced
Pre-ADC BPF 10.0000 MHz On|Off
RBW Fltr Gaussian|Flat
ADC Range Auto
Auto
Auto Peak
AutoPeakLock
Manual
−6 dB
<with 14-bit ADC>
0 dB
+6 dB
+12 dB
+18 dB
+24 dB
<with 12-bit ADC>
Data Packing Auto
Auto
Short (16 bit)
Medium (24 bit)
Long (32 bit)
ADC Dither On|Off
Decimation 1 On|Off
(a)
250
<waveform_1>
Chapter 8
Menu Maps
Basic Measurement Key Flow
Figure 8-8
Waveform (Time Domain) Measurement Key Flow (2 of 4) (page
196)
(a)
View/Trace
Signal Envelope
SPAN X Scale
Scale/Div 200.0 µs
Ref Value 0.00 s
Ref Position Left|Ctr|Right
Scale Coupling On|Off
AMPLITUDE Y Scale
Menu Maps
Scale/Div 10.00 dB
Ref Value 0.00 dBm
Ref Position Top|Ctr|Bot
Scale Coupling On|Off
Linear Envelope
<for E4406A I/Q Input>
Linear Envelope window
SPAN X Scale
Scale/Div 200.0 µs
Ref Value 0.00 s
Ref Position Left|Ctr|Right
Scale Coupling On|Off
AMPLITUDE Y Scale
Scale/Div 100.0 mV
Ref Value 0.00 V
Ref Position Top|Ctr|Bot
Scale Coupling On|Off
Phase window
SPAN X Scale
Scale/Div 200.0 µs
Ref Value 0.00 s
Ref Position Left|Ctr|Right
Scale Coupling On|Off
AMPLITUDE Y Scale
Scale/Div 30.0 deg
Ref Value 0.00 deg
Ref Position Top|Ctr|Bot
Scale Coupling On|Off
(a) (b)
Chapter 8
<waveform_2>
251
Menu Maps
Basic Measurement Key Flow
Figure 8-9
Waveform (Time Domain) Measurement Key Flow (3 of 4) (page
196)
(a) (b)
I/Q Waveform
SPAN X Scale
Scale/Div 1.03 µs
Menu Maps
Ref Value 0.00 s
Ref Position Left|Ctr|Right
Scale Coupling On|Off
AMPLITUDE Y Scale
Scale/Div 100.0 mV
Ref Value 0.00 V
Ref Position Top|Ctr|Bot
Scale Coupling On|Off
I and Q Waveform
<for E4406A I/Q Input>
SPAN X Scale
Scale/Div 1.03 µs
Ref Value 0.00 s
Ref Position Left|Ctr|Right
Scale Coupling On|Off
AMPLITUDE Y Scale
Scale/Div 100.0 mV
Ref Value 0.00 V
Ref Position Top|Ctr|Bot
Scale Coupling On|Off
I/Q Polar
SPAN X Scale
I/Q Scale/Div 100.0 mV
I Origin 0.00 V
AMPLITUDE Y Scale
I/Q Scale/Div 100.0 mV
Q Origin 0.00 V
(a)
252
<waveform_2>
Chapter 8
Menu Maps
Basic Measurement Key Flow
Figure 8-10
Waveform (Time Domain) Measurement Key Flow (4 of 4) (page
196)
(a)
Menu Maps
Marker
Select 1|2|3|4
Normal
Delta
Function Off
Band Power
Noise
Off
Trace Signal Envelope
Linear Envelope
Linear Envelope
<for E4406A I/Q Input>
Linear Phase
<for E4406A I/Q Input>
I/Q Waveform
I Waveform
<for E4406A I/Q Input>
Q Waveform
<for E4406A I/Q Input>
Off
Shape Diamond
Diamond
Line
Square
Cross
Marker All Off
Chapter 8
<waveform_2>
253
Menu Maps
Basic Measurement Key Flow
Figure 8-11
ACP Measurement Key Flow (1 of 2) (page 168)
MEASURE
ACPR (ACLR)
Meas Setup
Avg Number 20 On|Off
Avg Mode Exp|Repeat
Ref Channel
<grayed out for Fast>
Chan Integ BW 1.23000 MHz
Avg Type Pwr Avg (RMS)
Pwr Avg (RMS)
Maximum
Ref Chan Adv
Sweep Time 546.0 µs Auto|Man
Data Points 2048 Auto|Man
Menu Maps
Res BW 1.622 kHz
Num FFT Seg 1 Auto|Man
Offset / Limits
Offset A
<defaults: Offset Freq, On|Off>
A
5.0 MHz, On
B
10.0 MHz, On
C
15.0 MHz, Off
D
20.0 MHz, Off
E
25.0 MHz, Off
Offset Freq 750.000 MHz On|Off
Offset Side Neg|Both|Pos
Ref BW 30.000 kHz
<default for A to E>
Avg Type Pwr Avg (RMS)
Pwr Avg (RMS)
Maximum
Limit Setup
Abs Limit 0.00 dBm
<default for A to E>
Fail Relative
AND
OR
Absolute
Relative
<default for A to E>
Rel Lim (Car) −45.00 dBc
<−60.00 dBc for B & 0.00 for C to E>
Rel Lim (PSD) −45.00 dB
<−43.87 dBc for B & 0.00 for C to E>
Offset Adv
Sweep Time 11.196 ms Auto|Man
Data Points 1024 Auto|Man
Res BW 79.0 Hz
Num FFT Seg 1 Auto|Man
Relative Atten 0.00 dB
(a) (b)
254
<acpr_1>
Chapter 8
Menu Maps
Basic Measurement Key Flow
Figure 8-12
ACP Measurement Key Flow (2 of 2) (page 168)
Menu Maps
(a) (b)
Meas Type Total Pwr Ref
Total Pwr Ref
PSD Ref
Trig Source Free Run (Immediate)
Free Run (Immediate)
RF Burst (IF Wideband)
Ext Front
Ext Rear
Fast ACP On|Off
Spectrum Trace On|Off
Limit Test On|Off
Restore Meas Defaults
View/Trace
Bar Graph
<for FFT or Fast>
Spectrum
<for FFT or Swp>
<acpr_2>
Chapter 8
255
Menu Maps
Basic Measurement Key Flow
Figure 8-13
CHP Measurement Key Flow (page 176)
MEASURE
Channel Power
Menu Maps
Meas Setup
Avg Number 20 On|Off
Avg Mode Exp|Repeat
Integ BW 1.23000 MHz
Chan Power Span 2.00000 MHz
Restore Meas Defaults
Advanced
Sweep Time 68.0 µs Auto|Man
Data Points 512 Auto|Man
Res BW 27.903 kHz
Trig Source Free Run (Immediate)
Free Run (Immediate)
Video (IF Envlp)
RF Burst (IF Wideband)
Ext Front
Ext Rear
AMPLITUDE Y Scale
Scale/Div 10.00 dB
Ref Value 0.00 dBm
Ref Position Top|Ctr|Bot
Scale Coupling On|Off
<chpwr>
256
Chapter 8
Menu Maps
Basic Measurement Key Flow
Figure 8-14
Power Stat CCDF Measurement Key Flow (1 of 2) (page 212)
MEASURE
Power Stat CCDF
Meas Setup
Meas BW 5.00000 MHz
Counts 10.0000 Mpt
Meas Interval 1.000 ms
Trig Source Free Run (Immediate)
Free Run (Immediate)
Menu Maps
Video (IF Envlp)
RF Burst (IF Wideband)
Ext Front
Ext Rear
Frame
Restore Meas Defaults
Span X Scale
Scale / Div 2.0 dB
Display
Store Ref Trace
Ref Trace On|Off
Gaussian Line On|Off
Mode Setup
Input
Input Port
RF
RF
50 MHz Ref
IF Align
Input Atten 0.0 dB
Ext RF Atten 0.0 dB
IF Align Signal
Signal Rate 0 =468.75 kHz
Signal Amptd DAC 500
Signal Type CW
CW
Comb
Pulse
(a) (b)
Chapter 8
<ccdf_1>
257
Menu Maps
Basic Measurement Key Flow
Figure 8-15
Power Stat CCDF Measurement Key Flow (2 of 2) (page 212)
(a) (b)
Trigger
RF Burst
Delay 0.000000000 s
Peak Level -6.00 dB
Slope Pos|Neg
Menu Maps
Video (IF Envlp)
Delay 0.000000000 s
Level -6.00 dB
Slope Pos|Neg
External Front
Delay 0.000000000 s
Level 2.00 V
Slope Pos|Neg
External Rear
Delay 0.000000000 s
Level 2.00 V
Slope Pos|Neg
Trig Holdoff 0.000000000 s
Auto Trig 100.000 ms On|Off
Frame Timer
Period 250.000 µs
Offset 0.000000000 s
Reset Offset Display
Sync Source Off
Off
Ext Front
Ext Rear
FREQUENCY Channel
Center Freq 1.00000 GHz
Meas Control
Restart
Measure Single|Cont
Pause
<ccdf_2>
258
Chapter 8
Index
Numerics
50 MHz Amptd key, 148
50 MHz Ref key, 87
B
Band Pwr key, 99
Baseband IQ measurements, 136
Basic key, 92
basic mode selecting, 86
bus configuration keys, 73
C
cables
RS-232, 45
calibration, 81
IF alignment, 163
calibration keys, 77
captured data selection, 162
CCDF measurement, 212
channel
selecting the, 90
channel power
advanced menu, 219
amplitude Y scale, 160, 179
changing display, 160, 179
channel bandwidth, 219
power spectral density, 219
time record length, 219
Choose Option key, 42
computers
RS-232 cables, 45
configuring I/O, 73
context dependency map
mode, 23
context dependency maps
front panel, 25
measure, 24
mode, 24
copyrights, 2
corrections
wideband ADC corrections, 213
Corrections key, 83
Corrections Off error
annunciator, 36
custom printer, 68
D
data entry, 29
numeric keys, 29
Data Packing
spectrum measurement, 184,
199
Data Source key, 162
Decimation
spectrum measurement, 184
defaults, factory presets, 86
Delay key, trigger menu, 89
deleting an
application/personality, 38
Delta key, 99
Diagnostics key, 78
documentation
option, 17
transmitter tester, 17
E
editing text, 72
Error annunciator, 36
errors
corrections off, 37
keys, 77
oven cold, 37
troubleshooting front panel, 234
unlock, 37
ESC key, 26
Ethernet Addr key, 73
ethernet key, 73
Even Second error annunciator,
37
exponential averaging, 95
Ext Front key, 96
Ext Rear key, 96
external reference, 37
using an, 75
External Reference error
annunciator, 36
F
factory defaults, presetting, 86
FFT Length key, 183
FFT Size menu, 183
FFT Window key., 182
file features, 71
filter
gain setup (wideband), 212
setup (wideband), 212
Filter Alpha key, 212
Filter BW key, 212
Filter Type key, 212
Firmware Revision key, 78
Flat Top key, 212
floppy disk drive, 30
Frame Timer key, trigger menu,
89
Free Run key, 96
Freq Ref key, 75
frequency
259
Index
A
ACPR
measurement reference type,
171
view/trace selection, 174
active function area, 35
active license key, 42
how to locate, 42
ADC Corr key, 213
ADC Dither key
spectrum measurement, 184
ADC Range key
spectrum measurement, 183
ADC ranging function
automatic control, 198
automatic peak control, 198
automatic peak lock, 199
manual control, 199
address settings, 73
adjustment, 81
adjustment keys, 77
Advanced menu
spectrum, 182
waveform
advanced settings, 198
advanced menu
ADC dither, 199
ADC ranging function, 198
decimation, 199
number of data points, 177
pre-ADC bandpass filter, 198
resolution bandwidth, 177
resolution bandwidth filter, 198
sweep time, 177
trigger source, 177
Align 50 MHz Reference key, 82
Align ADC key, 82
Align All Now key, 81
Align Current IF Flatness key, 82
Align Current Sysgain key, 82
Align IF key, 82
Align RF key, 82
Align Subsystems key, 81
alignment keys, 77
alignment signal, 163
Alignments key, 81
Alpha Editor key, 72
amplitude Y scale
reference position, 160, 179
reference value, 160, 179
scale coupling, 160, 179
scale per division, 160, 179
annunciator bar, 37
application modes available, 78
application notes, 19
Auto Align key, 81
Auto Trig key, trigger menu, 89
Averaging menu
Avg Mode key, 95
Avg Number key, 95
Avg Type key, 95
Index
selecting the, 90
frequency channel
center frequency, 159
frequency channel key menu, 159
FREQUENCY/channel key, 90
front panel key menu maps, 22
front panel keys, 26
Front Panel Test, 152
Function key, 99
Index
G
Gaussian key, 212
GPIB Address key, 73
GPIB keys, 73
H
hardware configuration keys, 77
Help key, 31
Home key, 30
Host ID key, 78
Host Name key, 73
HP 13242G Cable, 46
HP 24542G/H Cable, 46
HP 24542M Cable, 47
HP 24542U Cable, 45, 48, 49
HP 5181-6639 Adapter, 49, 50
HP 5181-6640 Adapter, 48, 49
HP 5181-6641 Adapter, 48, 49
HP 5181-6642 Adapter, 48, 50
HP 92219J Cable, 46
HP C2913A/C2914A Cable, 47
HP F1047-80002 Cable, 45, 49, 50
HP sales and service offices, 239
I
I and Q waveform view
I or Q waveform window, 193
I waveform window, 209
Q waveform window, 209
I or Q waveform window
amplitude Y scale, 193
reference position, 194
reference value, 194
scale coupling, 194
scale per division, 193
span X scale
reference position, 159, 192,
207
reference value, 159, 192, 207
scale coupling, 159, 192, 207
scale per division, 159, 192,
207
I origin
I/Q polar window, 207, 210
I Origin key, 193, 194
I waveform window
260
amplitude Y scale, 209
reference position, 210
scale coupling, 210
scale per division, 209
I/O configuring, 73
I/Q Input Z key, 88
I/Q Polar view
waveform measurement, 207,
210
I/Q polar view
I/Q polar window, 193, 194,
207, 210
I/Q polar window
amplitude Y scale, 194
I/Q scale per division, 193, 194
Q Origin, 193, 194
I origin, 207, 210
I/Q scale per division, 207, 210
Q origin, 207, 210
span X scale, 193, 194
I Origin, 193, 194
I/Q scale per division
I/Q polar window, 207, 210
I/Q Scale/Div key, 193, 194
I/Q Waveform key, 96
I/Q waveform view
I/Q waveform window, 209
I/Q waveform window, 207
amplitude Y scale, 209
reference position, 210
reference value, 209
scale coupling, 210
scale per division, 209
IF Align key, 163
IF Align Signal menu
Signal Amptd key, 88
Signal Rate key, 88
Signal Type key, 88
IF alignment signal, 163
IF filter
gain setup, 212
IF Flat Corr key, 213
IF Flatness
advanced spectrum feature, 184
IF path filter
alpha, 212
bandwidth, 212
setup, 212
type, 212
IF setup, 212
input
external attenuator, 162
IF alignment signal
signal amplitude, 163
signal rate, 163
signal type, 163
input attenuator, 162, 163
input port
rf, 162
Input Atten key, 88
input attenuation, 88
input configuration, 73
input key menu, 162
Input menu
50 MHz Ref key, 87
I/Q key, 87
Port key, 87
RF key, 87
input port
50 MHz reference, 162
IF align, 162
input/output
wideband IF alignment, 163
input/output keys, 73
inputs
external trigger, 31
I and Q, 31
Install Now key, 42
Installing and Obtaining a license
key, 41
installing measurement
personalities, 38
Internal RF Preamplifier, 162
IP Address key, 73
K
key access path, 57
key access table, 57
key entries, 57
key menu maps, 22
keyboard
attaching external, 33
keywords for licensing, 78
L
LAN keys, 73
LAN-TP connector, 33
Length Ctrl key, 183
Length key, 183
Level key, trigger menu, 89
license key
obtaining and installing, 41
license keys installed, 78
licenses, 2
Line key, 96
line power input, 33
linear envelope view
linear envelope window, 208
phase window, 209
linear envelope window, 207
amplitude Y scale, 208
reference position, 208
reference value, 208
scale coupling, 209
Index
scale per division, 208
linear spectrum window
amplitude Y scale
reference position, 193
reference value, 193
scale coupling, 193
scale per division, 193
span, 159, 192
Load State key, 71
loading an
application/personality, 38
local
placing instrument in, 80
N
Navigation keys, 30
Next Window key, 30
Noise key, 99
Normal key, 98
O
on/off switch, 31
options
available, 78
loading/deleting, 38
options not in instrument
memory, 18, 38
output configuration, 73
P
parallel connector, 34
pc cables for RS-232, 45
personality options not in
instrument, 18, 38
personality selecting, 86
phase window, 207
amplitude Y scale, 209
reference position, 209
reference value, 209
scale per division, 209
power statistics CCDF
band limited Gaussian noise
CCDF reference line, 221
combining the multiple signals,
220
correlation between symbols on
different codes, 220
digital signal processing, 221
Gaussian distribution curve,
221
instantaneous envelope power,
221
measurement method, 221
modulation filtering, 220
modulation format, 220
number of active codes, 220
power complementary
cumulative distribution
function curves, 220
probability for that particular
power level, 221
purpose, 220
Pre-ADC BPF key
spectrum measurement, 182
Preamplifier
Setting the internal
preamplifier, 162
Pre-FFT BW key, 182
Pre-FFT Fltr key, 182
preset
factory default, 86
Print Location key, 67
Print Setup key, 67
Print Type key, 67
printer
custom, 68
Printer key, 67
printers
RS-232 cables, 45
printing, 67
probe power, 29
problems
error messages, 234
feature cannot be accessed, 234
LAN connection, 234
power-on, 234
procedure
using the waveform
measurement, 123
Q
Q origin
261
Index
M
major functional keys, 156
making basic measurements, 92
Marker key, 98
Marker menu
Band Pwr key, 99
Delta key, 99
Function key, 99
Noise key, 99
Select key, 99
Shape key, 99
Max Total Pwr key, 88
meas BW key
power stat CCDF measurement,
212
Meas Control key, 94
meas interval key
power stat CCDF measurement,
212
Measure menu key, 94
measure setup
restore measurement defaults,
172, 177, 182, 198
measurement
channel power, 176, 219
power statistics CCDF, 220
measurement bar, 35
measurement control
measure, 161
pause, 161
restart, 161
measurement modes available, 78
measurement reference type
spectral power density
reference, 171
total power reference, 171
measurement selection
spectrum (frequency domain),
160
waveform (time domain), 160,
161
measurement setup
advanced menu, 177
averaging mode, 168, 176, 180,
196
exponential, 168, 176, 180,
196
averaging number, 168, 176,
180, 196
averaging type, 181, 197
log power average (video), 181,
197
maximum voltage average,
181, 197
minimum voltage average,
181, 197
power average (rms), 181, 197
voltage average, 181, 197
channel power span, 176
integration bandwidth, 176
measurements
basic, 92
how to make, 92
measuring in the time domain,
123
menu keys
greyed-out keys, 26
highlighted keys, 26
menu map, 22
Min Pts in RBW key, 183
missing options, 18, 38
mode
availability, 78
basic, 92
selecting, 86
setup, 87
Mouse Adapter (typical), 47
Index
Index
I/Q Polar window, 207, 210
I/Q polar window, 207, 210
Q Origin key, 193, 194
Q waveform window
amplitude Y scale, 209
reference position, 210
reference value, 209
scale coupling, 210
scale per division, 209
R
Raised Cosine Key, 212
rear panel connection keys, 73
rear panel connections, 32
Ref Position key, 96
Ref Value key, 96
Reference key, 75
repair, returning your
instrument, 239
repeat averaging, 95
Res BW key
spectrum measurement, 180
waveform measurement, 196
Restore Align Defaults key, 83
Restore Meas Defaults key, 95
Restore Sys Defaults key, 77
results, waveform measurement,
223
Return key, 30
returning your instrument, 239
returning your instrument to
Hewlett-Packard, 239
RF Burst key, 96
RF Envelope key, 96
RF input, 29
Root Nyquist key, 212
RPG knob, 29
RRC (root raised cosine) key, 212
RS-232 cables, 45
RS-232 connector, 34
S
safety
installing instrument, 51
using instrument, 52
safety symbols, 52
sales and service offices, 239
sample rate, CCDF measurement,
212
save features, 71
Save State key, 71
Scale/Coupling key, 96
Scale/Div key, 96
SCSI connection, 33
Search key, 100
select captured data, 162
selecting a mode, 86
262
selecting a printer, 67
Sensors key, 150
Serial Number key, 78
Service key, 141
Service menu
50 MHz Amptd, 141
Front Panel Keys, 141
Power vs Time, 141
Sensors, 141
Spectrum, 141
Timebase, 141
Waveform, 141
service mode selecting, 86
service password, 78
set up the wideband IF, 212
setting up the mode, 87
Shape key, 99
shipment
verification list, 17
Show Errors key, 77
Show System key, 78
SICL server keys, 73
signal envelope view
signal envelope window, 208
signal envelope window, 207
amplitude Y scale, 208
reference position, 208
reference value, 208
scale coupling, 208
scale per division, 208
Slope key, trigger menu, 89
Span key, 96
spectrum measurement, 180
SPAN/X Scale menu, 96
spectrum
all traces, 192, 206
averaged trace, 192, 206
changing views, 103, 187
current trace, 192, 206
I signal trace, 192, 206
next window selection, 187
Q signal trace, 192, 206
span X scale, 159, 192
trace display, 191, 206
view/trace, 103, 187
zoom a window, 187
Spectrum (Frequency Domain)
key, 180, 212, 222
spectrum measurement
method, 222
results, 102, 187
spectrum window, 96
status keys, 77
status/info bar, 37
stored data selection, 162
Sweep Time key, 96, 196
Sync Source menu, 90
system keys, 56
T
tab keys, 30
telnet key, 73
text
how to enter, 72
Time Corr key, 83
time domain measurements, 196,
223
Timebase Frequency key, 146
Trace Display key, 96
trace/view selection
magnitude & phase graph view,
118, 204
Trig Holdout key, trigger menu,
89
trig interp key, 213
trigger
automatic trigger, 165, 214
delay, 165
external front input, 165
external rear input, 165
frame timer, 166, 214
offset, 166, 214
period, 166, 214
reset offset display, 166, 214
synchronizing source, 166,
214
level, 165
RF burst signal, 165
slope, 165
trigger holdoff, 165, 213
trigger source, 181, 197, 213
external front input, 181, 197,
213
external rear input, 181, 198,
213
frame clock, 181, 198
free run (immediate), 181, 197
line, 182, 198
RF Burst, 213
RF burst (wideband), 181, 197
video (IF envelope), 181, 197,
213
video (envelope) signal, 165
trigger interpolation function,
CCDF, 213
Trigger key, 89
trigger out, 32
Trigger Source menu
Ext Front key, 96
Ext Rear key, 96
Free Run key, 96
Line key, 96
RF Burst key, 96
Video key, 96
Index
triggering setup help, waveform
measurement, 123
troubleshooting key, 77
U
Uninstall Now, 43
uninstalling measurement
personalities, 38
Unlock error annunciator, 36
URL
firmware, 19
transmitter tester updates, 19
Z
Zoom, 30
Index
V
Video key, 96
view/trace
I/Q waveforms, 105, 189
linear spectrum and phase
graphs, 105, 189
spectrum graph, 103, 187
View/Trace key, 96
view/trace selection
I and Q Waveform view, 119,
205
I and Q waveform view, 193
I/Q polar waveform view, 121,
206
I/Q waveform graph window,
103, 188
I/Q Waveform view, 118, 204
linear envelope and phase view,
115, 202
Spectrum I/Q Waveform view,
103, 188
spectrum linear
linear spectrum window, 192,
193
viewing the time domain, 123
Visible Align key, 83
Waveform (Time Domain) Key
Menus, 196
waveform measurement, 123, 196
display, 210
I/Q Polar view, 207, 210
results, 113
WB ADC Dither key, 213
website
firmware updates, 20
transmitter tester updates, 20
Wideband Advanced key, 213
wideband filter alpha, 212
wideband filter bandwidth, 212
Wideband Filtering key, 212
wideband IF
advanced settings, 213
wideband IF alignment signal,
163
wideband IF filter type, 212
Wideband IF Gain key, 212
Wideband IF Setup key, 212
window
I/Q waveform, 96
RF envelope, 96
spectrum, 96
Window Length key, 183
W
warranty information, 237
waveform
changing displays, 206
I and Q waveform view, 209
I/Q waveform view, 209
linear envelope view, 209
method, 223
resolution bandwidth, 196
results, 113
span X scale, 206
sweep time, 206
using markers, 210
Waveform (Time Domain) key,
223
263
Index
Index
264