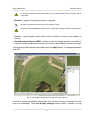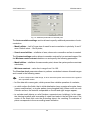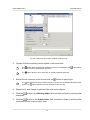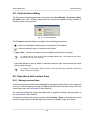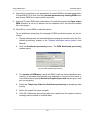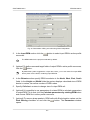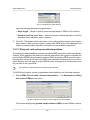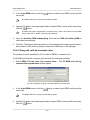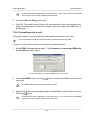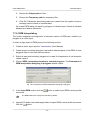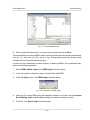
1
Digital Photogrammetric System
Version 6.0.2
USER MANUAL
DTM Generation
DTM Generation
PHOTOMOD 6.0.2
Table of Contents
1. Purpose of the document .......................................................................................................... 5
2. DTM Generation ....................................................................................................................... 5
3. Regular grid of nodes ............................................................................................................... 5
3.1. Grid creation ................................................................................................................. 5
3.2. Grid parameters ............................................................................................................ 7
4. Pickets ..................................................................................................................................... 9
4.1. Pickets creation ............................................................................................................. 9
4.1.1. Pickets creation modes and methods ................................................................... 9
4.1.2. The ’Pathway mode’ toolbar ............................................................................... 10
4.1.3. Pickets creation in pathway mode ...................................................................... 10
4.1.4. Parameters of pathway mode ............................................................................ 12
4.2. Pickets automatic calculating ........................................................................................ 14
4.2.1. Automatic calculating of pickets ......................................................................... 14
4.2.2. Correlator configurations ................................................................................... 20
4.2.3. Setup of correlator configuration ........................................................................ 22
4.2.4. Additional correlator’s parameters ...................................................................... 25
4.2.5. Parameters of first approximation calculation ...................................................... 27
4.2.6. Pickets calculation in distributed processing mode .............................................. 28
4.3. Pickets editing ............................................................................................................. 30
4.4. Filtering ....................................................................................................................... 31
4.4.1. Pickets thinning ................................................................................................. 31
4.4.2. Pickets filtering by Z-range ................................................................................ 32
4.4.3. Median pickets filtering by Z ............................................................................... 33
4.4.4. Filter of adjacent point objects ............................................................................ 33
4.4.5. Buildings and vegetation filter ............................................................................ 34
4.4.6. Filtering of linear objects .................................................................................... 41
4.4.7. Surface objects filter .......................................................................................... 42
5. Triangulation irregular network (TIN) ........................................................................................ 43
5.1. The ’TIN’ menu ............................................................................................................ 43
5.2. General information ..................................................................................................... 44
5.3. TIN creation ................................................................................................................. 45
5.3.1. Creation pre-regions for a block ......................................................................... 45
5.3.2. Loading base layers for TIN creation .................................................................. 48
5.3.3. TIN borders creation .......................................................................................... 52
5.3.4. Building TIN ...................................................................................................... 53
5.4. TIN display .................................................................................................................. 54
5.5. TIN loading .................................................................................................................. 56
5.6. TIN saving ................................................................................................................... 57
5.7. TIN info ....................................................................................................................... 57
5.7.1. Brief TIN info .................................................................................................... 57
5.7.2. General TIN info ............................................................................................... 58
5.7.3. TIN area info ..................................................................................................... 59
5.8. TIN re-building ............................................................................................................. 60
5.9. Insert objects into TIN .................................................................................................. 62
5.10. Accuracy control of TIN creation ................................................................................. 62
5.10.1. Check against adjustment points ...................................................................... 62
5.10.2. Check TIN against vector objects ..................................................................... 64
5.10.3. Verifying of TIN topology .................................................................................. 65
5.11. Export TIN ................................................................................................................. 67
5.11.1. Export TIN to DXF ........................................................................................... 67
5.11.2. Export TIN to CSV ........................................................................................... 68
5.12. Filtering ..................................................................................................................... 70
5.12.1. Simplifying ...................................................................................................... 70
2
DTM Generation
PHOTOMOD 6.0.2
5.12.2. Peak filter ....................................................................................................... 71
5.12.3. TIN filtering by Z-range .................................................................................... 72
5.12.4. Smooth TIN interpolation ................................................................................. 73
6. Contour lines .......................................................................................................................... 75
6.1. Generation contour lines by TIN .................................................................................... 75
6.2. Contours creation in batch mode ................................................................................... 76
6.3. Generation contour lines by DEM .................................................................................. 78
6.4. Contours creation from smooth DTM ............................................................................. 79
6.5. Contour lines editing .................................................................................................... 82
6.6. Operations with contour lines ........................................................................................ 82
6.6.1. Saving contour lines .......................................................................................... 82
6.6.2. Contours merging ............................................................................................. 83
6.6.3. Check of contours merging quality ...................................................................... 85
6.7. Accuracy control of contours creation ............................................................................ 86
6.7.1. Control of contours crossing .............................................................................. 86
6.7.2. Check contours by points .................................................................................. 87
7. Digital Elevation Model ............................................................................................................ 89
7.1. The ’DEM’ menu .......................................................................................................... 89
7.2. General information ..................................................................................................... 90
7.3. DEM creation .............................................................................................................. 91
7.3.1. DEM creation by TIN ......................................................................................... 91
7.3.2. DEM creation using regular pickets .................................................................... 93
7.3.3. DEM creation using pickets ................................................................................ 94
7.3.4. DEM creation using CSV-file .............................................................................. 96
7.3.5. DEM creation using smooth model ..................................................................... 97
7.3.6. Creation of dense DTM ..................................................................................... 99
7.3.7. Creation of dense DSM ................................................................................... 105
7.3.8. DEM creation in batch mode ............................................................................ 107
7.4. DEM filtering .............................................................................................................. 110
7.4.1. Buildings and vegetation filter ........................................................................... 110
7.4.2. Median filter .................................................................................................... 115
7.4.3. Smooth filter ................................................................................................... 116
7.5. Transformation of DEM coordinates ............................................................................ 116
7.5.1. DEM transpose ............................................................................................... 116
7.5.2. Transformation of DEM coordinate system ........................................................ 117
7.6. Null cells in DEM ........................................................................................................ 120
7.6.1. General information ......................................................................................... 120
7.6.2. Filling null cells using linear interpolation ........................................................... 120
7.6.3. Filling null cells using smooth interpolation ........................................................ 122
7.6.4. Filling null cells by constant value ..................................................................... 123
7.6.5. Converting cells to null ..................................................................................... 124
7.7. DEM editing ............................................................................................................... 125
7.7.1. DEM merging .................................................................................................. 125
7.7.2. Change DEM parts elevation ........................................................................... 128
7.7.3. DEM shift ........................................................................................................ 129
7.7.4. Split DEM into sheets ...................................................................................... 129
7.7.5. DEM interpolating ............................................................................................ 131
7.7.6. DEM cutting by polygons ................................................................................. 132
7.7.7. The ’DEM editing’ toolbar ................................................................................. 134
7.8. Accuracy control of DEM creation ............................................................................... 135
7.8.1. Creation of difference DEM .............................................................................. 135
7.8.2. DEMs comparing ............................................................................................ 136
7.8.3. Search for null cells ......................................................................................... 138
7.8.4. DEM control by TIN ......................................................................................... 139
3
DTM Generation
PHOTOMOD 6.0.2
7.8.5. DEM control by vector objects ..........................................................................
7.8.6. DEM control by triangulation points ..................................................................
7.9. DEM saving ...............................................................................................................
7.10. DEM recovering .......................................................................................................
7.11. DEM loading ............................................................................................................
7.12. DEM export .............................................................................................................
7.12.1. Convert DEM to pickets .................................................................................
7.12.2. DEM export ...................................................................................................
7.12.3. Export to CSV ...............................................................................................
7.12.4. Export to DTED .............................................................................................
7.12.5. Export to ERDAS Imagine ..............................................................................
7.12.6. Export to GeoTIFF .........................................................................................
7.12.7. Export to PCIDSK ..........................................................................................
7.13. DEM import .............................................................................................................
4
141
142
144
146
146
148
148
149
149
150
151
152
153
155
DTM Generation
PHOTOMOD 6.0.2
1. Purpose of the document
This document contains detailed information about generation of digital elevation
model (DEM). The document describes creating of regular nodes grid and working with
layers needed for DEM generation pickets layers, triangulated irregular network (TIN),
contour lines and DEMs. The document also describes main ways of generation of digital terrain model using these layers.
2. DTM Generation
The system provides possibility of generation of digital terrain model using different
data sets.
Digital Terrain Model (DTM) – digital cartographic presentation of terrain surface both
as regular grid of elevations (DEM) and as triangulated irregular network (TIN).
The following data sets (individually or in combination) are used for generation of digital
terrain model:
• Pickets – point vector objects, located on relief surface;
• Triangulation Irregular Network (TIN) – one of the models of spatially coordinated
data, used during designing of digital terrain model as elevation points in nodes of
irregular network of triangles, that corresponds to Delaunay triangulation;
• Contour lines – vector lines, that connect points with the same terrain altitude;
• Digital elevation model – digital cartographic presentation of terrain surface as regular
grid of elevation values.
It is possible to acquire data necessary for DTM generation both from central projection
images and from satellite scanner images.
3. Regular grid of nodes
3.1. Grid creation
The system provides possibility of regular grid creation with specified step. The grid is
used for pickets creation in automatic mode with help of correlator or in semi-automatic
pathway mode. A grid step is used as a frequency of nodes creation, in which vicinity
spatial coordinates are calculated and pickets are created. Moreover, the grid is used
for different operations, such as map creation in stereo quality, DEM generation using
dense model and for other operations (see the chapters Automatic pickets creation,
Pickets creation in pathway mode in the ’Vectorization’ User Manual).
5
DTM Generation
PHOTOMOD 6.0.2
The grid could be created both for the whole images block and for any part of a block
or for selected stereopair. A shape of grid borders could be rectangular or as arbitrary
polygon.
To create a grid select Grid › Create (Ctrl+N, G) or click the
button of the main
toolbar. After that a new layer Grid is created in the Layer Manager.
Area of grid creation is determined in one of the following ways:
• in order to create a grid with specified rectangular border, press and hold the Shift
key, and drag by mouse a rectangular area over images block or over selected stereopair;
• in order to create a grid with arbitrary border, define a grid creation area in group
selection mode by polygon and while holding pressed the Shift key, specify by mouse
all nodes of boundary of a grid creation area. Complete creation of arbitrary grid
border by mouse double click.
It is possible to use pre-regions for grid area detection.
• to use vector layer polygons as areas of grid creation, perform the following actions:
1. Select Vectors › Create layer to create vector layer without classifier or load
layer with polygons which could be used as a grid boundaries.
2. Create a polygon in such a way that its boundary coincides with boundaries of
area which is used for grid creation.
3. [optional] Select polygons to be used as boundaries for a grid creation, otherwise,
a grid will be created considering all polygons of the layer.
4. Select Grid › Create boundaries from vectors. After that created grid boundary
coincides with outline of created polygon.
• to create a grid for the whole images block without defining its boundaries, select
Grid › Properties, specify its parameters and click OK. Grid is created automatically
for the entire block and the grid boundary passes over external boundary of block
images.
When a grid boundary is defined the system creates a grid of nodes with specified or
default parameters.
To save created grid in active profile resources use Grid › Save and Grid › Save as
menu items. The grid is saved to the *.x-grid file.
To open existing grid, select Grid › Open. To close a grid, select Grid › Close.
6
DTM Generation
PHOTOMOD 6.0.2
Right-click menu of the Grid layer in the Manager duplicates save and load commands
in the Grid menu, and allows to close a grid layer.
Fig. 1. Rectangular grid for the whole images block
3.2. Grid parameters
In order to change parameters of created grid, select Grid › Properties. The Grid
properties window opens.
Fig. 2. Regular grid parameters
The Grid properties window allows to setup the following parameters:
• X step and Y step – steps for nodes creation correspondingly by X and Y axes in
meters;
7
DTM Generation
PHOTOMOD 6.0.2
To change a direction of grid nodes tracking in the pathway mode specify negative values
of grid step.
• Rotation – angle of nodes grid rotation in degrees;
Should be specified for manual work in the pathway mode.
At that, the nodes grid only is rotated. Area of nodes grid creation remains in initial position.
• Z level – a grid elevation above relief level (in meters) for visual correct display of
the grid;
• Ground sample distance (GSD) – shows a value of average pixel size in meters, if
a project contains adjustment results or pixel size is specified for at least one image.
To display a grid with specified parameters click the Apply button. To change parameters
click OK.
Fig. 3. Grid created using arbitrary border (with grid rotation)
In order to change grid display parameters click colourful square to the right from the
layer in the Manager. The Layer display settings window opens. It allows to setup
8
DTM Generation
PHOTOMOD 6.0.2
color of grid nodes and borders, as well as a type and size of symbol used to show grid
nodes.
Fig. 4. Parameters of grid display
Additional parameters of grid display, as well as settings of pathway mode are setup
on the Grid tab of the Settings window (see the ’General system’s parameters’ User
Manual).
4. Pickets
4.1. Pickets creation
4.1.1. Pickets creation modes and methods
Pickets – point vector objects, located on relief surface. Pickets like other vector layers
are used as a base layer for TIN generation.
The system allows the following modes of pickets creation:
• manually in stereomode – points are added manually in stereomode using correlator
or without it;
Correlator’s parameters are setup in the window of general system’s settings on the Correlator tab (see the ’General system’s parameters’ User Manual).
• in semi-automatic pathway mode with preliminary creation of regular nodes grid –
that means sequenced passing of all nodes of regular grid and adding of pickets
manually using correlator or without it, or skipping a node and passing to the next
one;
Correlator’s parameters are setup in the window of general system’s settings on the Correlator tab (see the ’General system’s parameters’ User Manual).
• in automatic mode with preliminary creation of regular nodes grid. At that in grid nodes
vicinity the system calculates points spatial coordinates with help of correlator and
creates pickets if the coordinates are calculated successfully. In automatic mode the
9
DTM Generation
PHOTOMOD 6.0.2
system passes grid’s nodes specified number of times with different correlator parameters, performs accuracy control, pickets filtering, and saves quality evaluation.
For automatic pickets calculation correlator’s parameters should be adjusted in the Compute
points window.
4.1.2. The ’Pathway mode’ toolbar
For work in pathway mode the system provides the Vectors › Pathway mode menu
items, that are partially duplicated by the Pathway mode additional toolbar buttons.
Table 1. The ’Pathway mode’ toolbar
Buttons
Activate
Add point (Enter)
Function
allows to turn on/off pathway mode
allows to add picket to current node
Bypass point (Delete)
allows to bypass a node (without adding picket) and
to pass to the next node
Return (Backspace)
allows to return to the previous node (without picket
deletion)
Marker to current grid node
allows to move marker to current active grid node
To nearest grid node
allows to move marker to nearest grid node of
markers current position. The node becomes active
automatically (provided that marker is inside grid in
geodetic coordinate system), that allows to start
passing pickets manually
To first grid node
allows to move marker to left lower grid node and
to make the node active
Mode: scan rows
allows to turn on sequential mode of grid passing
by rows
Mode: scan columns
allows to turn on sequential mode of grid passing
by columns
Mode: ’zigzag’ by rows
allows to turn on ’zigzag’ mode of grid passing by
rows
Mode: ’zigzag’ by columns
allows to turn on ’zigzag’ mode of grid passing by
columns
Settings
opens the system settings window on the Pathway
mode tab to setup the mode parameters (see Section 4.1.4)
4.1.3. Pickets creation in pathway mode
For semi-automatic pickets creation using regular grid the system provides Pathway
mode.
In the pathway mode the system passes grid nodes in such a way that XY coordinates
of points are measured uniformly. Marker XY coordinates are preserved while passing
10
DTM Generation
PHOTOMOD 6.0.2
from one grid node to another, and elevation is measured manually. Pickets measurement in pathway mode is possible both using correlator or without it.
The first coordinate of marker elevation during passing to the first node corresponds to
grid level by Z, specified in the Grid properties. Marker’s elevation level during passing
to each next node is defined by settings.
Pickets adding in pathway mode is performed in stereomode in stereopair 2D-window.
If a grid is created for the entire images block, the system allows to setup automatic pass to the
next stereopair while passing nodes. To do this use the window of general system’s parameters
on the Pathway tab.
To create pickets in pathway mode, perform the following actions:
1. Create a grid for required area of pickets creating.
2. Create or make active a vector layer for pickets creation.
3. Choose Vectors › Pathway › Activate or click the
button of the Pathway mode
additional toolbar. Marker will be placed to left lower grid corner – start point of
passing.
If grid node was not created before, it is created automatically for the whole images block.
When the grid layer is closed the pathway mode is turned off automatically.
4. Select a direction of grid nodes passing using Vectors › Pathway menu or using
buttons of the Pathway mode additional toolbar.
5. Choose Window › New 2D-window (stereopair) (Ctrl+Alt+L) or click the
button
of the main toolbar. The stereopair 2D-window is opened and allows to start grid
nodes passing.
6. [optional] For image automatic centering by marker during passing to the next grid
node turn on the Fixed marker mode. To do this click the
button or use the F6
hotkey.
To vectorize objects during grid nodes passing in pathway mode, turn the Fixed marker
mode temporarily off.
7. Click the
to turn on stereo mode in 2D-window of a stereopair.
To work in pathway mode it is necessary to turn on the mode of point objects creation –
using the
button of the Vectors additional toolbar.
11
DTM Generation
PHOTOMOD 6.0.2
8. To perform grid nodes passing the system provides the following tools:
• to add picket to current grid node manually, set marker elevation using mouse
wheel and press Enter;
• to add picket to current grid node using correlator, press Space key to set
marker elevation using correlator and press Enter;
After the picket is added marker moves to the next grid node according to selected
passing direction.
• to pass to the next node without adding picket, press Delete key;
• to pass to the previous node without adding picket, press Backspace key.
To delete picket use the Ctrl+Z hotkeys. It is possible to delete pickets, only if history
of recent operations is turned on and cancelling of these operations is allowed (see the
Undo settings chapter in the ’General system’s parameters’ User Manual).
9. After passing of the last grid node the system displays the Pathway complete
message. Click OK. Save the vector layer with acquired pickets set for further use.
To memorize a position of the current active node during passing, save the grid layer.
To continue grid nodes passing form current position, perform the following actions:
1. Load saved grid layer.
2. Choose Vectors › Pathway › Activate or click the
button of the Pathway mode
additional toolbar. After that a grid node which was active at the moment of the
layer saving, becomes active automatically.
3. Place marker to vicinity of the active grid node.
4. Choose Vectors › Pathway › To nearest grid node or click the
button of the
Pathway mode additional toolbar, to move marker to the nearest node.
5. Go on to pass grid nodes.
4.1.4. Parameters of pathway mode
To specify preliminary parameters of work in pathway mode, perform the following actions:
12
DTM Generation
PHOTOMOD 6.0.2
1. Choose Vectors › Pathway › Settings. The Settings window is opened on the
Pathway tab (see the detailed description of general system settings in the ’General
system’s parameters’ User Manual).
Fig. 5. Parameters of pathway mode
2. Choose one of the ways of specifying marker position by Z when pass to next grid
node:
• Do not change – marker position by Z is not change, i.e. Z-coordinate of marker
in previous grid node is used;
• Z from grid – marker position by Z is set equal to Z level of grid, defined in the
Grid properties window;
• Value – marker position by Z is set equal to the value specified in this field (in
meters).
3. [optional] The Limit grid area in stereopair 2D-window checkbox is set on in the
system by default, that allows to setup passing grid nodes in pathway mode only
in borders of stereopair regardless of grid size.
It is not recommended to set the Automatically change stereopair checkbox on while
the Limit grid area in stereopair 2D-window checkbox is set on, since it leads to work
with incorrect data.
13
DTM Generation
PHOTOMOD 6.0.2
4. [optional] In order to pass nodes of ’global’ grid with automatic stereopair change,
set the Limit grid area in stereopair 2D-window checkbox off and set the Automatically change stereopair checkbox on. Besides, the Threshold parameter
also has influence on automatic stereopair change. The parameter specifies a distance from stereopair border in percent of the whole stereopair size, and when this
distance is reached during passing nodes in pathway mode the stereopair is changed
to the next one in 2D-window.
4.2. Pickets automatic calculating
4.2.1. Automatic calculating of pickets
The system provides possibility to calculate pickets automatically using correlator in
overlap areas of stereopair images by regular nodes grid.
All selected stereopairs should be located to adjusted part of a block (see ’Block adjustment’
User Manual), otherwise, pickets calculation is not performed or is performed incorrectly. In the
first case the system displays error message, in the second one – it is not possible to match
calculated pickets to project coordinate system.
Acquired pickets are used as a vector base for DEM generation. Additional possibilities
of pickets editing allow to obtain vector base for TIN creation and DEM generation.
The principle of automatic pickets calculation is as follows. For each selected oriented stereopair
the system performs automatic pass of all grid nodes, located in overlap area of stereopair images, and tries to calculate spatial coordinates in vicinity of each grid node using correlator. In
case of successful correlation the system performs accuracy control of each found point’s coordinates, and after that the point is either added to vector layer as point object, or is excluded.
If the system fails to calculate spatial coordinates in vicinity of some grid node, the node is
skipped and the system passes to the next node.
14
DTM Generation
PHOTOMOD 6.0.2
Fig. 6. Automatic pickets calculation in arbitrary area
Prior to start of automatic pickets calculation perform the following preparatory actions:
1. Define search area: select block stereopairs where to perform automatic pickets
calculation.
2. Create regular nodes grid for selected search area.
3. Select Vectors › Compute points automatically. The Compute points window
opens.
If a grid not was not created, it is created automatically for the entire images block and the
Grid properties window opens, that allows to specify grid parameters.
15
DTM Generation
PHOTOMOD 6.0.2
Fig. 7. The ’Compute points’ window
4. In the Correlator preset section select in the list one of the following types of terrain:
• mountainous terrain;
• urban area;
• desert;
• rural area;
• rural area 2.
To view and edit parameters values and to setup correlator configuration the list, to create
new or delete configurations from the list click the
button.
5. In the Search area section specify a search area, which will be used for automatic
pickets calculation:
• All images – allows to select all images of a block;
• Selected images – allows to select block images highlighted in 2D-window;
To view and change a set of highlighted images in block 2D-window click the
16
button.
DTM Generation
PHOTOMOD 6.0.2
• Active stereopair – allows to select images of a stereopair opened in active 2Dwindow.
All selected stereopairs should be located on adjusted part of a block (see ’Block adjustment’ User Manual), otherwise, pickets calculation is not performed or is performed incorrectly. In the first case the system displays error message, in the second one – it is
not possible to match calculated pickets to project coordinate system.
6. [optional] To pass each grid node only once during calculation, prior to define
parameters it is necessary to create pre-regions, set the Use pre-regions checkbox
on and select pre-regions layers in the list.
Binding of pre-regions and stereopairs is performed using region_image_code and region_image_code_2 attributes.
7. [optional] Pickets calculation is performed by default for strip stereopairs. To calculate
pickets for inter-strip stereopairs, formed by selected images set the Process interstrip stereopairs checkbox on.
8. [optional] To filter blunders by Z on images with intersection angle of small or null
value, set the Limit intersection angle checkbox on and define a value of minimal
angle using the slider.
9. [optional] In the Grid section the Area of the grid layer in m2, as well as Appr.
nodes count in a grid are displayed in appropriate fields. To change a grid layer
parameters click the Properties button.
To change grid boundaries it is necessary to close the Compute points window.
10. In the Initial approximation the method of calculation of the elevation range of
points with the search for the correlator:
Initial approximation defines a value of Z coordinate of grid node, that is used to calculate
initial coordinates of picket on the left and right images of a stereopair.
• Stereopair elevation range – the elevation range is calculated for each stereopair
with heights of pickets, previously measured in the project;
• Project elevation range – the elevation range is obtained from the Relief elevation values in project properties or it is calculated with heights of pickets, previously measured in the project;
• Mean stereopair elevation – mean elevation of each stereopair, calculated using
exterior orientation parameters, is used as initial approximation;
17
DTM Generation
PHOTOMOD 6.0.2
• Fixed elevation – input elevation value in meters to be used as initial approximation;
• Triangulation points – allows to calculate the elevation range for each stereopair
from a smooth model built by project triangulation points;
• DEM – a value of elevation of selected DEM in point with XY coordinates of grid
node is used as initial approximation.
If grid node falls into null cell of DEM, the system uses average elevation of corresponding stereopair. To select DEM in active profile resources click the
button.
To specify value of acceptable deviation of Z-coordinate of calculated pickets from
initial approximation and input value in meters to the Maximal shift field.
11. [optional] There are the following options in the Additional settings section:
• Save quality assessment to attributes – allows to save quality assessment of
pickets calculation as attributes of point vector object. Quality assessments are
saved to the following object attributes:
○ ’corr’ (double) – correlation coefficient, number in range from specified correlation threshold up to 1;
○ ’aq’ (double) – auto-correlation sigma;
○ ’std_dev’ (double) – standard deviation;
○ ’pass’ (int) – number of passes;
○ ’disp’ (int) – dispersion value.
To view values of attributes of pickets calculation quality select the picket and
choose Window › Object attributes. The Object attributes window opens.
Fig. 8. Quality assessments of calculated picket
• Delete redundant points – allows to thin nearest pickets, acquired during passing
the same grid nodes on different stereopairs;
18
DTM Generation
PHOTOMOD 6.0.2
Thinning is performed after completion of pickets calculation operation according to
specified radius value, set by used correlator configuration.
When the Save quality assessment to attributes checkbox is on, points with minimal
correlation coefficient (minimal value of ’corr’ attribute) are removed from several found
nearest points.
• Random points distribution – allows distribute pickets randomly in area of
halfsize of grid cell from grid node;
• Accuracy control with reverse stereopair – allows to check results of found
point on a reverse stereopair; if results do not the same, point removes;
12. In the Destination section define parameters of loading and saving of calculated
pickets:
• Load into vector layer – allows to load pickets into active vector layer;
If there is no active vector layer, pickets are loaded to a new vector layer.
• Save into resources – allows to save pickets into active profile resources without
loading. Click the Settings button to specify parameters of pickets saving. The
Settings for saving points window opens.
Fig. 9. The ’Settings for saving points’ window
To save pickets in one vector file of active profile perform the following actions:
1. Select the Save into one resource option and click the
Save window opens.
button. The
2. Select a folder in the active profile resources and input a name of vector file
in the Resource name field. Click OK to create a new vector file and to return
to the Settings for saving points window.
19
DTM Generation
PHOTOMOD 6.0.2
3. The input field of the Settings for saving points window shows path and
name of new vector file. Click OK to return to the Compute points window.
To save pickets in parts into several vector files of active profile perform the following actions:
1. Choose the Split into parts option.
2. Select one of the ways of pickets splitting – By rectangular sheets and input
a size of rectangular area in meters or By stereopairs.
3. Input path to save file to the Save in folder field or click the
button, to
select name and path in active profile resources to save pickets in parts to
corresponding vector files and click OK.
4. The input field of the Settings for saving points window shows path and
name of new vector file. Click OK to return to the Compute points window.
13. Click OK. The pickets calculation operation starts.
In some cases operation of automatic pickets calculation takes a lot of time.
To setup pickets calculation in distributed mode click the Distributed processing
button and specify parameters of tasks distribution.
4.2.2. Correlator configurations
Correlator configuration – is a script of pickets calculation operation, that defined a
number of passes of regular grid nodes and a set of correlator parameters for each
pass.
The Correlator configuration window is used to form a list of correlator’s configurations.
In order to open the window click the
button in the Correlator configuration panel
of the Compute points window.
20
DTM Generation
PHOTOMOD 6.0.2
Fig. 10. The ’Correlator presets’ window
The left part of the window displays a list of all created correlator configurations. Default
list includes standard correlator configurations with fitted values of parameters for the
following terrain types:
• mountainous terrain – for automatic pickets calculation on images with mainly
mountainous terrain with big elevation differences;
• urban areas – for automatic pickets calculation on images with mainly urban type of
build-up;
• desert – for automatic pickets calculation on images with monotonously deserted
terrain with rare vegetation;
• rural area – for automatic pickets calculation on images with rural areas with with
minor amounts of buildings and infrastructure;
• rural area 2 – for automatic pickets calculation for ’rural’ area with heterogeneous
parts of relief. If there are images with big intersection angle the configuration uses
a mask of larger size. Accuracy of pickets calculation is less then when using rural
area type.
The right panel of the window contains the following buttons for managing correlator’s
presets:
21
DTM Generation
PHOTOMOD 6.0.2
• Create new – allows to specify name and parameters to create new configuration of
correlator;
• Edit – allows to edit parameters of correlator’s configuration selected in the list;
• Copy – allows to create a copy of selected correlator’s configuration with different
name, but with the same parameters;
• Rename – allows to rename selected correlatior’s configuration;
• Delete – allows to delete selected correlatior’s configuration;
Preset configuration couldn’t be changed or removed.
• Close – allows to close the Correlator presets window.
4.2.3. Setup of correlator configuration
To view and setup correlator’s configuration the system provides the Edit preset window,
which is opened in the following cases:
• while editing of existing configuration select configuration in the list of the Correlator
presets window and click the Edit button;
• while creating new configuration click the Create new button, input new configuration
name and click OK.
22
DTM Generation
PHOTOMOD 6.0.2
Fig. 11. Window of correlator passes parameters
Setup of correlator configuration in the Edit preset window includes defining of script
of automatic pickets calculation.
Depending on terrain type the script could include both single and multiple passes of grid nodes,
it is possible to specify particular set of correlator parameters for each of them.
For correlator configuration setup perform the following actions:
1. Create a list with required number of correlator passes.
Passes in the list are placed according to their order of use during automatic pickets calculation.
To form the passes list the following buttons are provided:
•
– allows to add new pass to the end of list;
•
– allows to delete selected pass;
•
– allows to move selected pass down the list;
•
– allows to move selected pass up the list;
•
– allows to return settings to default.
2. Select correlator pass in the list to setup its parameters.
23
DTM Generation
PHOTOMOD 6.0.2
3. In the Pass section setup the following main correlator parameters for a pass selected in the list:
• Correlation mask halfsize – half of linear size of rectangular correlation mask
in pixels by X and Y axes;
Increasing the mask size increases recognition quality for smooth relief and decreases
influence of tiny details on terrain surface, however, it decreases total amount of acquired
points. Besides, during processing imagery with low-contrast areas, which correspond
to sloping grounds (fields or lawns on hill slopes, for instance), the system may add
points that correspond an edge of mask, rather than center.
• The Increase search area parameter allows to specify a number of pixels to increase search area more than defined value of correlation mask size;
Increasing of search area is used, when considering stereopair orientation data the estimated search area of corresponding point on the right images is insufficient (no tie
points enough on high-rise objects or in stereopair corners, for instance). It is necessary
to increase search area by Y in case of poor accuracy of stereopair relative orientation.
• Correlation threshold – minimal acceptable value of correlation coefficient;
Value of correlation threshold depends significantly both on material and other parameters. For correct work of correlation algorithm it is recommended to setup the value not
less than 0.7.
• Contrast point search area – a size of area around grid node, where the system
performs search for a point with maximal contrast prior to correlation operation;
It is recommended to increase this value for images with well-defined contours of objects,
and to decrease it for low-contrast (fuzzy) areas, where there is high probability of correlator errors.
• Control autocorrelation and Maximum autocorrelation radius – is used to
control point’s autocorrelation – degree of point’s uniqueness in some its vicinity
on the left image.
The more the autocorrelation radius, the less distinctive is the point and the more probable
is incorrect matching of the point with the right image, including cases with high correlation
coefficient.
The More button is used to setup additional parameters of selected pass.
4. In the Miscellaneous section setup the following additional parameters of correlator’s pass:
24
DTM Generation
PHOTOMOD 6.0.2
• Limit points Z range – allows to specify one of filtering criteria by Z-range, which
is applied to each point calculated using calculator:
○ project elevation range, defined by user in project properties;
○ stereopair elevation range, calculated during images block adjustment.
• Redundant points filter radius – is used to filter nearest pickets, acquired during
passing the same grid nodes on different stereopairs;
Pickets thinning is performed after completing of pickets calculation operation, considering
specified value of the radius in meters.
• Compute first approximation – allows to use results of preliminary pickets calculation, which parameters are setup using the Settings button;
It is recommended to perform preliminary calculation for automatic search for pickets
on satellite scanner images.
• Additional pass with reverse stereopair – allows to use additional pass during
pickets calculation, when the system performs search for matching points on the
left image for points on the right image (during main pass the system performs
points search on the right image for points on the left one);
• Unused image border (in percent) – allows to not consider specified percent of
image edges during pickets calculation;
• Maximum vertical parallax – allows to specify a limit for points filtering by vertical parallax value (in pixels).
Point acquired as a result of correlation has 4 coordinates – (XL,YL) on the left image and
(XR,YR) on the right image. To calculate vertical parallax the system performs transformation of images coordinate system into project coordinate system and vice versa. As a
result two pairs of new coordinates are acquired (XL 2, YL 2) and (XR 2, YR 2) . In this case
parallax is calculated as Y PAR = (YR − YL) − (YR 2 − YL 2) . Points with the value more than
specified Y PAR are rejected. This parameter should be selected experimentally, especially for scanner survey projects.
5. Click OK to complete setup of correlator configuration parameters.
4.2.4. Additional correlator’s parameters
To setup additional parameters of correlator for selected pass in the Edit preset window
there is the More button, that allows to open the Additional settings: window Pass #.
25
DTM Generation
PHOTOMOD 6.0.2
Fig. 12. Additional parameters of selected pass
The Autocorrelation settings section allows to specify additional parameters of autocorrelation:
• Mask halfsize – half of linear size of mask for auto-correlation in pixels by X and Y
axes. Default value – 10x10 pixels;
• Search area halfsize – a halfsize of area, where auto-correaltion surface is created.
The Contrast settings section allows to consider contrast for low contrast images. Set
the Minimum mask contrast checkbox on and specify the following parameters:
• Mask halfsize – a halfsize of area around a point, where the system performs contrast
calculation;
• Minimum contrast – value lies in range from 0 to 100.
The Overview level parameter allows to perform correlation between thinned images
and is used in the following cases:
’0’ value corresponds to initial image, in other cases that system uses the level of the pyramid
with a specified number.
• for film data with coarse grain, which prevent from reliable operation of correlator;
• on relief surface like fields, that in initial detalization have occasional irregular items
(grass, small bushes), or regular pattern (new-ploughed field). When zoom out such
a terrain surface, the textures comparable on the left and right images appear;
• to exclude small objects on relief (bushes, separate trees, buildings). In this case,
the thinning together with increasing of mask size leads to the fact that even if the
center of the mask falls onto the protruding object, the resulting Z-coordinate of
picket corresponds to the surrounding terrain elevation.
26
DTM Generation
PHOTOMOD 6.0.2
As the passes of the same calculation process, it is advisable to use a correlator configuration differing by no more than one level of the pyramid (for example, 0 и 1; 2 и 3).
Otherwise, in areas of fine detail (in particular, buildings), it is possible to receive the
’chess’ grids of alternating points at the height of the object, and at the height of the
relief.
The Multilevel correlator checkbox allows to use different levels of pyramid for correlation during search for corresponding points.
4.2.5. Parameters of first approximation calculation
The system provides possibility to use first approximation of digital terrain model during
correlator passes. Such DTM is a TIN, generated using thinned pickets set.
DTM of first approximation allows to significantly reduce the search area for each point of the
main operation, i.e. to reduce the total search time and reduce the probability of erroneous
points occurrence.
In correlator’s preset configurations first approximation calculation is used for ’mountainous
terrain’ configuration.
To use and configure calculation parameters of first approximation DTM, perform the
following actions:
1. In the Edit preset window set the Compute first approximation checkbox on.
2. Click the Settings button. The First approximation for: window opens ’configuration name’.
Fig. 13. Parameters of first approximation calculation
27
DTM Generation
PHOTOMOD 6.0.2
3. Specify the First approximation DTM step to define a step of DTM to be created.
4. [optional] To use threshold filtering during DTM creation set the First approximation
DTM filter threshold checkbox on. Specify a value that corresponds to threshold
of filtering of intermediate TIN by minimum angle of inclination of the normal, given
to a range of (0;1).
5. In the Increase search area fields input a number of pixels for additional increasing
of search area and to make it more than values, specified in the main parameters
of correlator passes.
6. The Correlator passes list and parameters in the Pass section allow to define
correlator configuration for preliminary pickets calculation (see a description of the
main parameters in the Section 4.2.3).
The More button allows to setup additional parameters of selected pass.
7. Click OK to return to the Edit preset window.
4.2.6. Pickets calculation in distributed processing mode
To calculate pickets in distributed processing mode, perform the following actions:
1. Change settings and run the distributed processing server/client (see the ’Distributed
processing’ chapter in the ’General information about system’ User Manual).
2. Select Vectors › Compute points automatically. The Compute points window
opens.
If a grid not was not created, it is created automatically for the entire images block and the
Grid properties window opens, that allows to specify grid parameters.
3. Setup parameters of automatic pickets calculation.
4. Click the Distributed processing button. The Compute points Distributed Processing window opens.
Fig. 14. Parameters of distributed processing of pickets calculation
28
DTM Generation
PHOTOMOD 6.0.2
5. In the Split into tasks section select a way of splitting of processing operation into
tasks:
• By stereopairs – allows to process each stereopair in a separate task;
Since tasks are executed independently from each other, the system doesn’t remove
points, falling into the same grid nodes from different stereopairs (for example, during
filtering of nearest points).
• By rectangular sheets – it is necessary to specify in the fields a size of rectangles, into which the entire search area is split (in meters). Filtering of nearest
pickets is not performed in this case. The result of each task processing is saved
to the file with name like Sheet_X_Y.x-data.
Rectangle, circumscribing grid boundaries in project coordinates system, is split by
rectangular sheets of a size specified in the fields. Each sheet includes images parts
from all stereopairs, into which it falls.
If stereopairs are processed in separate tasks, after that it is necessary to perform manual
data correction. Calculated pickets are saved in resources, named by stereopairs names.
The Tasks number for computing points field displays calculated number of
tasks depending on selected way of workflow split and/or size of specified areas.
By default По умолчанию задается вложенная папка в папке \Data текущего проекта.
It is not possible to define number of tasks manually.
6. In the Working folder section click the
profile resources to save output DEM.
button and select empty folder in active
Before operation is performed all data from selected folder is removed. It is strongly not
recommended to specify a project folder as a working folder, especially when there are no
saved project backups.
7. Click OK. Distributed processing tasks are created and the system shows a message
about number of created tasks.
When using distributed pickets calculation, the result of each task is saved to separate file
with tsk extension in specified Working folder of a project.
29
DTM Generation
PHOTOMOD 6.0.2
4.3. Pickets editing
The system provides possibility of editing of single or multiple selected pickets. Since
pickets calculated automatically are points, all operations of points editing are applicable
to them.
To select vector objects manually in active vector layer the system provides the following
features:
• mouse double click or the S key to highlight single polyline/polygon;
• mouse click to highlight point/vertex (place marker in point’s vicinity in advance);
• selection mode
Rectangle to select vector objects inside a rectangle;
• selection mode
Polygon to select vector objects inside arbitrary polygon.
To highlight objects on active vector layer inside a rectangle choose Edit › Group selection › Rectangle or click the
button of the Tools toolbar. Press and hold the Shift
key and drag a rectangle by mouse.
To highlight objects inside arbitrary polygon choose Edit › Group selection › Polygon
or click the
button of the Tools toolbar. Press and hold the Shift key. Then make
mouse click to create the first polygon vertex and a ’rubber line’ directed to current
cursor position. Input subsequent vertices by mouse clicks. To complete objects selection
by polygon use mouse double click. To break off selection, press the Esc key.
For quick switching between Polygon and Rectangle selection modes there is context menu
opened by the Shift+F10 hotkeys.
To select all objects of active vector layer choose Edit › Select all or use the Ctrl+A
hotkeys.
See detailed description of selection tools and modes in the ’Vector objects selection’ chapter
of the ’Vectorization’ User Manual.
To add a new picket to active vector layer, perform the following actions:
1. Choose Edit › Vectors create mode › Points (P) or click the
Vectors additional toolbar to turn on pickets creation mode.
button of the
2. Place marker to selected point on image in 2D-window.
3. Press the Insert key to add a point without correlator on specified elevation.
The system also allows to place marker on a model surface automatically using
correlator. The Space key is used to do this.
30
DTM Generation
PHOTOMOD 6.0.2
If the correlator failed to work the Status panel displays the Bad point message and the
system produces warning audio signal (see the ’General system’s parameters’ User
Manual).
Besides the system provides possibility to delete pickets, located nearer from linear
vector objects than specified distance (see the ’Vectorization’ User Manual).
In this document all points not lying on the relief surface (average smoothed terrain
surface), are called surges.
The system provides deletion, correction or recognizing pints (pickets) which have fallen
on buildings, trees, cars, in pits, etc. during automatic pickets calculation, and during
filtering of accident surges.
To edit automatically calculated pickets the system provides the following filters:
• Pickets thinning – thinning out of densely located points with specified level of thinning;
• Filter by Z-range – filtering points and vertices of polylines/polygons, which Z-coordinate is out of specified range;
• Median Z filter – filtering points and vertices of polylines/polygons using mask of
specified size;
• Filter adjacent point objects – filtering of closely located points (located nearer than
specified distance);
• Buildings and vegetation filter – filtering points, which have fallen on tall objects
(buildings, trees) or in pits to obtain layer of points, describing only terrain relief;
• Linear objects filtering – filtering polylines/polygons, that linear size (coordinates
range by one of axes) is more or less of specified value;
• Surface objects filter – filtering points, which have fallen on particular tall objects or
pits of specific size.
The system provides possibility of vector objects topology control, i.e. search for duplicated pickets or pickets coinciding with vector objects vertices. For this the Vectors ›
Topology › Verify topology menu item is used (see the chapter ’Topology verifying’
of the ’Vectorization’ User Manual).
4.4. Filtering
4.4.1. Pickets thinning
The system provides possibility of removing of some part of automatically calculated
pickets, located densely or close to each other. For this there is pickets thinning feature.
31
DTM Generation
PHOTOMOD 6.0.2
To perform pickets thinning perform the following actions:
1. Select Vectors › Filter › Thinning. The Pickets thinning window opens.
Fig. 15. Pickets thinning parameters
2. Specify degree of pickets thinning out in percent using the slider.
3. Click OK. After that the system removes specified percent of points, in order of their
influence on quality of relief representation (the least significant points are removed
first).
4.4.2. Pickets filtering by Z-range
The system provides possibility to remove points and vertices of polylines/polygons,
which Z-coordinate falls outside specified range.
To perform objects filtering of active vector layer by elevations range, execute the following actions:
1. Select Vectors › Filter › Filter by Z-range. The Z-range filter window opens.
Fig. 16. Parameters of pickets filtering by Z
The Layer field displays a name of selected active vector layer, the Zmin and Zmax
fields show terrain elevation difference in meters, calculated by all layer objects.
2. The Filter range section by default shows values of calculated terrain elevation
difference. Specify maximal and minimal Z values in meters to consider for points
filtering.
32
DTM Generation
PHOTOMOD 6.0.2
3. Click OK. Filtration removes all points and vertices of polylines/polygons, which Zcoordinate falls outside specified range. When the filtering operation is completed
the system displays information message about number of deleted points.
Check and filtering by Z-range is also possible during automatic pickets calculation.
4.4.3. Median pickets filtering by Z
The system provides possibility of median filtering to remove single sharp spikes in
presence of smooth relief.
The median filtering contains the following sequence of actions:
1. Sequential scanning of area with vector objects by window-mask. Scanning step
is specified as window-mask halfsize.
2. Deleting points which elevation is out of range.
The range is calculated as average level of vectors elevation that fall into mask. When
calculating the range the system considers specified deviation from average level.
To execute median filtering perform the following actions:
1. Select Vectors › Filter › Median Z-filter. The Median Z filter window opens.
Fig. 17. Parameters of median pickets filtering
2. In the Mask size field specify a side size of scanning square window-mask in meters.
3. In the Threshold deviation from the mean level field specify deviation by Z in
meters from mean level of objects elevation in the mask.
4. Click OK. Filtration removes all points and vertices of polylines/polygons, which Zcoordinate falls outside specified range. When the filtering operation is completed
the system displays information message about number of deleted points.
4.4.4. Filter of adjacent point objects
Filter of adjacent point objects allows to remove pickets, in which vicinity there are
other objects located closer specified distance.
33
DTM Generation
PHOTOMOD 6.0.2
To filter adjacent pickets on active layer perform the following actions:
1. Select Vectors › Filter › Filter adjacent point objects. The Filter adjacent point
objects window opens.
Fig. 18. Parameters of adjacent point objects filter
2. Specify the Radius – maximal distance in meters to each picket, and if a pickets
falls closer that the radius value, the pickets is deleted.
3. [optional] In order to delete from two pickets just one which contains the smallest
value of one attribute (for example, if pickets vector layer was created in automatic
pickets calculation mode with preserving of quality assessment in attributes), set
the From a group of adjacent objects, delete those with lesser value of the
attribute checkbox on and select in the list an attribute to be considered during
pickets removal.
4. Click OK. Filtration removes pickets, between which the distance is less than specified. When the filtering operation is completed the system displays information
message about number of deleted points.
4.4.5. Buildings and vegetation filter
The system provides deletion, correction or recognizing pickets which have fallen on
buildings, trees, cars, in pits during automatic pickets calculation, and during filtering
of accident surges. For that filter of buildings and vegetation id used. After its work only
pickets that describe terrain relief are remain in the system.
In this document all points not lying on the relief surface (average smoothed terrain
surface), are called surges.
Filter of buildings and vegetation allows to apply step-by-step points filtering using
particular script, i.e. to apply pickets filtering in multiple passes with different parameter
sets.
It is possible to develop customized script of filter workflow or to use default script. Creating
script of buildings and vegetation filtering means specifying of passes set, order of their passing
and setup the parameters for each pass.
34
DTM Generation
PHOTOMOD 6.0.2
Step-by-step filtering allows to achieve optimal results of objects filtering on any type
of terrain to acquire pickets, that correctly describe terrain relief, and that could be used
to generate high quality DEM.
By default, the system uses standard script that includes three passes in the following
order:
1. Basic – main pass with parameters configured for filtering points not lying on the
relief surface (surges). On this step the system rejects majority of points on buildings,
and also correlators blunders (sharp spikes).
2. Additional – additional pass with parameters configured for searching surges,
missed during basic step.
3. Detailed (off by default) – the pass with parameters configured for filtering points
located on low objects, such as small buildings, cars, and so on.
After filtering the system may perform the following actions with points found (surges):
• rejecting surges from initial pickets layer;
• correction of surges found on initial pickets layer, that means editing of surges Z-coordinates;
• search for surges to analyse them with saving of found points to new vector layers
without changing initial pickets layer.
Fig. 19. Parameters of buildings and vegetation filter
35
DTM Generation
PHOTOMOD 6.0.2
The Buildings and vegetation filter window allows to specify filtering parameters and
setup a number of filter passes. The Layer field displays a name of active vector layer.
The window contains a standard toolbar.
Buttons
Function
allows to load a script of filter work from *.x-filter
resource located out of active profile resources
allows to load a script of filter work from *.x-filter
resource located in active profile resources
allows to save a current script of filter work to *.xfilter resource located out of active profile resources
allows to save a current script of filter work to *.xfilter resource located in active profile resources
allows to cancel all changes made to a script
allows to go back to a standard script that includes
two passes with default settings (regardless of which
script has been loaded)
To filter objects on surface perform the following actions:
1. Load pickets for filtration or make active a pickets layer.
To avoid loss of data, it is recommended to use a copy of initial layer during filtering.
To create a copy select Vectors › Save as and specify new name of pickets file.
If a layer contains linear or area vector objects the filter may not work properly.
2. Select Vectors › Filter › Buildings and vegetation filter. The Buildings and vegetation filter window opens.
36
DTM Generation
PHOTOMOD 6.0.2
Fig. 20. Parameters of buildings and vegetation filter
3. [optional] In order to use filtering for selected objects (points group), set the Filter
selected objects only checkbox on. Otherwise, filter is applied to all points of the
layer.
To filter a group of points, select it by mouse in 2D-window prior to start configuring the
buildings and vegetation filter.
When using filter for selected objects only, it is not recommended to set the Remove near
the border option in the Untestable points section.
4. [optional] To increase the filtering operation performance set the Copy points to
new layers before removing or correcting checkbox off. By default, the system
saves removed or corrected pickets in new vector layers used for analysis of filtering
results. These layers could be used to restore basic pickets layer (using operation
of layers merging), if the copy of initial pickets layer was not created prior to filtering
start.
If the Copy points to new layers before removing or correcting checkbox is off, it is
highly not recommended to apply filtering to initial pickets layer, since it is impossible to
restore the initial layer after filtering.
5. In the Untestable points section specify one of the following actions with untestable
pickets found after filtering:
37
DTM Generation
PHOTOMOD 6.0.2
Some points can be untestable – the points, in which vicinity there is not enough ’neighbour’
points. For example, points located on the edge of the whole layer or in areas of low
density of points (fields, forests, water bodies).
• Remove all – allows to remove all found untested pickets;
• Remove near the border – allows to set a value of distance in meters from the
edge of the whole vector layer, at which all untestable pickets will be removed.
The Distance from the border field is used to do this;
• Mark only – allows to save untested pickets to separate vector layer for further
analysis.
6. [optional] Values of average distance between pickets in active layer calculates
automatically. Also the estimated distance between points is equal to average
distance by default. Set the Recalculate parameters for average distance
between points in the layer checkbox off to set the estimated distance between
points manually.
7. Specify a number of filter passes:
• by default it is used two passes with standard parameters – Basic and Additional.
Set off checkboxes to change set of passes;
• the
button allows to add a new pass of filter;
• the
button allows to remove selected pass of filter;
• the
and
buttons allow to move selected pass up/down.
The Filter passes section contains a table of passes and buttons used to change
set of passes and their order with the following columns:
• Pass – displays pass name and checkbox used to include a pass to script or to
exclude it from filter workflow script;
• Reliable surges – displays action to be applied to well-defined surges found,
that are completely comply with specified filtering criteria;
• Doubtful surges – displays action to be applied to ambiguous surges found, in
which vicinity there is no data enough for analysis.
It is necessary to select an action to be applied to reliable and doubtful surges during
configuring of pass parameters.
8. Select a pass name and click the Edit pass parameters> > button. The Pass
section is opened and allows to display and configure the following parameters of
filter pass:
38
DTM Generation
PHOTOMOD 6.0.2
Fig. 21. Parameters of buildings and vegetation filter
• [optional] to change name of pass, input a new one in the Name field;
• the Average distance between points in the layer (in meters) and Estimated
distance between points (in meters) after filtering are displayed in fields;
• specify Near and Far distance of points mutual influence in meters to define
the circle radius. In this area points are checking for errors;
It is recommended to set the near distance (minimum circle radius) value as 3-5 values
of Average distance between points in the layer parameter.
• specify the following filtering parameters Up (above surface) and/or Down (below
surface):
○ Filter surges – allows to select pickets to be filtered: pickets on surface (high
objects) and/or pickets below surface (pits);
For filter operating it is necessary to set at least one checkbox on.
○ Spikes only – is used to reject just sharp spikes above/below surface, that
are defined by values of the Threshold slope angle for spikes and Distance
of points parameters. The rest of parameters are not considered;
39
DTM Generation
PHOTOMOD 6.0.2
In an angle between three points exceeds a value of the Threshold slope angle for
spikes parameter, then the surge is called spike.
○ Threshold slope angle for spikes – allows to specify angle of slope in relation
to selected measuring plane (above and/or below surface) to define sharp
spikes;
○ Maximum area of flat surges – allows to define maximal area of plane surges
(above/below surface) – points groups, that form smooth surfaces and are
distant from some plane of neighbour points. Generally, the points are located
on buildings roofs, and are lying on the same plane;
The filter is not applied to plane surface, which area exceeds the specified value.
○ Intermediate smoothing radius – allows to specify a sphere radius
(above/below surface), that defines a level of intermediate smoothing of surface;
○ Allowed point deviation from from smoothed surface – allows to specify
criterion, according which the filter is applied to all pickets with elevations that
differ from smoothed surface more then on specified value;
○ Maximum area of flat surges – allows to define maximal area of plane surges
(above/below surface) – points groups, that form smooth surfaces and are
distant from some plane of neighbour points.
The
button allows to go back to a standard script that includes two passes with all
default settings (regardless of which script has been loaded).
9. In the Actions section specify actions for reliable and doubtful surges found after
any step of filtering:
• Delete – deleting of pickets found from base pickets layer;
• Correct – editing in base layer Z-coordinates of points found;
• Check – saving of found pickets in a new layer without change of base layer.
Reliable corrected surges – found well-defined surges that satisfy completely to
all specified filtering criteria.
Doubtful surges – ambiguous surges in which vicinity there is no data enough to
analyse filtering operation possibility.
If the Delete or Correct option is selected, the system allows to edit base pickets
layer.
40
DTM Generation
PHOTOMOD 6.0.2
In order to save deleted or corrected pickets to new layers it is recommended to set the
Copy points to new layers before removing or correcting checkbox on.
If the Check option is selected the initial pickets layer remains unchanged, and
found reliable or doubtful surges are copied to a new layer Surges.
10. [optional] To use all cores of workstation CPU for calculation operation, the Use all
available CPU cores checkbox is set on in the system by default. It is necessary
to set the checkbox off to use only one core.
11. Click OK. The system starts DEM filtering operation. When the filtering operation
is completed the system displays information message about number of used basic
points and filtered pickets.
There are the following recommendations concerning use of buildings and vegetation
filter:
• it is recommended to use step-by-step filtering (in multiple passes with different
parameter sets);
• the passes should be formed in ascending order of the following parameters: distances
of mutual influence, radius of intermediate smoothing, and decreasing of allowed
deviation of picket from smoothed surface;
• value of intermediate smoothing radius directly describes terrain relief features, that
it why it is necessary to specify the radius value not exceeding 1500 meters;
• it is recommended to perform preliminary analysis of maximal area of flat surges on
given territory (to measure it in a stereopair window) and then to compare it with area,
calculated automatically for passes. If the measured area is bigger than calculated
one, it is necessary to increase it;
• it is highly not recommended to specify a distance of mutual influence of pickets exceeding a step between pickets in more than 20 times, since it leads to considerable
slowdown of filtering operation.
4.4.6. Filtering of linear objects
The system provides possibility to remove vector objects, linear size of which does not
satisfy the specified value.
To use linear filtering perform the following actions:
1. Define linear size of objects to be deleted.
2. Select Vectors › Filter › Selective delete objects. The Delete lines window opens.
41
DTM Generation
PHOTOMOD 6.0.2
Fig. 22. Parameters of linear objects filtering
3. Select filtering method:
• Larger than – used to delete objects, linear size of which exceeds the specified
value (in meters);
• Smaller than – used to delete objects, linear size of which is less than specified
value (in meters).
4. Click OK. Filtration removes all linear objects with size that is more or less than
specified. When the filtering operation is completed the system displays information
message about number of deleted linear objects.
4.4.7. Surface objects filter
The system provides possibility to correct blunders of correlation, obtained during
automatic pickets calculation. The filtering allows to delete points located on terrain
surface with specified typical size by XY and Z.
This filtering type is not used for objects of completely built-up area, forest belts and similar
objects.
The principle of filtering is to estimate the location and size of the contours created using
TIN, which was generated with help of initial pickets. A surge is a group of contours
that is not greater than specified size by XY and with elevations in specified range.
Surface objects filter is recommended to use to eliminate sharp spikes. For more fine filtering
it is recommended to use this filter along with buildings and vegetation filter.
To apply filter of objects on surface perform the following actions:
1. Select Vectors › Filter › Surface objects filter. The Surface objects filter window
opens.
42
DTM Generation
PHOTOMOD 6.0.2
Fig. 23. Parameters of surface objects filter
2. Specify the Typical object size in XY-plane and Typical object size along Z
axis in corresponding fields in meters.
3. Click OK to remove pickets found.
5. Triangulation irregular network (TIN)
5.1. The ’TIN’ menu
The TIN menu contains standard menu items used to load and save TIN layers, as well
as to perform different operations on creation, editing and accuracy control of TIN
building.
Table 2. Brief description of the ’TIN’ menu
The TIN menu
Create (Ctrl+N, T)
Compute border
Rebuild
Function
allows to create TIN using loaded base layers
allows to create TIN border in automatic mode
allows to rebuild TIN after editing of base layer objects
Check against adjustment points
is used to control TIN creation accuracy by triangulation points
Check against vector objects
is used to control TIN creation accuracy by vector
objects, which were not used during TIN creation
Verify topology...
is used to check topology of TIN creation
The area of a polygon on the surface
allows to calculate TIN surface area within a polygon
Calculate area
allows to calculate TIN projection area on plane and
area of TIN 3D surface
Statistic
is used to view statistic information about TIN
Simplify
is used to filtering of TIN triangles nodes using filtering of point vector objects in base layers, used for
TIN creation
Peak filter
is used to peaks filtering – searching for TIN nodes,
which Z value differs from adjacent ones significantly
Filter by Z-range
Interpolate
is used to edit TIN using Z-filter
Allows to interpolate TIN to smooth DTM in order
to build or enhance contour lines
43
DTM Generation
PHOTOMOD 6.0.2
The TIN menu
Embed objects
Export
Function
Allows to embed vector objects layer to created TIN
Contains menu items to export results of TIN creation to DXF and CSV formats
5.2. General information
Triangulation Irregular Network (TIN) – one of the models of spatially coordinated data,
used during designing of digital terrain model as elevation points in nodes of irregular
network of triangles, that corresponds to Delaunay triangulation;
Delaunay triangulation – is a triangle polygonal network, formed on a set of discretely placed
points connected to each other by disjoint straight line segments in such a way, that a circle
circumscribed around each triangle does not contain points of initial set inside.
The system also provides a possibility to build quasi-contours – isolines with specified
step, which cross sides of TIN triangles. Quasi-contours are rebuilt automatically during
editing of base layers containing vector objects. Quasi-contours are used to provide
additional quality control of TIN generating and to reveal blunders.
During saving or loading TIN all base vector layers used for TIN creation are
saved/loaded.
During TIN creation it is recommended to use breaklines – vector polylines along specific
landforms (for example, watershed lines and valley-lines), as well as linear objects of human
origin (for example, road-sides).
To perform TIN creation the system provides the following workflow:
1. [optional] Pre-regions building.
2. Defining of set of base vector layers.
3. TIN borders creation.
4. Building TIN.
The system provides the following features to work with TIN:
• different display ways;
• area calculation;
• TIN re-build after base layers change;
• filtering of base layers, used for TIN creation;
• accuracy control of TIN creation;
44
DTM Generation
PHOTOMOD 6.0.2
• export TIN to exchange formats.
Fig. 24. Source data for TIN creation
5.3. TIN creation
5.3.1. Creation pre-regions for a block
The system provides possibility to create block pre-regions by images frames or by
stereopair frames to allow mutual project processing during vectorization. Pre-regions
created by stereopairs also allows to considerably speed up automatic pickets calculation
and generation of dense relief model due to reducing of number of block images overlap
areas.
Pre-regions – vector layer which consists of polygons, drawn by images block.
Perform the following actions to create pre-regions:
1. Select Block › Build pre-regions. The Create pre-regions window opens.
45
DTM Generation
PHOTOMOD 6.0.2
Fig. 25. Parameters of pre-regions creation
2. In the Use frames of section select one of the following ways of pre-regions creation:
• stereopairs to create pre-regions using overlap areas of two stereopair images;
When using stereopairs frames the system fills in polygons attributes automatically as
follows: region_image_code (with the left image code), region_image_name (with the
left image name), region_image_code_2 (with the right image code), region_image_name_2 (with the right image name).
• images to create pre-regions by near-nadir areas of each image.
When using images frames the system fills in polygons attributes automatically as follows:
region_image_code, region_image_name.
3. Select a way to create pre-regions using selected frames: Using Voronoy diagram
or version 4.x algorithms earlier system’s version algorithm (PHOTOMOD 4.x).
4. [optional] Set the Remove slivers slider (at min value the pre-regions are built
considering narrow strips; at max value the pre-regions is created without narrow
strips).
5. Click OK to create pre-regions. The system creates a new vector layer with preregions.
To load, edit, save and close of pre-regions layer the system provides standard too for
work with vector objects (see description in the ’Vector objects editing’ chapter of the
Vectorization User Manual).
46
DTM Generation
PHOTOMOD 6.0.2
Fig. 26. Pre-regions created using images frames
47
DTM Generation
PHOTOMOD 6.0.2
Fig. 27. Pre-regions created using stereopairs frames
5.3.2. Loading base layers for TIN creation
Prior to TIN creation it is necessary to define a set of base layers used to create a TIN.
The system performs TIN creation using layers, containing the following data:
• vector objects (points, polylines and polygons);
• breaklines – polylines/polygons, drawn along lengthy relief features (edges, watershed
lines and valley-lines), as well as along roads;
• set of regular pickets – point vector objects, located on relief surface by regular grid
or in arbitrary order;
• triangulation points – tie, check, GC points, acquired on step of aerial triangulation
(see the ’Aerial triangulation’ User Manual).
In order to load vector objects perform the following actions:
1. Choose Vectors › Load or click the
opens.
button of the main toolbar. The Open window
48
DTM Generation
PHOTOMOD 6.0.2
Fig. 28. Vector layer loading
2. Select one or multiple vector files in active profile resources with x-data extension.
3. [optional] To disable saving and rewriting of selected file, set the Open read only
checkbox on.
4. [optional] Set method of objects coordinates recalculation For different coordinate
systems transforms via – using pixel or geodetic coordinates (see details in the
’General system’s parameters’ User Manual).
5. Click the Open button. If one or multiple vector layers are already loaded to active
layer, then during loading of new vector layer the window of loading type is opened.
Fig. 29. Vector layer loading
The system provides the following possibilities of new layer loading to existing
vector layer:
• Clear layer and continue loading into it – vector data of active layer is replaced
by data from loading layer;
• Create new layer and load data into it – vector data is loaded to a new layer;
49
DTM Generation
PHOTOMOD 6.0.2
• Add new data to Vectors layer without unloading existing data – during
loading vector data is added to objects of active vector layer.
If some point of vector objects layer cannot load, the system shows warning about failed
loading of this points. In this case vector layer is loaded without coordinates of this point.
When it is necessary to load two or more vector files at once, the system suggests
the following ways of loading:
• Clear layer and load all files into it – vector data of active layer is replaced by
data from loading layers;
• Load all into one new layer – vector data is loaded to a single new vector layer;
• Create separate layer for each file – vector data of each file are loaded to
separate layers;
• Load all layers into Vectors without unloading existing data – during loading
vector data is added to objects of active vector layer.
Fig. 30. Vector layer loading
Corresponding Vector layers are displayed in Manager.
If vector data layer is saved to different coordinate system or in a project with different adjustment results, the system recalculates coordinates automatically and during
loading produces information message, that coordinates were recalculated.
50
DTM Generation
PHOTOMOD 6.0.2
Fig. 31. Coordinates recalculating during vector layer loading
TIN is rebuilt automatically during editing of base layers containing vector objects.
TIN layer is closed during closing of one of base layers.
To use a layer containing triangulation points, perform the following actions:
1. Choose Vectors › Create layer from triangulation points. The Load triangulation
points window opens.
Fig. 32. Load triangulation points to a project
2. [optional] To export triangulation points from GCP list (see the ) the Ground control
point catalogue checkbox is set by default.
3. [optional] To export triangulation points from the Block scheme layer in 2D-window,
the Block scheme checkbox is set by default.
4. [optional] To export adjusted points coordinates from GCP catalogue the Adjustment
results checkbox is set by default.
5. Click OK. The system displays information window containing information about
added or skipped points.
6. Click OK. The Triangulation points (Vectors) layer is created. Vector point objects
(triangulation points) are displayed on block scheme in 2D-window.
51
DTM Generation
PHOTOMOD 6.0.2
Tie points are shown in 2D-window by yellow color; GCP – by red.
There is a possibility to save triangulation points layer to file of *.x-data format to active
profile resources.
5.3.3. TIN borders creation
The system provides possibility of TIN borders creation manually or automatically.
To create TIN borders manually, create the border polygons on a separate layer and
choose this layer in the list Use polygons from layer of the Create TIN window.
Perform the following actions to create TIN borders in automatic mode:
1. Choose TIN › Compute border.... The Compute TIN border window opens.
Fig. 33. The ’Compute TIN border’ window
2. [optional] In the Source data section the checkboxes near all opened layers are
set on by default, that are used for TIN borders creation. Set unused checkboxes
off, if some layers opened are not used for TIN border creation.
3. [optional] Choose the type of TIN border:
• Convex;
• Nonconvex. To select smoothing level of nonconvex border move the Smoothing
slider.
52
DTM Generation
PHOTOMOD 6.0.2
4. [optional] In order to split TIN border into areas depending on source data, set the
Several regions checkbox on and move the Separation slider to define maximal
distance between initial vector objects, used to create TIN border.
5. Click OK. The system starts to create a TIN border in a new TIN border layer.
5.3.4. Building TIN
Perform the following actions to build TIN:
1. Choose the TIN › Create (Ctrl+N, T) or click the
toolbar. The Create TIN window opens.
button of the DEM additional
Fig. 34. The ’Create TIN’ window
2. [optional] By default in the Source data section set on checkboxes for all opened
layers to use them in TIN creation. Set the checkboxes off, if some layers opened
are not used for TIN creation.
To select all available layers click the
button, to unselect all layers – click the
To invert selecting layers it is used the
button.
button.
3. [optional] In the Quasi-contours section the Display checkbox on and in the
Starting level filed specify minimal Z level (Zmin), from which to start quasi-contours
creation.
4. [optional] Specify the Step of quasi-contours creation in meters.
53
DTM Generation
PHOTOMOD 6.0.2
5. In the Border section set on the following:
• Convex – the convex border of TIN is created;
It is recommended to create convex border, when some part of vector objects does not
cover all area of TIN creation (for example, when there are lakes and rivers on large
scale images).
• Nonconvex – the nonconvex border of TIN is created;
It is recommended to place the Smoothing slider in the middle and smoothly move it
to the left to get the best results.
• Use polygons from layer – to create a TIN with convex border in limits of area
of polygon(s) selected in the layers list. Select from the list a layer containing
polygons, that will be used as a border. In order to define a border of TIN creation
area, just from selected polygons, set the Selected only checkbox on.
6. Click OK. The TIN is created in the new TIN layer.
5.4. TIN display
The system provides possibility to setup TIN display in 2D-window.
In order to make settings choose menu item Service › Settings or click the
button
of the main toolbar. The Settings window opens. It consists of a set of tabs used to
setup various parameters.
The TIN tab is used to setup parameters of TIN display
54
DTM Generation
PHOTOMOD 6.0.2
Fig. 35. Settings of TIN display
The Color TIN by elevation checkbox is set in the system be default, as a result TIN
is displayed as grid of triangles colored by height. Clear the Color TIN by elevation
checkbox to display all TIN triangles by the same color, defined in the Manager panel
for TIN layer.
The Display optimization section contains the following parameters used to improve
performance and to display a TIN as solid fill:
• Display fill instead of triangles for TIN containing more than specified number
of triangles;
• Display solid fill for TIN when window contains more than specified number of triangles.
The Antialiased display checkbox is used to smooth TIN and quasi-contours for improving visual perception.
When TIN is displayed as solid fill quasi-contours are not displayed.
The Triangulation precision parameter is intended for filtering of errors of TIN creation
using vector objects, which contain closely-spaced nodes. A value in the Triangulation
precision field is used to specify minimal distance between points, at which the points
are considered as different nodes, not the same one.
55
DTM Generation
PHOTOMOD 6.0.2
To save computer memory when editing large datasets set the Do not build triangles
when layer is created.
If it is necessary to display TIN as triangles when the Do not build triangles when layer is
created checkbox is on, in the Display optimization section input the Display fill instead of
triangles for TIN containing more than parameter with value that exceeds the previous one.
The system provides a possibility to display TIN as three-dimension relief model, to do
this select Window › 3D window.
5.5. TIN loading
In order to load a TIN perform the following actions:
1. Select TIN › Load (Ctrl+O, T) or click the
The Open window opens.
button of the DEM additional toolbar.
Fig. 36. TIN loading
2. Select one or multiple TIN files in active profile resources with x-tin extension.
3. [optional] Set method of objects coordinates recalculation For different coordinate
systems transforms via – using pixel or geodetic coordinates (see details in the
’General system’s parameters’ User Manual).
4. Click the Open button. After that the TIN layer is loaded along with base vector
layers. If one or multiple TIN containing layers are already loaded to active layer,
then during loading of a new layer the window of loading type is opened.
56
DTM Generation
PHOTOMOD 6.0.2
Fig. 37. TIN layer loading
The system provides the following possibilities of new layer loading to existing TIN
layer:
• Clear layer and continue loading into it – vector data of active layer is replaced
by data from loading layer;
• Create new layer and load data into it – vector data is loaded to a new layer.
The system provides a possibility of quick access to recently loaded TIN files. To do
this use the TIN › Recent menu item.
5.6. TIN saving
To save and rewrite active TIN layer select TIN › Save or click the TIN layer name by
mouse right button in the Manager and choose the Save in right-click menu.
Layer containing TIN is saved in the file with x-tin extension. The file contains paths
to base layers used to create TIN, and a step of quasi-contours in meters.
To save active TIN layer with new name select TIN › Save as... or click the TIN layer
name by mouse right button in the Manager and choose the Save as... in right-click
menu, specify file name and destination in active profile resources.
During saving a layer containing TIN, base layers used for TIN creation are saved
automatically.
During closing of one of base layers, the system suggests to save a layer containing
TIN to active profile resources, after that the TIN layer is closed automatically.
5.7. TIN info
5.7.1. Brief TIN info
To get brief information about TIN layer, click the TIN layer name by mouse right button
in the Manager and choose the Information in right-click menu. After that the system
displays information window which includes the following information about the layer:
• layer name;
57
DTM Generation
PHOTOMOD 6.0.2
• full path to layer file;
• presence of data and changes in the layer;
• possibility to change the layer;
• coordinates of TIN border nodes, including Z-coordinate;
• number of nodes in base layers;
• layer coordinate system.
Fig. 38. TIN layer info
5.7.2. General TIN info
In order to obtain detailed information about TIN layer, choose TIN › Statistics. The
TIN – statistics window opens.
58
DTM Generation
PHOTOMOD 6.0.2
Fig. 39. The ’TIN – statistics’ window
The General section includes brief information about TIN layer.
The Details section contains information about distribution range of the following data
on a layer:
It is recommended to use this information to search for blunders on TIN layer.
• Triangles distribution on area (in square meters);
• Nodes distribution along Z axis (in meters);
• Triangles distribution by min. angle (in degrees);
• Triangles distribution by max. angle (in degrees).
Below is a table of the data distribution, which contains the following lines:
• Min and Max – minimal and maximal data range;
• (for example, 28588.2 - 31764.6) – data distribution in percentage.
5.7.3. TIN area info
The system provides possibility to calculate TIN surface area.
59
DTM Generation
PHOTOMOD 6.0.2
To calculate TIN surface area within polygon, select the polygon on base layer or create
a new polygon and select TIN › Polygon area on surface. After that the system opens
information window with information about value of TIN area within selected polygon.
Fig. 40. The area of a polygon on TIN surface
In order to calculate area of TIN projection on a plane and area of TIN 3D surface, select
TIN › Compute area. After that the system displays information window with values of
TIN areas:
Fig. 41. TIN surface area
5.8. TIN re-building
After editing of base layer objects (see the ’Vectorization’ User Manual) the system allows
to perform TIN re-build operation.
TIN layer is not editable. To change TIN layer it is necessary to edit base layers used for TIN
creation.
In order to re-build TIN considering vector objects of new vector layer, select Vectors ›
Load, select a file and click the Open button. The Loading window opens.
Fig. 42. Vector layer loading
60
DTM Generation
PHOTOMOD 6.0.2
The system provides the following possibilities of new layer loading to existing vector
layer:
• Clear layer and continue loading into it or Add new data to Vectors layer without
unloading existing data – allows to load vector objects to a base layer. After that
the TIN is rebuilt automatically;
• Create new layer and load data into it – allows to load vector objects to a new
layer. Create a TIN using new layer as a base one.
To re-build TIN considering changes made in vector objects located in base layers,
perform the following actions:
1. Choose TIN › Rebuild or click the
button of the DEM additional toolbar. The TIN
border smoothing window opens.
Fig. 43. TIN border smoothing
2. Set the following parameters:
• Convex border – a border is created with connecting of outer boundary pickets
of selected layer in such a way that TIN has the most smooth border;
It is recommended to create convex border, when some part of vector objects does not
cover all area of TIN creation (for example, when there are lakes and rivers on large
scale images).
• Nonconvex border – only closest border pickets of a layer are connected during
border creation.
The Smoothing slider position allows to specify distance between border pickets, and
if the distance between pickets is less than the specified, the border will be passed
through them. In the leftmost position of the slider pickets are connected sequentially,
and in the rightmost one the border looks like convex.
It is recommended to place the Smoothing slider in the middle and smoothly move it
to the left to get the best results.
3. Click OK to perform TIN re-build according to changed data.
61
DTM Generation
PHOTOMOD 6.0.2
5.9. Insert objects into TIN
The system provides possibility to insert objects into existed TIN layer.
It is used, e.g. to display walls of buildings vertically in the TIN layer.
To insert vector objects into TIN layer is used the TIN › Insert objects menu item.
Fig. 44. Insert objects to TIN
To choose vector file are used the following buttons:
•
– allows to select all files;
•
– allows to unselect all files;
•
– allows to invert files selection.
New layer creates when process complete. If the Binding threshold checkbox is set
on, the new layer with inserted objects and TIN is created. Otherwise, only vector objects
are created in new layer.
Threshold snapping allows to set the value in meters. If the value less than threshold,
objects are not insert.
5.10. Accuracy control of TIN creation
5.10.1. Check against adjustment points
If triangulation points layer was not used during TIN creating, the system provides
possibility to perform accuracy control of TIN creation by triangulation points, acquired
on aerial triangulation step. To do this use the TIN › Check against adjustment points
menu item.
62
DTM Generation
PHOTOMOD 6.0.2
The Accuracy control window includes a table of all points (GCP/check/tie), acquired
on on aerial triangulation step (see the ’Aerial triangulation’ User Manual).
Fig. 45. Accuracy control using triangulation points
The top toolbar of the window is used to setup of triangulation points display in the list:
Gr.control, Check, Tie, Targeted, Measured only (triangulation points with Z coordinate
calculated during TIN creation), Adjusted.
The Used points field is used to display number of points used for calculation of TIN
deviation by Z-coordinate (in the Use column the
is set).
The table of triangulation points contains the following columns:
• Name – point number;
• Type – point type: GCP, check or tie point;
• Use – Data about point use during calculating of TIN deviation by Z-coordinate, or
about adjustment:
○
– the triangulation point was used;
○
– the triangulation point was not used;
○
– the triangulation point cannot be used, since it was not used for adjustment.
• X, Y, Z – adjusted coordinates of triangulation points;
• Ez – value of TIN deviation from the triangulation point by Z-coordinate.
Status panel is used to display values of root mean square error (RMS) and a value of
maximal error of TIN deviation by Z-coordinate (Max).
The
button allows to display in the list a point with maximal error of TIN deviation by
Z-coordinate.
The
button allows to display detailed report on accuracy control.
63
DTM Generation
PHOTOMOD 6.0.2
Fig. 46. Report on accuracy control using triangulation points
The top panel of the Report window contains the following buttons:
•
– allows to close report window;
•
– allows to save a report to file system of Windows;
•
– allows to change font, style, size, and color of report text;
•
– allows to print a report.
5.10.2. Check TIN against vector objects
The system allows to control TIN creation accuracy by vector objects, which were not
used during TIN creation Control operation provides values of TIN deviation from vector
objects vertices by Z-coordinate.
To control TIN creation against vector objects perform the following actions:
1. Select TIN › Check TIN against vector objects. The Parameters of check TIN
by vectors window opens.
Fig. 47. Parameters of check TIN by vectors
64
DTM Generation
PHOTOMOD 6.0.2
2. Select display parameters of points list:
• Display the worst..values – allows to display a list of vector objects vertices
with worst deviations from TIN by Z-coordinate;
• Display the the shift more than – allows to display a list of vector objects vertices
with deviation from TIN by Z-coordinate, that exceeds specified.
3. Click OK. The system starts operation of comparing of TIN deviation values from
vector objects vertices by Z-coordinate. After that the Check TIN using vector
objects window opens.
Fig. 48. Results of control check of TIN against vector objects
In order to export points list to file with csv extension, click the
button.
4. Select a point in the list by mouse click. After that marker is placed to the crossing
point and is displayed in 2D-window.
5.10.3. Verifying of TIN topology
The system provides possibility to verify TIN topology.
The topology concept is one of the key terms used during quality assessment of created
maps. Throughout this documentation, the topology is referred to as set of functions
and operations, that define mutual location of vector objects and are used to create topologically correct vector data.
Topology (from Greek topos - place) – a branch of mathematics that studies the phenomenon
of continuity in the most general form, in particular, the properties of space, which remain unchanged under continuous deformations, for example, the connectivity.
Check of TIN topology means searching for closely placed triangles nodes of TIN and
their correction (correction of their corresponding points or vertexes of polylines/polygons
of base vector layers). Topology correction includes deleting or moving of closest TIN
nodes.
65
DTM Generation
PHOTOMOD 6.0.2
In order to start TIN topology check, perform the following actions:
1. Select TIN › Verify topology.... The Parameters window opens.
Fig. 49. Parameters of topology check
2. In the Metrics list specify whether 2D or 3D space is used to search for topology
errors.
3. In the Max. distance field define a distance between nodes, below which the nodes
are considered closest.
4. Click OK. The system starts operation of search for closest TIN nodes. When the
search is completed the system opens the Errors correction window.
Fig. 50. Correction of topology errors
5. Select a point in the list by mouse click. After that marker is placed to the point and
is displayed in 2D-window.
6. Select a way of topology correction: Combine points or Delete points.
7. To correct closest TIN nodes perform one of the following actions:
• ’link’ nodes using snapping (see the ’Vectorization’ User Manual);
• to correct topology for all points in the list click the
button;
• to correct topology only for selected points in the list click the
66
button.
DTM Generation
PHOTOMOD 6.0.2
After correction of TIN closest nodes topology the erroneous nodes are combined
into a single node with average coordinates value, or are deleted.
5.11. Export TIN
5.11.1. Export TIN to DXF
The system provides possibility to export of TIN layer to DXF format for its further use
in third-party software.
In order to export TIN to DXF format perform the following actions:
1. Select TIN › Export › DXF.... The Export to DXF window opens.
2. Choose a folder to place a file to file system of Windows button.
3. Click the Save button. The Export to DXF window opens.
Fig. 51. Parameters of export to DXF format
4. [optional] In the Objects for export section to export vertices, edges and triangles
of TIN the Vertices, Edges, Triangles checkboxes are set on by default. Clear the
checkboxes to export just particular kind of objects.
5. Set the following parameters:
• Export as polygons – allows to export objects as polygons;
• Export as 3D Face – allows to export top face of an object;
• Export as Polyface Mesh – allows to export object as polyhedral object.
6. [optional] In order to swap coordinate system (left/right) during TIN export, set the
Swap X Y checkbox.
If the Swap X Y checkbox is off, the initial data will be imported in the right coordinate
system. Otherwise, in the left coordinate system.
67
DTM Generation
PHOTOMOD 6.0.2
7. Click OK to complete the export operation.
5.11.2. Export TIN to CSV
The system provides possibility of TIN export to CSV format. CSV format is exchange
text format with csv extension, which is supported by major applications in different industries. It is used as exchange format when special geospatial data formats are not
applicable for some reason.
In order to export TIN to CSV format perform the following actions:
1. Select TIN › Export › CSV.... The Export to CSV window opens.
2. Choose a folder to place a file to file system of Windows button.
3. Click the Save button. The Export to CSV window opens.
Fig. 52. Parameters of export to CSV format
4. In the Export section select what kind of objects it is necessary to export: Points
or Points and line vertices.
5. The Line template field displays the list of fields, contained in each line of exported
CSV file: To clear the field, click the Clear the list
button.
68
DTM Generation
PHOTOMOD 6.0.2
6. [optional] In order to export a line from the Line template field, set the First line
with field names checkbox on.
7. [optional] In order to change number of decimal places in coordinates to be exported,
set the Maximum decimal places: checkbox on and input needed value.
8. In the Available fields list select required field name and click the Add selected
field
button or click the Add all fields
button, to transfer all field names. After
that all or selected field names are moved to the Used fields list.
To cancel field name selection click the
button or click the
button to cancel moving
all field names. To move selected field to the list bottom, click the
button, and to move
selected field to the list top click the
button.
9. In the Decimal separator section select point or comma to be used to separate
coordinates.
10. [optional] In order to limit required parts of exported list of coordinates by quotes,
in the Enclose in quotes section choose one of the following options:
• Auto – allows to limit by quotes the fields, which are located in the file to be exported;
• All text fields – allows to limit by quotes only the fields, which contain text information;
• All fields – allows to limit by quotes each field, which is located in the exported
file.
11. In the Field separator section choose, what is used to separate fields: comma,
space, tab, semicolon or other delimiters.
If the field separator is selected as a comma, it is not recommended to specify the decimal
separator as a comma, since objects with incorrect coordinates will be created after import
operation.
12. [optional] To define standard parameters set the Transform reference system
checkbox on (see the chapter Transform reference system of objects in the ’Vectorization’ User Manual);
13. Click OK to complete the export operation.
69
DTM Generation
PHOTOMOD 6.0.2
5.12. Filtering
5.12.1. Simplifying
The system allows to filter TIN triangles nodes using filtering of point vector objects in
base layers, used for TIN creation.
TIN filtering is performed considering breaklines.
To perform pickets simplifying perform the following actions:
1. Create or load TIN.
2. Select TIN › Simplify. The Simplify TIN window opens.
Fig. 53. Parameters of TIN simplifying
The window displays a statistics about source TIN: total Number of nodes in network and Mean distance between nodes (average length of TIN edges) in meters.
3. Set one or multiple checkboxes on and specify Thinning parameters:
• Maximum deviation from the source model – maximum deviation between
source and thinned models by Z in meters;
• Mean distance between nodes – distance between nodes after thinning in
meters.
4. Click OK. When the filtering operation is completed the system displays information
message about number of deleted nodes.
Deleting of TIN nodes means removing of vector points from base layers. The filter works
with all base layers as with a single editable layer.
To cancel thinning results the Undo log is used, as well as the
main toolbar.
70
and
button of the
DTM Generation
PHOTOMOD 6.0.2
5.12.2. Peak filter
The system provides possibility to filter peaks. This feature is used to search for TIN
nodes, which Z value differs considerably from adjacent nodes, so the system defines
nodes with sharp local peaks. Peaks filtering allows to remove part of nodes, that form
the most ’spiky’ pyramids.
TIN filtering is performed considering breaklines.
Perform the following actions to filter peaks:
1. Create or load TIN.
2. Select TIN › Peak filtering. The Peak filtering window opens.
Fig. 54. Peaks filtering
The histogram shows the relative distribution of TIN nodes with different coefficients
of peaks. A node with a value of peak factor, that equals 0, is assumed error-free.
A node with maximal probability of error (in accordance with selected calculation
method) have a peak factor that equals 100.
3. Specify Peak factor threshold or move using mouse button the red line on the
diagram to filter nodes, that fall into areas with values exceeding specified (behind
the red line).
71
DTM Generation
PHOTOMOD 6.0.2
4. In the Filter settings section select Factor calculation method in the list:
• By minimum normal inclination – peak factor is proportional to the minimum
factor by triangles surrounding the vertex, to the value of angle between the
normal to the plane of the triangle and Z axis;
• By maximum normal inclination – peak factor is proportional to the maximum
factor by triangles surrounding the vertex, to the value of angle between the
normal to the plane of the triangle and Z axis;
• By mean normal inclination – peak factor is proportional to the mean factor by
triangles surrounding the vertex, to the value of angle between the normal to the
plane of the triangle and Z axis;
• By sum normal projection – peak factor is inversely proportional to module
projection of the vector sum of the normals to triangles surrounding the vertex
on Z axis;
• By sum normal abs.value – peak factor is inversely proportional to module
projection of the vector sum of the normals to triangles surrounding the vertex.
5. Click the Refresh button. The bottom part of the window shows a list of nodes, that
correspond to peaks with specified parameters.
6. Select a node in the list by mouse click. After that marker is placed to the selected
node and is displayed in 2D-window.
To select nodes group it is possible to use Ctrl or Shift keys. The Select all button allows
to select all nodes found.
7. Click the Delete button to delete pickets from base layer selected in the list. After
that the TIN is rebuilt automatically.
Deleting of TIN nodes means removing of vector points from base layers. To cancel thinning
results the Undo log is used, as well as the
and
button of the main toolbar.
5.12.3. TIN filtering by Z-range
The system provides possibility to edit TIN using Z-filter. During filtering by Z-range the
system performs deleting of vector points, and polylines/polygons vertices (that correspond to TIN nodes), which Z-coordinate is out of the range.
TIN filtering is performed considering breaklines.
To perform filtering by Z-range of vector objects of base vector layers, used for TIN
creation, perform the following actions:
72
DTM Generation
PHOTOMOD 6.0.2
1. Create or load TIN.
2. Select TIN › Filter › Filter by Z-range. The Z-range filter window opens.
Fig. 55. Parameters of TIN filtering
The Layer field displays a name of loaded TIN layer, the Zmin and Zmax fields
show terrain elevation difference in meters, calculated by all TIN nodes.
3. The Filter range section by default shows values of calculated terrain elevation
difference. Specify maximal and minimal Z values in meters to consider for points
filtering.
4. Click OK. Filtration removes all points and vertices of polylines/polygons, which Zcoordinate falls outside specified range.
Deleting of TIN nodes means removing of vector points from base layers. To cancel thinning
results the Undo log is used, as well as the
and
button of the main toolbar.
5.12.4. Smooth TIN interpolation
The system provides possibility to interpolate TIN network for DEM smoothing for creating or improving contour lines, if contour lines layer was one of the base layers for
TIN creation.
TIN filtering is performed considering breaklines.
Perform the following actions to perform TIN interpolation:
1. Create or load TIN.
To interpolate TIN within a grid it is necessary to create or load the grid prior to interpolation
operation.
2. Select TIN › Interpolate. The Smooth TIN interpolation window opens.
73
DTM Generation
PHOTOMOD 6.0.2
Fig. 56. Parameters of TIN interpolation
3. Specify the Interpolation scope:
• Whole TIN area;
• Within grid limits – the system uses parameters of regular grid with specified
step.
4. Specify the Interpolation type:
• Linear – TIN condensation using points adding on triangles surface;
• Smooth model – using second-order surface for interpolation by specified
number of points in the neighbourhood of the triangle, where a grid node is located.
For smooth model specify a number of points used to perform interpolation in
the Use neighbourhood of..points field.
It is recommended to specify a value not exceeding 100 points in the Use neighbourhood of..points field.
5. Set the Step of interpolation in meters.
6. Select a destination of interpolation results save:
• Active vector layer – the active vector layer will be rewritten;
• New vector layer – interpolation results will be copied to a new vector layer.
74
DTM Generation
PHOTOMOD 6.0.2
The Include this layer into TIN and rebuild the TIN checkbox is set on by default, that allows to update TIN network automatically according to filtering results.
7. Click OK. After that the system performs interpolation of base vector layer and
displays results depending on selected parameters.
6. Contour lines
6.1. Generation contour lines by TIN
The system provides possibility to create contour lines – vector lines, joining points with
the same terrain elevation – by irregular spatial triangles network (TIN).
To create contour lines by TIN, perform the following actions:
1. Load TIN layer.
2. Choose Vectors › Build contours › From TIN... or use the Ctrl+N, C hotkeys. The
Create contours by TIN window opens.
Fig. 57. Parameters of contour lines generation by TIN
3. [optional] Input minimal elevation level (Zmin), which will be zero-level for contours
creation, to the Starting level field.
In order to obtain information about elevation difference (Zmin, Zmax), right click on the
TIN layer in the Manager and select the Information item, or select Edit › Active layer ›
Layer information. The system displays the information window that contains information
about the layer.
4. In the Interval field specify contours interval in meters. Interval of basic contours
is calculated automatically and is displayed in the Basic contours field. If the Intermediate contour lines checkbox is off, interval of basic contours equals to contours
interval.
75
DTM Generation
PHOTOMOD 6.0.2
5. [optional] To create index contour lines the Index contour lines checkbox is on by
default. Set the checkbox off to cancel index contour lines creation.
The interval of index contour lines is calculated considering the Basic contours parameter
and equals to five intervals of basic contours.
6. [optional] In order to create intermediate contours, set the Intermediate contour
lines checkbox on.
The interval of intermediate contour lines is calculated considering the Basic contours
parameter and equals to half of basic contours interval.
7. [optional] In order to create contours as smoothed curves, set the Smoothing
checkbox on and specify a level of smoothing using the slider.
8. [optional] In order to cancel creation of short contours, set the Skip contour lines
shorter than checkbox on and input minimal contour length in meters.
9. Click OK. After that the system starts to create contours in a new layer Contours.
To edit created contours select Window › Contours classifier table (see Section 6.5).
6.2. Contours creation in batch mode
The system provides possibility to create contour lines in batch mode. Batch mode allows
to create multiple files of contour lines simultaneously and to save them to specified
folder.
Contours creation in batch mode is possible in 64-bit system version only.
In order to build contours using TIN in batch mode perform the following actions:
1. Choose Vectors › Build contours › In batch mode.... The Create contours in
batch mode window opens.
76
DTM Generation
PHOTOMOD 6.0.2
Fig. 58. Parameters of contours creation in batch mode
2. Choose a folder containing vector objects in resources tree.
The
button allows to display all available resources in nested files. The
to refresh part of the window with resources.
The
button allows
button allows to show a list with 10 recently selected resources.
3. Select file with contours in the list and click the
The
and
objects, the
button to add a layer.
buttons allow to add to the list or remove from it all added files with vector
button allows to remove selected file from the list.
4. Repeat the 2 and 3 steps to add next files with vector objects.
5. Click the
resources.
button in the Working folder field and select a folder in active profile
6. Click the
button in the Output folder filed and select a folder in active profile
resources to save output contour lines.
77
DTM Generation
PHOTOMOD 6.0.2
7. Configure necessary parameters of contours creation like for Generation contour
lines by TIN.
8. Click OK to start contour lines creation in batch mode.
To edit created contours select Window › Contours classifier table.
6.3. Generation contour lines by DEM
The system provides possibility to create contour lines by digital elevation model (DEM).
In order to build contours using DEM perform the following actions:
1. Load a DEM layer.
2. Choose Vectors › Build contours › From DEM.... The Contours creation parameters window opens.
Fig. 59. Parameters of contour lines generation by DEM
3. [optional] In order to apply operation of DEM smoothing prior to contours creation,
set the Smooth checkbox on in the DEM section. Specify smoothing level in the
Smooth level field (maximal smoothing is applied at 1 value).
During smoothing the system uses information about adjacent nodes in each DEM node.
In order to specify number of adjacent nodes of DEM, select the Aperture size in the list.
Min. elevation and Max. elevation – display information about elevation difference
(Zmin, Zmax) in DEM.
78
DTM Generation
PHOTOMOD 6.0.2
4. [optional] Input minimal elevation level (Zmin), which will be zero-level for contours
creation, to the Starting level field.
In order to obtain information about about elevation difference (Zmin, Zmax), select Edit ›
Active layer › Layer information or click the DEM layer by mouse right button in the
Manager and select Information. The system displays the information window that contains
information about the layer.
5. In the Interval field specify contours interval in meters. Interval of basic contours
is calculated automatically and is displayed in the Basic contours field. If the Intermediate contour lines checkbox is off, interval of basic contours equals to contours
interval.
6. [optional] To create index contour lines the Index contour lines checkbox is on by
default. Set the checkbox off to cancel index contour lines creation.
The interval of index contour lines is calculated considering the Basic contours parameter
and equals to five intervals of basic contours.
7. [optional] In order to create intermediate contours, set the Intermediate contour
lines checkbox on.
The interval of intermediate contour lines is calculated considering the Basic contours
parameter and equals to half of basic contours interval.
8. [optional] In order to create contours as smoothed curves, set the Smoothing
checkbox on and specify a level of smoothing using the slider.
9. [optional] In order to cancel creation of short contours, set the Skip contour lines
shorter than checkbox on and input minimal contour length in meters.
10. Click OK. After that the system starts to create contours in a new layer Contours.
To edit created contours select Window › Contours classifier table.
6.4. Contours creation from smooth DTM
The system provides possibility to create contour lines as smoothed curve lines with
specified accuracy. Using this method of contours creation allows to avoid contours
intersection.
Source data for contours creation are vector objects obtained after stereo vectorization.
If necessary the system allows to create a polygon and to use it then as a border of
contours creation area.
In order to build contours from smooth DTM perform the following actions:
79
DTM Generation
PHOTOMOD 6.0.2
1. Load a layer containing vector objects.
2. Choose Vectors › Build contours › Smooth model.... The Build contours from
smooth DTM window opens.
Fig. 60. Parameters of contours creation from smooth DTM
3. In the Source layers section set the checkboxes on next to opened layers used
for contours creation.
4. In the Working area border layer specify border of contours creation area:
• Rectangle;
• Convex;
• Use polygons from layer – select from the list a vector layer that contains
polygons used as working area border.
In order to define a border of contours creation area, just from selected polygons, set
the Selected only checkbox on.
80
DTM Generation
PHOTOMOD 6.0.2
5. In the Model accuracy field input acceptable deviation of contours elevation values
from source vector layer in meters.
The Model accuracy parameter should be specified based on errors values obtained
during creation of vector objects using correlator in stereomode.
6. In the Contours accuracy field input maximal deviation of contours from DEM by
Z.
7. [optional] Input minimal elevation level (Zmin), which will be zero-level for contours
creation, to the Starting level field.
In order to obtain information about elevation difference (Zmin, Zmax), right click on the
TIN layer in the Manager and select the Information item, or select Edit › Active layer ›
Layer information. The system displays the information window that contains information
about the layer.
8. In the Interval field specify contours interval in meters. Interval of basic contours
is calculated automatically and is displayed in the Basic contours field. If the Intermediate contour lines checkbox is off, interval of basic contours equals to contours
interval.
9. [optional] To create index contour lines the Index contour lines checkbox is on by
default. Set the checkbox off to cancel index contour lines creation.
The interval of index contour lines is calculated considering the Basic contours parameter
and equals to five intervals of basic contours.
10. [optional] In order to create intermediate contours, set the Intermediate contour
lines checkbox on.
The interval of intermediate contour lines is calculated considering the Basic contours
parameter and equals to half of basic contours interval.
11. [optional] To create contours with number of nodes more then specified value, the
Minimal points number in a contour checkbox is set on by default. Input a number
of nodes to the input field to exclude contours with less number of nodes.
12. [optional] To create contours as arc segments (curves) set the As smooth curves
checkbox on.
13. Click OK. After that the system starts to create contours in a new layer Contours.
81
DTM Generation
PHOTOMOD 6.0.2
6.5. Contour lines editing
To edit contours display parameters the system provides Window › Contours classifier table menu item. Display parameters are saved and applied during creation or
loading of new contours layer.
Fig. 61. Contours classifier
The Contours window allows to configure the following parameters:
•
– allows to hide/show selected type of contours in 2D-window;
•
– allows to select a type of contours to be edited;
• Layer color – allows to configure color to display selected contours type;
To change contour color, double click the Layer color button. The Color window opens.
Choose contour color and click OK.
• input field allows to specify width of selected contours type, that remains the same
during scale change.
To change a contour width, specify a value in this input field (this parameter remains the
same during scale change).
6.6. Operations with contour lines
6.6.1. Saving contour lines
Contours are polylines that include straight line segments (broken lines) or arc segments
(curves). Contours saving, loading and editing is performed in the same way as for any
vector layer (see the Vectorizarion User Manual).
For contours editing the system provides tools of polylines editing, see description in
the Vectorization User Manual.
To save and rewrite active contours layer select Vectors › Save or click the layer name
by mouse right button in the Manager and choose the Save in right-click menu.
82
DTM Generation
PHOTOMOD 6.0.2
To save active layer with new name select Vectors › Save as... or click the layer name
by mouse right button in the Manager and choose the Save as... in right-click menu,
specify file name and destination in active profile resources.
To save just selected contours, select all contours that should be saved and select
Vectors › Save selected as.... After that vector objects are still associated with classifier.
In order to return to vector layer state at the time of the last save, select Vectors › Revert.
The Contours layer is opened in the same way as a layer with usual vector objects, see
Section 5.3.2.
6.6.2. Contours merging
The system provides possibility to merge created contours in automatic or manual
mode.
In order to merge contours manually, perform the following actions:
1. Load or create a layer with contour lines.
2. Select Vectors › Load and open a file containing contour lines from adjacent stereopair. The Loading window opens.
3. Click the Add new data to ... layer without unloading existing data button to
add contours from adjacent stereopair to a source layer.
4. Use tools intended for polylines editing (as well as snapping) for contours manual
merging, see the Vectorization User Manual.
In order to start automatic contours merging, perform the following actions:
1. Select Vectors › Contour operations › Merge contours.... The Parameters window
on the Source contours tab opens.
83
DTM Generation
PHOTOMOD 6.0.2
Fig. 62. Parameters of contours merging on the ’Source contours’ tab
2. Choose a folder containing contours in resources tree.
The
button allows to display all available resources in nested files. The
to refresh part of the window with resources.
The
button allows to show a list with 10 recently selected resources.
3. Select file with contours in the list and click the
The
the
button allows
button to add a layer to be merged.
and
buttons allow to add to the list or remove from it all added files with contours,
button allows to remove selected file with contours from the list.
4. Repeat the 2 and 3 actions to add next files with contours.
It is necessary to choose for merging at least two files containing contour lines.
5. Click the Parameters tab.
84
DTM Generation
PHOTOMOD 6.0.2
Fig. 63. Parameters of contours merging on the ’Parameters’ tab
6. [optional] Input maximal distance between contours in meters, at which the system
performs contours merging, to the Undershoot field.
7. [optional] To the Overshoot input acceptable part of contour line to be deleted in
meters.
8. In the Smooth level section specify a smoothing level of smoothed contour from
vertices of unsmoothed one: Low, Average or Large.
9. Click OK. New vector layer that contains merged contours is created in the Manager.
6.6.3. Check of contours merging quality
The system provides possibility to check contours for breaks that occur after manual
or automatic contours merging.
To perform check of contours merging, select Vectors › Contour operations › Check
merging contours .... The Parameters window opens. In the Check distance input
field specify maximal distance between contours in meters, when the system starts to
search for contours breaks, and click OK.
If the contours breaks are detected the Erroneous contours vertices window opens.
85
DTM Generation
PHOTOMOD 6.0.2
Fig. 64. Erroneous contours vertices
The window displays a list of contour lines breaks, where:
• N – is break serial number;
• X,Y,Z – coordinates of break’s middle point;
• DL – distance between contours in meters.
Select a line in the list by mouse click. After that marker is placed to the break’s middle
point and is displayed in 2D-window.
To ’connect’ contour break, select the contour in the list and click the
To ’connect’ all found contour breaks, click the
button.
button.
6.7. Accuracy control of contours creation
6.7.1. Control of contours crossing
The system allows to check created contours for crossing/self-crossing, that occur after
operation of contours smoothing.
In order to check contours for crossings perform the following actions:
1. Load or create a layer with contour lines.
2. Select Vectors › Contour operations › Check contours intersections.... The
Parameters window opens.
Fig. 65. Parameters of contours intersections control
3. [optional] To check intersections of adjacent contours only, the Neighbour contours
only is set on by default. Set the checkbox off to check all contour lines for intersections.
86
DTM Generation
PHOTOMOD 6.0.2
Operation of created contours check for intersections may take a long time.
4. Click OK. The system start operation of created contours check for intersections.
When the check is completed the system opens the Intersection points window.
Fig. 66. Coordinates of intersection points of contour lines
In order to export a list of contours intersection points to file with csv extension,
click the
button.
To create a new layer that contains intersection points as pickets, click the
button.
5. Select a point in the list by mouse click. After that marker is placed to the crossing
point and is displayed in 2D-window.
6. Use tools of polylines editing to edit contours and correction of intersection\self-intersection errors (see description in the Vectorization User Manual).
6.7.2. Check contours by points
The system provides opportunity to perform quality control of contours creation using
regular pickets, if they were not used for contours creation.
To start the check operation it is necessary that the Contours layer and the Vectors layer (containing pickets) are loaded and displayed in the Manager.
In order to start contours check operation by pickets, perform the following actions:
1. Load or create a layer with pickets.
2. Make active the layer with contour lines.
3. Select Vectors › Contour operations › Check contours by points. The Select
points layer window opens.
87
DTM Generation
PHOTOMOD 6.0.2
Fig. 67. Selection of pickets layer
4. Select a layer containing pickets.
5. Click OK. The Parameters window opens.
Fig. 68. Parameters of contours check using pickets
6. In the Maximum residual field input a value of maximal deviation of contours from
a value of pickets elevation by Z (in meters).
7. [optional] In order to include to check operation pickets located on contours with
the same elevation (for example, N=27 (Ext=597.0, 597.0) and N=28 (Ext=597.0,
597.0)), set the Analyse points between equal contours checkbox on.
8. Click OK. The Check contours by points window opens.
Fig. 69. Points coordinates during control of contours using pickets
The window displays a list, where:
88
DTM Generation
PHOTOMOD 6.0.2
• N – is picket serial number;
• X,Y,Z – picket coordinates;
• Ext – distance between contours in XY plane;
• Z'– elevation difference between contours and pickets, that exceeds maximal
deviation.
In order to export the list to file with csv extension, click the
button.
9. Select a picket in the list by mouse click. After that marker is placed to the selected
picket and is displayed in 2D-window.
10. Use tools of polylines editing to edit contours (see description in the Vectorization
User Manual).
7. Digital Elevation Model
7.1. The ’DEM’ menu
The DEM menu contains standard menu items used to load and save DEM layers, as
well as menu items used to perform various operations on DEM creation, accuracy
control, filtering and editing.
Table 3. Brief description of the DEM menu
Menu items
Function
Build DEM...
contains menu items used to create DEM with help
of various source data
Rebuild by TIN
allows to recreate DEM after changing of TIN base
layer
Restore
is used to restoring of DEM consistency, which may
be disrupted by applying various operations or DEM
filtering
Buildings and vegetation filter
is used to Buildings and vegetation filtering in DEM
Median filter
Smooth filter...
allows to use median filtering of DEM cells
allows to use smoothing filter for DEM values
Fill null cells
contains menu items to restore blank cells of DEM
using various methods
Convert cells to null
allows to convert DEM cells with specified elevation
to null ones
Set elevation in selected polygons...
allows to set the same elevation of DEM cells inside
and outside of selected polygons
Interpolate elevation in selected polygons...
allows to interpolate a value of DEM cells inside and
outside of selected polygons
Cut by selected polygons
is used to edit coverage area of DEM
89
DTM Generation
PHOTOMOD 6.0.2
Menu items
Function
Cut null edges
is used to remove edge areas of DEM, that include
blank cells
Transpose
is used to transpose DEM from the left coordinate
system to the right one and vice versa
Transform to another coordinate system
Shift
Split DEM into sheets
Merge DEMs
allows to change coordinate system of DEM
is used to parallel displacement of DEM by axes
allows to split DEM into sheet to save DEM in parts
in separate files
allows to merge DEMs, that have overlap area
Accuracy control
is used to perform accuracy control DEM creation
using various data
Convert to points...
allows to convert DEM cells to pickets with specified
simplifying
Export...
contains menu items used to perform export of DEM
to different formats
Import...
contains items used to import DEM from files with
grd, asc, tif, dem, mtw, dt1, dt2, img, pix, hgt extensions
Batch import
Load lidar data
is used to simultaneous import of multiple DEM
is used to load and use laser scanning data (see
detailed description in the ’LIDAR Data processing’
User Manual)
7.2. General information
DEM (Digital Elevation Model) – is digital cartographic representation of the earth’s
surface in the form of a regular grid of height values.
A source data for DEM creation is the following data, taken individually or in combination:
• TIN (Triangulated Irregular Network);
• regular or irregular pickets (point objects);
• vector objects (see the Vector objects creation chapter in the ’Vectorization’ User
Manual).
DEM is displayed in 2D-window, and also could be opened to view in 3D-window or in
2D-window of stereopair in stereo mode.
DEM in stereo mode may be displayed inaccurately.
To view information about DEM select Information item in the Manager. The system
displays information window which includes the following information about the layer:
90
DTM Generation
PHOTOMOD 6.0.2
• layer name;
• full path to layer file;
• presence of data and changes in the layer;
• possibility to change the layer;
• coordinates of DEM border nodes, including Z-coordinate;
• ground sample distance;
• DEM size (number of cells);
• layer coordinate system.
Fig. 70. Information about DEM layer
7.3. DEM creation
7.3.1. DEM creation by TIN
The system provides possibility to create DEM using irregular spatial triangles network
(TIN). Perform the following actions to do this:
1. Create or load source TIN.
2. Choose DEM › Build DEM › From TIN (Ctrl+N, D). The DEM by TIN creation
parameters window opens.
91
DTM Generation
PHOTOMOD 6.0.2
Fig. 71. DEM by TIN creation parameters
3. Specify DEM borders in the North, West, East, South fields. In the Height and
Width fields the system displays calculated size of DEM border in meters.
Default values are coordinates of rectangle corners, which generate TIN creation area.
4. In the Cell size specify the DEM cell size in meters to define cell size of output
DEM. The Cells number, calculated considering specified cell size, displays in the
Height and Width fields. Also the Approximately DEM size in megabytes displays
in the appropriate field.
DEM cell size should be comparable to average distance between points of base TIN
layer. If less cell size is used, the time of DEM creation and size of output file increase, but
accuracy is not.
5. [optional] It is possible to use parameters of existed DEM to calculate parameters
of output DEM. To do that, click the Calculate parameters by existing DEM button
and choose DEM file in active profile resources.
6. Click OK. Specify DEM file name, define a folder in active profile resources and
click Save (see also Section 7.9 and DEM load). The system starts DEM creation
operation. After that the system creates new layer in the Manager and shows a
message about operation successful or unsuccessful completion.
92
DTM Generation
PHOTOMOD 6.0.2
Fig. 72. DEM built from TIN
When marker is moving over DEM, the status panel in 2D-window displays XYZ-coordinates of DEM points.
The system allows to recreate DEM after changing of TIN base layer. To do this use
the DEM › Rebuild by TIN menu item.
7.3.2. DEM creation using regular pickets
The system provides possibility to create DEM using a set of pickets created in regular
grid nodes or imported from external files. Perform the following actions to do this:
1. Create or load a layer with pickets.
2. Select DEM › Build DEM › From regular points... The Parameters of DEM
building by regular pickets parameters window opens.
93
DTM Generation
PHOTOMOD 6.0.2
Fig. 73. DEM creation using regular pickets
3. Specify DEM borders in the North, West, East, South fields. In the Height and
Width fields the system displays calculated size of DEM border in meters, as well
as number of DEM nodes.
Coordinates of border pickets of source layer are default values.
4. Specify Cell size in meters to change size of output DEM cell.
DEM cell size should be commensurate with the average distance between pickets. If less
cell size is used, the time of DEM creation and size of output file increase, but accuracy is
not.
5. [optional] It is possible to use parameters of existed DEM to calculate parameters
of output DEM. To do that, click the Calculate parameters by existing DEM button
and choose DEM file in active profile resources.
6. [optional] In order to exclude pickets with specified elevation from creation operation,
set the Exclude Z values checkbox on and input the parameters in meters.
7. Click OK. Specify DEM file name, define a folder in active profile resources and
click Save (see also Section 7.9 and DEM load). The system starts DEM creation
operation. After that the system creates new layer in the Manager and shows a
message about operation successful or unsuccessful completion.
7.3.3. DEM creation using pickets
The system provides possibility to create DEM using pickets (point vector objects located
on the terrain relief surface). Perform the following actions to do this:
1. Create or load a layer with pickets.
94
DTM Generation
PHOTOMOD 6.0.2
2. Select DEM › Build DEM › From points.... The Parameters of DEM building from
pickets parameters window opens.
Fig. 74. Parameters of DEM creation from pickets
3. Specify DEM borders in the North, West, East, South fields. In the Height and
Width fields the system displays calculated size of DEM border in meters, as well
as number of DEM nodes.
Coordinates of border pickets of source layer are default values.
4. Specify Cell size in meters to change size of output DEM cell.
DEM cell size should be commensurate with the average distance between pickets. If less
cell size is used, the time of DEM creation and size of output file increase, but accuracy is
not.
5. [optional] It is possible to use parameters of existed DEM to calculate parameters
of output DEM. To do that, click the Calculate parameters by existing DEM button
and choose DEM file in active profile resources.
6. Specify Search area size in meters to change ’sliding window’ size (in meters on
terrain).
’Sliding window’ method – means moving of some frame over set of pickets from node to
node of DEM considering elevations and weight of pickets falling into the ’sliding’ frame.
A value of DEM cell (elevation), located in the middle of ’sliding window’, is define as the
sum of heights of the pickets in the ’sliding window’ depending on their weight.
Cell size of output DEM should not exceed a size of the ’sliding window’, specified in the
Search area size field.
95
DTM Generation
PHOTOMOD 6.0.2
7. Specify Cache size parameter in lines of search for pickets in a specified search
area by cell size.
Cache size is used to define a number of lines of search area.
8. Click OK. Specify DEM file name, define a folder in active profile resources and
click Save (see also Section 7.9 and DEM load). The system starts DEM creation
operation. After that the system creates new layer in the Manager and shows a
message about operation successful or unsuccessful completion.
7.3.4. DEM creation using CSV-file
The system provides possibility to create DEM using data obtained from CSV-file.
It is possible to use points coordinates from CSV-file only if points coordinates are recorded
using the template Name X Y Z.
To create DEM by CSV-file perform the following actions:
1. Select DEM › Build DEM › From CSV file data... The Parameters of DEM building
by CSV file parameters window opens.
Fig. 75. DEM creation using CSV-file data
2. Specify DEM borders in the North, West, East, South fields. In the Height and
Width fields the system displays calculated size of DEM border in meters, as well
as number of DEM nodes.
Coordinates of border pickets included to source CSV-file are default values.
96
DTM Generation
PHOTOMOD 6.0.2
3. [optional] To define output DEM border from CSV-file data click the Read extents
from file button.
4. Specify Cell size in meters to change size of output DEM cell.
DEM cell size should be commensurate with the average distance between pickets. If less
cell size is used, the time of DEM creation and size of output file increase, but accuracy is
not.
5. [optional] It is possible to use parameters of existed DEM to calculate parameters
of output DEM. To do that, click the Calculate parameters by existing DEM button
and choose DEM file in active profile resources.
6. Click the
button and select CSV-file to be used for DEM creation.
7. [optional] In order to exclude pickets with specified elevation from creation operation,
set the Exclude Z values checkbox on and specify the value in meters.
8. [optional] In order to swap coordinate system (left/right), set the Swap X, Y checkbox
on. At that the coordinate system do not change.
If the Swap X Y checkbox is cleared, the vector objects will be imported in the right coordinate system. Otherwise, in the left one.
9. Click OK. Specify DEM file name, define a folder in active profile resources and
click Save (see also Section 7.9 and DEM load). The system starts DEM creation
operation. After that the system creates new layer in the Manager and shows a
message about operation successful or unsuccessful completion.
7.3.5. DEM creation using smooth model
The system provides possibility to build a DEM using smooth model created by objects
of selected vector layers. When using smooth model the system creates smoothed
DEM with specified accuracy.
To create DEM by smooth model perform the following actions:
1. Select DEM › Build DEM › Smooth model.... The Parameters of DEM building
by smooth model window opens.
97
DTM Generation
PHOTOMOD 6.0.2
Fig. 76. Parameters of DEM creation using smooth model
2. In the Source layers section set the checkboxes on next to base point layers used
for DEM creation.
Click the
button to select all layers, click the
button, invert layers selection.
button to unselect all layers, or click the
3. In the Working area border layer specify border type of working area:
• Rectangle – used to create rectangular border;
• Convex – used to create border using edge pickets of selected layer;
• Use polygons from layer – used to create a border from the layer, which polygons are used as a border for DEM creation area. Set the Selected only
checkbox on, to use just selected polygons as a border, otherwise, a DEM will
be created considering all polygons of the layer.
4. In the Model accuracy field input acceptable deviation of DEM cells elevation values
from source vector layer in meters.
The Model accuracy parameter should be specified based on errors values obtained
during creation of vector objects using correlator in stereomode.
5. Specify DEM borders in the North, West, East, South fields. In the Height and
Width fields the system displays calculated size of DEM border in meters.
98
DTM Generation
PHOTOMOD 6.0.2
6. In the Cell size section specify DEM cell size in meters to change a size of output
DEM cell. In the Height and Width fields the system displays nodes number calculated with specified DEM cell size. There is also displayed the Appr DEM size in
megabytes.
DEM cell size should be commensurate with the average distance between pickets. If less
cell size is used, the time of DEM creation and size of output file increase, but accuracy is
not.
7. [optional] It is possible to use parameters of existed DEM to calculate parameters
of output DEM. To do that, click the Calculate parameters by existing DEM button
and choose DEM file in active profile resources.
8. [optional] To reset to default parameters, click the Refresh button.
9. Click OK. Specify DEM file name, define a folder in active profile resources and
click Save (see also Section 7.9 and DEM load). The system starts DEM creation
operation. The new layer is created in the layer manager.
7.3.6. Creation of dense DTM
The system allows to create a dense DTM, which cell size coordinates to one pixel of
image.
To perform dense DTM creation the system provides the following workflow:
1. DTM creation for specified area.
2. Main processing: apply filter of buildings and vegetation to created DTM and/or restore empty cells.
3. [optional] Additional processing – median and/or smoothing filtering.
If intermediate data does not removed after the processing is complete, the system provides
possibility to start separate steps (filtering and smoothing) without without re-calculation
of the original DEM.
To create a dense DTM perform the following actions:
1. Create a grid to define DEM creation area.
Since coordinates calculation is performed in each pixel of the selected area, the grid nodes
are not considered. The grid is used only as a border of DTM creation area.
2. Select DEM › Build DEM › Dense DTM.... The Parameters of create dense DTM
window opens.
99
DTM Generation
PHOTOMOD 6.0.2
If a grid not was not created in advance, the Grid properties window opens, that allows
to create a grid for the entire images block.
Fig. 77. Parameters of dense DTM creation
3. In the Search area section specify one of the areas of searching:
• All images – allows to select all images of a block;
• Selected images – allows to select block images highlighted in 2D-window;
• Active stereopair – allows to select images of a stereopair opened in active 2Dwindow.
All selected stereopairs should be included to adjusted part of the block (see the ’Block
adjustment’ User Manual). Otherwise, the system will fail to create DTM or will create it
incorrectly. In the first case the system displays error message, in the second one – it
is not possible to match calculated pickets to project coordinate system.
4. [optional] Specify additional parameters of search area:
• set the Process inter-strip stereopairs checkbox on to calculate DTM on interstrip stereopairs during UAS projects processing, and also for processing images,
which do not require high creation accuracy;
Pickets calculation is performed by default for strip stereopairs.
100
DTM Generation
PHOTOMOD 6.0.2
• set the Limit intersection angle checkbox on to filter blunders by Z on images
with intersection angle of small or null value, and define a value of minimal angle
using the slider;
• set the Use pre-regions checkbox on and select vector layer with bordering
polygons.
5. In the Working folder section click the
profile resources to save output DEM.
button and select empty folder in active
Before operation is performed all data from selected folder is removed.
6. [optional] In the Compute source DTM section define parameters of correlator
work:
• the Check correlation and Check autocorrelation checkboxes are on in the
system by default, that allows to check correlation and auto-correlation values
whether they meet specified thresholds;
The filtering is performed using check of correlation threshold by auto-correlation radius.
It is not recommended to change pickets filtering parameters.
• in the Check area fields specify a size of search matrix;
• specify Correlation threshold – minimal accepted correlation coefficient value
for matched pixels of images;
• if there are multiple video adapters are installed on the workstation, select the
CPU from the drop-down list or NVIDIA CUDA processor (GPU) for calculations.
Click the Properties button to view video adapter’s properties, if they are allowed
by the device;
Using NVIDIA CUDA significantly reduces the processing time. See detailed information
on the web-site http://www.nvidia.ru/object/cuda_gpus_ru.html.
• click the More button to define additional parameters. The Correlation parameters window opens.
101
DTM Generation
PHOTOMOD 6.0.2
Fig. 78. Window of additional correlator parameters
Parameter
Description
Images smoothing
the slider used to define a level of images
smoothing
Search by X
search area size by X with respect to the initial
approximation calculated considering orientation
data
Search by Y
search area size by Y with respect to the initial
approximation calculated considering orientation
data
Mask halfsize
a value of half of linear size of rectangular correlation mask in pixels by X and Y axes
Micro tile size
area size in microtile used to match pixels
Macro tile size
size of image area
Coarse threshold
a value of correlation coefficient during microtiles
matching
Dispersion threshold
a value of contrast during matching of images
pixels
Image subsampling factor
used level of image pyramid for points search
Subpixel correlation
a checkbox to consider subpixel correlation
during search for corresponding points
Output statistics
a checkbox to display information about dense
DEM creation in progress window
7. In the Main processing section the Buildings and vegetation filter checkbox is
set on by default to exclude from processing those pickets, that were placed on
buildings roofs or on crowns of trees. Set the checkbox off to not to use the filter,
or click the Parameters button to configure filtering parameters, described in the
Section 7.4.1.
102
DTM Generation
PHOTOMOD 6.0.2
8. [optional] In the Main processing section the Restore null cells is set on by default.
Set the checkbox off to not to use the filter, or click the Parameters button to configure parameters. The Parameters of filling nulls cells in DEM window opens.
9. [optional] In the Additional processing section specify the following filtering
parameters:
• set the Median filter checkbox to use median filtering during DEM creation and
specify Parameters of filter usage;
• set the Smooth filter checkbox to use smooth filtering during DEM creation and
specify Parameters of filter usage.
10. [optional] To remove processing data after the calculation is completed set the
Delete intermediate data checkbox on.
It is not recommended to remove intermediate data up to final creation of DEM. During
removing of intermediate data it is impossible to start separate steps (filtering or smoothing)
without DEM re-calculation.
11. In the Output DEM parameters section specify DEM boundaries in the North,
West, East, South fields. In the Height and Width fields the system displays calculated size of DEM border in meters.
12. Specify Cell size in meters to change size of output DEM cell. In the Height and
Width fields of the Cell size section the system displays nodes number calculated
with specified DEM cell size. There is also displayed the Appr DEM size in megabytes.
The value of the DEM cell size parameter should not be less than average pixel size
(GSD). If less cell size is used, the time of DEM creation and size of output file increase,
but accuracy is not.
13. [optional] The system provides possibility to calculate output DEM parameters using
parameters of the existing DEM. To do this click the Calculate parameters by
existing DEM button and select file with DEM to be used for calculation in active
profile resources.
14. Click OK to start operation of dense DEM creation in usual mode.
In order to perform DEM using distributed processing, do the following:
During DEM distributed creation an area of output DEM is divided into rectangular sheets
with a specified overlap, which are calculated in the individual tasks. When the last task is
performed the system executes merging of all acquired sheets of the DEM.
103
DTM Generation
PHOTOMOD 6.0.2
1. Change settings and run the distributed processing server/client (see the ’Distributed processing’ chapter in the ’General information about system’ User
Manual).
2. Click the Distributed processing button. The DEM distributed processing
window opens.
Prior to configure parameters of distributed processing it is necessary to specify
parameters of using the buildings and vegetation filter. The settings window is opened
automatically if the parameters are not specified.
Fig. 79. Parameters of dense DTM creation in distributed processing mode
3. Set the parameters Split into tasks by rectangular sheets of size by X and
by Y in meters, considering number of used computers.
It is recommended to set one task per one computer.
Maximal number of created tasks is calculated automatically considering
specified sheet size.
If the GPU device is used to create DEM, it is necessary the specify Maximum tasks
quantity not more than one for each computer, involved in processing.
It is necessary to have at least one graphics device available that supports CUDA,
for each computer used for processing.
4. [optional] Specify the with overlap parameter value less than the default value
to speed up the processing.
It is highly not recommended to decrease a value during processing of images acquired
for terrain with big elevation differences .
A grid step should be much smaller than sheets overlap area, otherwise, there is the
probability of getting area without DEM in the corners of sheets and after merging.
104
DTM Generation
PHOTOMOD 6.0.2
5. Click OK. Distributed processing tasks are created and the system shows a
message about number of created tasks.
Depending on the size of creation area the operation can take a long time.
7.3.7. Creation of dense DSM
To create Digital Surface Model (DSM) with deformating method perform the following:
1. Setup and run the distributed processing server/client (see the ’Distributed processing’ chapter in the ’General information about system’ User Manual).
2. Create a grid to define DEM creation area.
Since coordinates calculation is performed in each pixel of the selected area, the grid nodes
are not considered. The grid is used only as a border of DTM creation area.
3. Select DEM › Build DEM › Dense DSM... (deformating method). The Create
dense DSM window opens.
If a grid not was not created in advance, the Grid properties window opens, that allows
to create a grid for the entire images block.
Fig. 80. Dense DSM creation parameters
4. In the Search area section specify one of the areas of searching:
• All images – allows to select all images of a block;
• Selected images – allows to select block images highlighted in 2D-window.
105
DTM Generation
PHOTOMOD 6.0.2
5. In the Working folder section click the
profile resources to save output DEM.
button and select empty folder in active
Before operation is performed all data from selected folder is removed.
6. Choose the number of used cores:
• set the Use all cores on local PC checkbox on to split process to tasks according
to quantity of available cores (1 core – 1 task);
Quantity of available cores is a quantity of cores on local PC.
• set the Cores in the net to be used for DEM creation manually in the appropriate
field.
General quantity of tasks is calculated automatically.
7. Define the following parameters:
• the Do not fill invisible areas checkbox allows to exclude areas, where ground
is invisible (e.g., shadow from the house);
• the Do not fill doubtful areas checkbox allows to exclude areas with low correlation coefficient, errors or homogeneous vast areas (dense forest) and so on.
8. [optional] To remove processing data after the calculation is completed set the
Delete intermediate data checkbox on.
It is not recommended to remove intermediate data up to final creation of DEM. During
removing of intermediate data it is impossible to start separate steps (filtering or smoothing)
without DEM re-calculation.
9. In the Output DEM parameters section specify DEM boundaries in the North,
West, East, South fields. In the Height and Width fields the system displays calculated size of DEM border in meters.
10. Specify Cell size in meters to change size of output DEM cell. In the Height and
Width fields of the Cell size section the system displays nodes number calculated
with specified DEM cell size. There is also displayed the Appr DEM size in megabytes.
106
DTM Generation
PHOTOMOD 6.0.2
The value of the DEM cell size parameter should not be less than average pixel size
(GSD). If less cell size is used, the time of DEM creation and size of output file increase,
but accuracy is not.
11. Click OK. Operation of dense DEM creation starts.
7.3.8. DEM creation in batch mode
The system provides possibility to create DEM in batch mode. Batch mode allows to
create multiple files with TIN and DEM simultaneously and to save them to specified
folder.
For DEM batch creation the source vector resources are divided into sheets using
specified parameters. For each vectors sheet the system creates TIN, used for DEMs
creation, and then they are merged to generate a single output DEM.
Perform the following actions to execute batch processing:
1. Select DEM › Build DEM › Batch DTM creation. The Create batch DTM – Step
1 of 2: Source data.
Fig. 81. Creating a list of the initial vector resources for batch DTM creation
2. Choose a folder containing vector objects in resources tree.
The
button allows to display all available resources in nested files. The
to refresh part of the window with resources.
The
button allows to show a list with 10 recently selected resources.
3. Select vector file in the list and click the
107
button to add a layer.
button allows
DTM Generation
PHOTOMOD 6.0.2
The
and
objects, the
buttons allow to add to the list or remove from it all added files with vector
button allows to remove selected file from the list
4. Repeat the 2 and 3 steps to add next files with vector objects.
5. Click the Next button. The Create batch DTM – Step 2 of 2: Options.
Fig. 82. Parameters of batch DTM creation
6. In the Processing section define tasks to be performed during DEM creation:
1. Split input data into sheets – specify max.point quantity per sheet in millions
of points, and specify a size of sheets overlap in percent.
Specified parameters are considered by the system to define a number of sheets for
splitting, so in specified target folder the system creates vector files with x-data extension and sheet_sheet № names.
2. Build TIN by created sheets – (is set on by default) is used to create TIN by
vector objects layers, divided into sheets. During execution of this task in the
specified target folder the system creates files with x-tin extensions and
sheet_sheet № names, that correspond to vector files.
3. Build DEM by created TIN – (is set on by default) is used to create a single
DEM by the whole TIN, generated using obtained sheets.
108
DTM Generation
PHOTOMOD 6.0.2
The task is performed in two steps: DEM is created for each sheet by TIN, after that
all created DEMs are merged into single one. Thus in the output folder a file with xdem extension is created.
7. [optional] Set the Distributed processing checkbox on to use distributed processing
feature for batch DEM generation.
8. In the Working folder section define empty folder in active profile resources, where
to place output data.
Before operation is performed all data from selected folder is removed.
9. [optional] In the Filtering section set the Z-range filter checkbox on to apply filtering
to vectors and/or TIN. During filtering the system removes points and vertices of
polylines/polygons (including TIN vertices), which Z-coordinate is out of range,
specified in the Zmin and Zmax fields in meters.
10. In the DEM parameters section specify DEM boundaries in the North, West, East,
South fields. In the Height and Width fields the system displays calculated size
of DEM border in meters.
11. Specify Cell size in meters to change size of output DEM cell. In the Height and
Width fields of the Cell size section the system displays nodes number calculated
with specified DEM cell size. There is also displayed the Appr DEM size in megabytes.
DEM cell size should be commensurate with the average distance between pickets. If less
cell size is used, the time of DEM creation and size of output file increase, but accuracy is
not.
12. [optional] It is possible to use parameters of existed DEM to calculate parameters
of output DEM. To do that, click the Calculate parameters by existing DEM button
and choose DEM file in active profile resources.
13. Click the Execute button. The system displays a message about removing of all
data in specified output folder. After that the system creates new DEM layer in the
Manager.
When the Distributed processing checkbox is set on, perform the following actions:
1. Change settings and run the distributed processing server/client (see the ’Distributed processing’ chapter in the ’General information about system’ User
Manual).
2. Click the Execute button. The DEM distributed processing window opens.
109
DTM Generation
PHOTOMOD 6.0.2
Fig. 83. Parameters of distributed batch DTM creation
3. The number of DEM parts, which the DEM is split on during distributed processing, is calculated automatically and depends on the size of the matrix. It
is recommended to specify Number of fragments per task assuming one task
per one computer.
4. Select the Temporary folder for distributed processing for temporary data
storing.
5. Define the output file name and path.
6. Click OK. Distributed processing tasks are created and the system shows a
message about number of created tasks.
7.4. DEM filtering
7.4.1. Buildings and vegetation filter
The system allows to use filtering of buildings and vegetation of DEM. Such filtering
includes calculation of base pickets with specified coefficient of DEM subsampling. The
operation includes deletion, correction or recognizing points which have fallen on
buildings, trees, cars, in pits, etc. during automatic pickets calculation, as well as filtering
of accident spikes. After the filtering output DTM contains just terrain relief model.
110
DTM Generation
PHOTOMOD 6.0.2
Fig. 84. Buildings and vegetation filtering from DEM
The Buildings and vegetation filter window allows to specify filtering parameters and
setup a number of filter passes. The Layer field displays a name of active vector layer.
The window contains a standard toolbar.
Button
Function
allows to load a script of filter work from *.x-filter
resource located out of active profile resources
allows to load a script of filter work from *.x-filter
resource located in active profile resources
allows to save a current script of filter work to *.xfilter resource located out of active profile resources
allows to save a current script of filter work to *.xfilter resource located in active profile resources
allows to cancel all changes made to a script
allows to go back to a standard script that includes
two passes with default settings (regardless of which
script has been loaded)
To filter buildings and vegetation on DEM perform the following actions:
1. Make active a DEM layer.
2. Select DEM › Buildings and vegetation filter. The Buildings and vegetation
filter window opens.
111
DTM Generation
PHOTOMOD 6.0.2
Fig. 85. Buildings and vegetation filtering from DEM
3. In the Output DEM section click the
button and specify name and target folder
of output DTM in active profile resources.
4. [optional] Specify a number of filter passes:
• by default it is used two passes with standard parameters – Basic and Additional.
Set off checkboxes to change number of passes;
• the
button allows to add a new pass of filter;
• the
button allows to remove selected pass of filter;
• the
and
buttons allow to move selected pass up/down.
5. Select a name of pass and click the Edit pass parameters button to display and
configure the following parameters of filter pass:
112
DTM Generation
PHOTOMOD 6.0.2
Fig. 86. Configuration of buildings and vegetation filter
• [optional] to change a filter pass name, input new name to the Name field;
• the Source DEM cell size field shows DEM cell size in meters before filter applying;
• specify Thinout coefficient for calculating basic points by DEM. From the
specified value and the Source DEM cell size parameter depends the Space
between basic points parameter in meters;
• specify Near and Far distance of mutual points influence in meters to define
the radius of the circle, in which the values of pickets are analysed for errors. For
near distance (minimal circle radius) it is recommended to set a value of 3-5
values of the average distances between pickets;
• specify the following filtering parameters Up (above surface) and/or Down (below
surface):
○ Filter surges – allows to select pickets to be filtered: pickets on surface (high
objects) and/or pickets below surface (pits);
For filter operating it is necessary to set at least one checkbox on.
○ Spikes only – is used to reject just sharp spikes above/below surface, that
are defined by values of the Threshold slope angle for spikes and Distance
of points parameters. The rest of parameters are not considered;
113
DTM Generation
PHOTOMOD 6.0.2
In an angle between three points exceeds a value of the Threshold slope angle for
spikes parameter, then the surge is called spike.
○ Threshold slope angle for spikes – allows to specify angle of slope in relation
to selected measuring plane (above and/or below surface) to define sharp
spikes;
○ Maximum area of flat surges – allows to define maximal area of plane surges
(above/below surface) – points groups, that form smooth surfaces and are
distant from some plane of neighbour points. Generally, the points are located
on buildings roofs, and are lying on the same plane;
The filter is not applied to plane surface, which area exceeds the specified value.
○ Intermediate smoothing radius – allows to specify a sphere radius
(above/below surface), that defines a level of intermediate smoothing of surface;
○ Allowed point deviation from from smoothed surface – allows to specify
criterion, according which the filter is applied to all pickets with elevations that
differ from smoothed surface more then on specified value.
The
button allows to go back to a standard script that includes two passes with all default
settings (regardless of which script has been loaded).
6. [optional] To use all cores of used computer, the Use all available CPU cores
checkbox is set on in the system by default. It is necessary to set the checkbox off
to use only one core.
7. Click OK. The system starts DEM filtering operation. When the filtering operation
is completed the system displays information message about number of used basic
points and pickets being filtered.
114
DTM Generation
PHOTOMOD 6.0.2
Fig. 87. Filtering results
7.4.2. Median filter
The system allows to use median filtering of DEM cells.
The median filtering contains the following sequence of actions:
1. Sequential scanning of DEM by mask with specified size. Size of scanning mask
is defined by the Aperture parameter (in DEM cells).
2. The system replaces current cell elevation values by filtered values, if a difference
between them is not more than specified Threshold in meters.
To apply median filtering perform the following actions:
1. Make active a DEM layer.
2. Select DEM › Median filter. The Median filter parameters window opens.
Fig. 88. Median filter parameters
3. In the Threshold filed specify a value of threshold in meters, which is used to
compare difference value between current and filtered elevation.
4. In the Aperture field specify a size of scanning mask.
115
DTM Generation
PHOTOMOD 6.0.2
5. Click OK. After that current values of DEM cells are replaced by filtered values, if
difference value between current and filtered elevation does not exceed specified
Threshold.
7.4.3. Smooth filter
The system allows to use smooth filtering of DEM cells values.
To execute smooth filtering perform the following actions:
1. Make active a DEM layer.
2. Select DEM › Smooth filter. The Smooth filter parameters window opens.
Fig. 89. Smooth filter parameters
3. In the Level field specify filtering coefficient value from 0 to 1.
4. In the Aperture field specify a size of scanning mask.
5. [optional] To apply Gauss smoothing algorithm the Gaussian filter checkbox is set
on by default.
6. Click OK. After that current values of DEM cells elevation are replaced by filtered
values.
7.5. Transformation of DEM coordinates
7.5.1. DEM transpose
The system provides opportunity to transpose DEM from the left coordinate system to
the right one and vice versa. To do this use the DEM › Transpose menu item. Such a
transformation results in swap of DEM rows and columns.
This feature is used, for example, if vector objects coordinates are incorrectly specified (see the
chapter ’Transformation of objects coordinates’ in the ’Vectorization’ User Manual).
116
DTM Generation
PHOTOMOD 6.0.2
7.5.2. Transformation of DEM coordinate system
The system provides opportunity to transform DEM from one coordinate system to another.
In order to transform DEM to another coordinate system perform the following actions:
1. Select DEM › Transform to another coordinate system. The Conversion DEM
to another coordinate system window opens.
Fig. 90. Transform DEM to another coordinate system
2. Click the
button in the Input DEM section and specify a source DEM file in
active profile resources.
3. Click the
button in the Output DEM section and specify DEM name and target
folder in active profile resources.
4. In the Initial coordinates system section select actual Coordinate system of DEM
(if it is different from project coordinate system). Perform the following actions to
do this:
1. Click the Select... button to specify initial coordinate system.
Coordinate system is specified using one of the following ways:
• From DB – from international or Russian coordinate system database
(see’Coordinate systems databases’ in the Project creation’ User Manual);
117
DTM Generation
PHOTOMOD 6.0.2
• From file – allows to select coordinate system from files with x-ref-system,
extension located out of active profile resources;
• From resource – from files with x-ref-system extension located in active
profile resources, for example, to select coordinate system from another
active profile project.
The system also allows to select coordinate system from a list of recently used coordinate systems.
2. [optional] When choosing coordinate system from database the Coordinate
system database opens, which contains the list of coordinate systems.
To perform fast search for coordinate system, input the whole coordinate system name
or its part to the Find input filed.
Fig. 91. Window used to select coordinate system from coordinate system database
3. [optional] To choose geoid to be used, click the
of geoid usage:
button. Select proper type
• No geoid;
• EGM 96.
The system allows to use the EGM2008 geoid. See more details in the Installation
EGM2008 Geoid User Manual. After installation the geoid is displayed in the list.
5. In the Output coordinate system define target DEM coordinate system in which
it is necessary to convert the DEM. To do this perform actions from step 4.
6. Specify DEM borders in the North, West, East, South fields. In the Height and
Width fields the system displays calculated size of DEM border in meters, as well
as number of DEM nodes.
7. Specify Cell size in meters to change size of output DEM cell.
118
DTM Generation
PHOTOMOD 6.0.2
8. [optional] It is possible to use parameters of existed DEM to calculate parameters
of output DEM. To do that, click the Calculate parameters by existing DEM button
and choose DEM file in active profile resources.
9. [optional] To open DEM after recalculation of coordinate system the Open output
DEM checkbox is set on by default. Set the checkbox off to not load the created
file in the project.
10. Click OK to convert DEM coordinate system.
To use distributed computing for changing of DEM coordinate system, do the following:
1. Change settings and run the distributed processing server/client (see the ’Distributed processing’ chapter in the ’General information about system’ User
Manual).
2. Click the Distributed processing button. The DEM distributed processing
window opens.
Fig. 92. DEM distributed processing
3. The number of DEM parts, which the DEM is split on during distributed processing, is calculated automatically and depends on the size of the matrix. It
is recommended to specify Number of fragments per task assuming one task
per one computer.
4. Select the Temporary folder for distributed processing for temporary data
storing.
5. Define the output file name and path.
6. Click OK. Distributed processing tasks are created and the system shows a
message about number of created tasks.
119
DTM Generation
PHOTOMOD 6.0.2
7.6. Null cells in DEM
7.6.1. General information
During automatic creation of regular relief model (DEM) some part of the cells can not
be defined. Such DEM cells (’gaps’), which elevation is not known, are called null cells.
The system provides possibility to restore null cells of DEM using the following methods
of null cells filling:
• linear interpolation method (see Section 7.6.2);
• smooth interpolation method (see Section 7.6.3);
• filling with constant value (see Section 7.6.4).
The system also allows to transform DEM cells with specified elevation to null cells.
Filling DEM null cells is also used to change input DEM cell size.
7.6.2. Filling null cells using linear interpolation
The system provides possibility to restore null cells of DEM using the linear interpolation
method. Null cells filling using this method is performed by creating TIN from the DEM
and calculation of null cells elevation using method of linear interpolation by created
TIN. When using this method it is possible to change the DEM borders and cell size,
as well as to remove ’sharp’ peaks of TIN.
To fill DEM null cells by linear interpolation method perform the following methods:
1. Select DEM › Fill null cells › Linear interpolation.... The Parameters of filling
null cells in DEM by linear interpolation window opens.
120
DTM Generation
PHOTOMOD 6.0.2
Fig. 93. Parameters of filling null cells using linear interpolation
2. In the Input DEM section click the
resources.
button to select input DEM in active profile
The DEM loaded to the project is selected by default.
3. [optional] To define name and target folder of output DEM in active profile resources,
click the
button.
By default the system suggests the <input dem name>_corr.x-dem name for output DEM
and to place it to the folder, containing input DEM file.
4. In the Extents section specify DEM boundaries in the North, West, East, South
fields. In the Height and Width fields the system displays calculated size of DEM
border in meters, as well as number of DEM nodes.
5. Specify Cell size in meters to change size of output DEM cell.
6. [optional] It is possible to use parameters of existed DEM to calculate parameters
of output DEM. To do that, click the Calculate parameters by existing DEM button
and choose DEM file in active profile resources.
7. [optional] To remove sharp peaks in DEM cells with filled elevation values set the
Peak filtering checkbox on and click the
button. The Parameters window
opens.
121
DTM Generation
PHOTOMOD 6.0.2
Fig. 94. Parameters of peak filtering
Input the following peak filtering parameters:
• Edge length – allows to specify maximal edge length in DEM cell (in meters);
• Elevation shift up more than – allows to specify maximal deviation of cell by
elevation above adjacent cells (in meters).
8. Click OK. The system starts calculation of null cells elevation using linear interpolation method. After that the system creates new DEM layer in the Manager and
shows a message about operation successful or unsuccessful completion.
7.6.3. Filling null cells using smooth interpolation
The system provides possibility to restore null cells of DEM using the smooth interpolation
method. When applying the method of smooth interpolation the system evaluates the
factor of input DEM thinning to obtain auxiliary DEM. An auxiliary DEM is used to calculate elevation values of null cells, and DEM cells with filled elevations are not re-calculated. Borders and cell size of output DEM are fully correspond to the boundary and
the cell size of the input DEM.
This method is recommended for a sufficiently dense DEM.
To fill DEM null cells by smooth interpolation method perform the following methods:
1. Select DEM › Fill null cells › Smooth interpolation.... The Parameters of filling
null cells in DEM window opens.
Fig. 95. Parameters of filling null cells using smooth interpolation
The window displays the ground sample distance (GSD) of input DEM in meters.
122
DTM Generation
PHOTOMOD 6.0.2
2. In the Input DEM section click the
resources.
button to select input DEM in active profile
The DEM loaded to the project is selected by default.
3. [optional] To define name and target folder of output DEM in active profile resources,
click the
button.
By default the system suggests the <input dem name>_filled.x-dem name for output DEM
and to place it to the folder, containing input DEM file.
4. Input the Auxiliary DEM subsampling. After that the GSD of auxiliary DEM is
calculated automatically.
5. Click OK. The system starts calculation of null cells elevation using smooth interpolation method. After that the system creates new DEM layer in the Manager.
7.6.4. Filling null cells by constant value
The system provides possibility to fill null cells of DEM by constant value.
To fill DEM null cells with constant value perform the following methods:
1. Select DEM › Fill null cells › By constant value.... The Fill DEM null cells by
constant value parameters window opens.
Fig. 96. Parameters of filling null cells of DEM by constant value
2. In the Input DEM section click the
resources.
button to select input DEM in active profile
The DEM loaded to the project is selected by default.
3. [optional] To define name and target folder of output DEM in active profile resources,
click the
button.
123
DTM Generation
PHOTOMOD 6.0.2
By default the system suggests the <input dem name>_filled.x-dem name for output DEM
and to place it to the folder, containing input DEM file.
4. Input the Value for filling of null cells.
5. Click OK. The system starts filling of null cells operation. After that the system displays a message about number of changed cells and creates new DEM layer in
the Manager.
7.6.5. Converting cells to null
The system allows to convert DEM cells with specified elevation to null cells.
It is recommended to apply this method if there are errors after importing DEM.
In order to convert cells to null ones perform the following actions:
1. Select DEM › Convert cells to null.... The Parameters of converting DEM cells
to null values window opens.
Fig. 97. Parameters of converting DEM cells to null values
2. In the Input DEM section click the
resources.
button to select input DEM in active profile
The DEM loaded to the project is selected by default.
3. [optional] To define name and target folder of output DEM in active profile resources,
click the
button.
By default the system suggests the <input dem name>_corr.x-dem name for output DEM
and to place it to the folder, containing input DEM file.
124
DTM Generation
PHOTOMOD 6.0.2
4. Specify a range of DEM cells to be converted to null in the Zmin and Zmax fields
in meters.
5. Click OK. After that all output DEM cells, which elevation falls within specified Zrange are converted into null cells.
7.7. DEM editing
7.7.1. DEM merging
The system provides possibility of merging (joining) of adjacent DEMs that have overlap.
To merge adjacent DEMs perform the following actions:
1. Select DEM › Merge DEMs.... The DEM merging – Step 1 from 2: window opens
Source data.
Fig. 98. Selection DEMs for merging
2. Choose a folder containing DEM in resources tree.
The
button allows to display all available resources in nested files. The
to refresh part of the window with resources.
The
button allows
button allows to show a list with 10 recently selected resources.
3. Select the DEM that has overlap with the adjacent one in the list, and click the
button to add the DEM to be merged.
125
DTM Generation
PHOTOMOD 6.0.2
The
and
buttons allow to add to the list or remove from it all added DEMs, the
button allows to remove selected DEM from the list.
4. Repeat the 2 and 3 actions to add next DEMs.
It is necessary to choose for merging at least two files containing DEMs with overlap area.
5. Click the Next button. The DEM merging – Step 2 from 2: Parameters window
opens.
Fig. 99. Parameters of DEMs for merging
6. Specify DEM borders in the North, West, East, South fields. In the Height and
Width fields the system displays calculated size of DEM border in meters, as well
as number of DEM nodes.
7. Specify Cell size in meters to change size of output DEM cell.
8. [optional] It is possible to use parameters of existed DEM to calculate parameters
of output DEM. To do that, click the Calculate parameters by existing DEM button
and choose DEM file in active profile resources.
9. In the Inside overlapping area, use section select the DEM, which values should
be used in the overlap area:
• use data from top DEM (the first or the top DEM in the list, added for merging, in
the DEM merging – Step 1 from 2: Source data window);
126
DTM Generation
PHOTOMOD 6.0.2
• use data from bottom DEM (the second or the bottom DEM in the list, added for
merging, in the DEM merging – Step 1 from 2: Source data window);
• calculate and use average cells values of adjacent DEMs in overlap area.
10. [optional] By default the Open output DEM checkbox is set on that allows to open
the out put DEM after the operation is completed. Set the checkbox off to not load
the resulting DEM in the project.
11. Click OK to start DEM merging process.
To use distributed computing for DEMs merging do the following:
1. Change settings and run the distributed processing server/client (see the ’Distributed processing’ chapter in the ’General information about system’ User
Manual).
2. Click the Distributed processing button. The DEM distributed processing
window opens.
Fig. 100. DEM distributed processing
3. The number of DEM parts, which the DEM is split on during distributed processing, is calculated automatically and depends on the size of DEMs. It is recommended to specify Number of fragments per task assuming one task per
one computer.
4. Select the Temporary folder for distributed processing for temporary data
storing.
5. Define the output file name and path.
6. Click OK. Distributed processing tasks are created and the system shows a
message about number of created tasks.
127
DTM Generation
PHOTOMOD 6.0.2
7.7.2. Change DEM parts elevation
The system allows to align selected part of DEM by elevation. In this case, an average
elevation value of the DEM part is assigned to all cells of the DEM part outlined by selected polygon.
To align DEM part by elevation perform the following actions:
1. Create or load a vector layer (see the ’Vectorization’ User Manual).
2. Create single or multiple polygons, that outline selected parts of the DEM, or load
polygons layer to use them as boundaries.
3. Select at least one polygon that will be used as a boundary.
4. Choose DEM › Set elevation in selected polygons. The Parameters of DEM elevation assigning in polygons window opens.
Fig. 101. Parameters of DEM elevation assigning in polygons
5. In the Input DEM section click the
resources.
button to select input DEM in active profile
The DEM loaded to the project is selected by default.
6. [optional] To define name and target folder of output DEM in active profile resources,
click the
button.
By default the system suggests the <input dem name>_fill.x-dem name for output DEM
and to place it to the folder, containing input DEM file.
7. Specify value of DEM cells in each selected polygon:
• DEM average elevation in polygons;
• polygon average elevation.
128
DTM Generation
PHOTOMOD 6.0.2
8. Click OK. After that a specified average elevation value is assigned to all DEM cells
inside selected polygons.
7.7.3. DEM shift
The system provides possibility to shift the whole DEM by one or more axes using
parallel displacement.
In order to shift a DEM perform the following actions:
1. Load or create a DEM.
2. Select DEM › Shift. The DEM shift window opens.
Fig. 102. Parameters of DEM shift
3. Specify shift value by axes in the X, Y, Z fields in meters.
It is possible to shift a DEM by one or all axes at once.
4. Click OK. After that all points of active layer DEM are shifted on specified value by
selected axes with help of parallel displacement.
7.7.4. Split DEM into sheets
Splitting of DEM into sheet is available in the system. It is used to save DEM in parts
in separate files.
To split DEM into sheets perform the following:
1. Load or create DEM.
2. Choose Vectors › Open to load existed sheets or create polygons to use as sheets.
3. Make active the DEM layer.
4. Choose DEM › Split DEM by sheets. The Split DEM by sheets parameters
window opens.
129
DTM Generation
PHOTOMOD 6.0.2
Fig. 103. Split DEM by sheets parameters
5. Click on the layer with polygons in the list.
6. Choose the Attribute name to use its values as filenames.
If there is no chosen attribute for some sheets, these sheets can be passed or continuous
numbering can be used as file names.
7. Choose the Output path for files.
8. Click OK to start the process.
Perform the following to use distributed processing:
1. Change settings and run the distributed processing server/client (see the ’Distributed processing’ chapter in the ’General information about system’ User
Manual).
2. Click the Distributed processing button. The Split DEM to sheets: distributed
processing window opens.
Fig. 104. Distributed processing parameters
3. Number of sheets is calculated automatically and depends on number of
polygons.
It is trecommended to define Number of tasks based on “one task – one
computer”.
130
DTM Generation
PHOTOMOD 6.0.2
4. Choose the Output path for files.
5. Choose the Temporary path for temporary files.
6. Click OK. Distributed processing tasks are created and the system shows a
message about number of created tasks.
As a result DEM splits into parts by polygons of chosen layer. Values of selected
attribute are used as filenames.
7.7.5. DEM interpolating
The system supports local alignment of elevation values of DEM part, limited by a
polygon on a vector layer.
In order to align a part of DEM perform the following actions:
1. Create a vector layer (see the ’Vectorization’ User Manual).
2. Create single or multiple polygons, that outline selected parts of the DEM, or load
polygons layer to use them as boundaries.
3. Select at least one boundary polygon to be used for interpolation of cell elevation
values inside it.
4. Choose DEM › Interpolate elevation in selected polygons. The Parameters of
DEM interpolation assigning in polygons window opens.
Fig. 105. Parameters of DEM interpolation assigning in polygons
5. In the Input DEM section click the
resources.
button to select input DEM in active profile
The DEM loaded to the project is selected by default.
6. [optional] To define name and target folder of output DEM in active profile resources,
click the
button.
131
DTM Generation
PHOTOMOD 6.0.2
By default the system suggests the <input dem name>_fill.x-dem name for output DEM
and to place it to the folder, containing input DEM file.
7. Specify the DEM interpolation method:
• Smooth model;
• Polynomial model;
• Linear model.
8. Click OK. After that cell elevation values inside selected polygons (one or several)
is interpolated using specified method.
7.7.6. DEM cutting by polygons
The system allows to edit the area of DEM coverage.
In order to correct DEM area, perform the following actions:
1. Create vector layer and polygons in it, or open a layer with bordering polygons (see
the ’Vectorization’ User Manual).
2. Select one or more polygons, that will be used to cut the DEM.
3. Select DEM › Cut by selected polygons. The Polygon cutting parameters window
opens.
Fig. 106. Parameters of cutting by polygons
4. In the Input DEM section click the
resources.
button to select input DEM in active profile
The DEM loaded to the project is selected by default.
132
DTM Generation
PHOTOMOD 6.0.2
5. [optional] To define name and target folder of output DEM in active profile resources,
click the
button.
By default the system suggests the <input dem name>_cut.x-dem name for output DEM
and to place it to the folder, containing input DEM file.
6. Specify the Mode of DEM cutting:
• Cut outside – allows to crop DEM outside of selected polygons area;
• Cut inside – allows to cut DEM area located inside of selected polygons.
7. Click OK. After that resulting DEM obtained after editing is opened.
Fig. 107. DEM with areas cut inside polygons
Besides, the system allows to remove edge areas of DEM, that include null cells Perform
the following actions to do this:
1. Select DEM › Cut null edges. The Cut null edges window opens.
133
DTM Generation
PHOTOMOD 6.0.2
Fig. 108. DEM edges cutting
2. In the Input DEM section click the
resources.
button to select input DEM in active profile
The DEM loaded to the project is selected by default.
3. [optional] To define name and target folder of output DEM in active profile resources,
click the
button.
By default the system suggests the <input dem name>_cut.x-dem name for output DEM
and to place it to the folder, containing input DEM file.
4. Click OK. After that the system opens a DEM without removed edges areas.
7.7.7. The ’DEM editing’ toolbar
The system provides possibility of fast editing of DEM areas using selecting tools (see
details in the ’Objects selection’ chapter of the ’Vectorization’ User Manual). For this
there is an additional toolbar DEM editing with buttons that allow to perform the following
operations:
•
– allows to cut DEM area located inside of selected polygon;
•
– allows to set elevation of DEM cells inside of selected area;
•
– allows to interpolate selected DEM area using smooth model;
•
– allows to interpolate selected DEM area using polynomial model;
•
– allows to interpolate selected DEM area using linear model.
To quickly edit a DEM area perform the following actions:
1. Load a DEM or make active a layer with DEM.
2. Click the button of the DEM editing additional toolbar, to define operation to be
performed with DEM cells.
134
DTM Generation
PHOTOMOD 6.0.2
3. [optional] To specify elevation of selected DEM cells, set the elevation value in the
filed to the right from the
button.
4. Press and hold the Shift key and select area to be edited by mouse. The editing
is performed automatically using parameters specified by default.
7.8. Accuracy control of DEM creation
7.8.1. Creation of difference DEM
The system provides possibility to create difference DEM using subtraction of one DEM
from the other.
To create difference DEM perform the following actions:
1. Load at least two DEMs to be used for subtraction.
2. Select DEM › Check accuracy › Build difference DEM. The DEMs comparing
parameters window opens.
Fig. 109. Parameters of DEMs comparing
The list displays all loaded DEMs.
3. Select in the list a layer with DEM, from which the system will subtract. Use the
and
buttons to move it to the top of the list.
4. Select a way of resulting DEM creation:
• Difference – if there are null values in the top DEM, the output DEM will contain
null values in the same cells;
135
DTM Generation
PHOTOMOD 6.0.2
• Exclusive ’OR’ – if there are null values in the top DEM, in the output DEM these
null cells will be filled by values of the bottom DEM.
The final sign (positive or negative) of cells elevation in output DEM depends on sequence
of subtracting of one DEM from the other. The sign of the cells elevation in null area is
selected according to which of the DEMs from which is subtracted.
5. Select two DEMs in the list. To do this press and hold the Ctrl key and click the
DEM list by mouse.
The DEM from which the system performs the subtraction should be higher in the list, than
the subtrahend DEM.
6. In the Output DEM section click the
DTM in active profile resources.
button and specify name and path of output
7. Click OK. After that the system shows a message about operation successful or
unsuccessful completion. In case of success the system creates new layer in the
Manager.
For automatic positioning marker on active DEM surface the Marker Z coordinate
follows DEM in active layer check box is on by default in the general system’s parameters.
7.8.2. DEMs comparing
The system provides possibility of comparing of two DEMs for the same territory to
analyse their discrepancies by Z axis.
To compare DEMs perform the following actions:
1. Load DEMs to be compared.
2. Select DEM › Check accuracy › Compare DEMs. The DEMs compare parameters
window opens.
136
DTM Generation
PHOTOMOD 6.0.2
Fig. 110. Parameters of DEMs comparing
The list displays all loaded DEMs.
3. Set the following parameters:
• Display the worst..values – allows to show a list of specified number of points
with maximal error;
• Display with shift more than..m – allows to show a list of points with discrepancy
greater than specified.
4. Select two DEMs in the list. To do this press and hold the Ctrl key and click the
DEM list by mouse.
5. Click OK. The system starts operation of selected DEMs comparing. When the
operation is completed the Compare DEMs window opens.
Fig. 111. Parameters of DEMs comparing
The window displays a list of points coordinates, where:
137
DTM Generation
PHOTOMOD 6.0.2
• N – is picket serial number;
• X, Y, Z – coordinates of erroneous picket;
• DZ – discrepancy by Z.
The status line of the window displays root mean square error (RMS) of discrepancies,
Mean absolute, maximal discrepancy by Z found (Max), as well as Average discrepancy among points found.
The
button allows to save the table to file with csv extension.
Double click the point record line by mouse to select the point in the DEM active
layer.
7.8.3. Search for null cells
To perform analysis of DEM creation quality the system provides possibility of null cells
search in created DEM.
It is not recommended to search for null cells when processing big data amounts.
To search for null cells in DEM perform the following actions:
1. Load or create a DEM.
If multiple DEMs are loaded into project, the search is performed in the active DEM layer.
2. Select DEM › Check accuracy › Search for null cells. The Null cells searching
parameters window opens.
Fig. 112. Parameters of search for null cells
3. [optional] In DEM includes fragment that may contain null cells, set the Search for
DEM fragments checkbox on.
4. Input the image Pyramid level for null cells search.
Zero pyramid level corresponds to a source image.
138
DTM Generation
PHOTOMOD 6.0.2
5. Click OK. The system starts search for null cells operation. When the search is
completed the system opens the Null cells window or displays a message about
absence of null cells.
Fig. 113. Null cells list
The window displays a list of areas with null cells, where:
• N – is the area serial number;
• X,Y – coordinates of centers of null cells areas;
• (31) – number of null cells in area.
The
button allows to save the list to file with csv extension.
To create a vector layer that contain points on borders of null cells area, click the
button.
To edit DEM with null cells the system provides the following features:
• various methods of null cells filling (see Section 7.6);
• alignment of selected DEM fragment by elevation (see Section 7.6);
• vector objects editing and DEM rebuilding, when base vector layers are used for DEM
creation.
7.8.4. DEM control by TIN
The system provides possibility to control created DEM by TIN. The control is performed
by calculation of source TIN nodes discrepancies from created DEM.
To control created DEM perform the following actions:
1. Select DEM › Check accuracy › Check against TIN. The Parameters of check
DEM using TIN window opens.
139
DTM Generation
PHOTOMOD 6.0.2
Fig. 114. Parameters of DEM accuracy control by TIN
2. Set the following parameters:
• Display the worst..values – allows to show a list of specified number of TIN
nodes with maximal error;
• Display with shift more than..m – allows to show a list of points with discrepancy
from DEM by Z greater than specified.
3. Click OK. The system starts operation of selected DEMs comparing. When the
operation is completed the system opens the Check DEM using TIN window.
Fig. 115. Results of DEM control by TIN
The window displays a list of points coordinates, where:
• N – is serial number;
• X, Y, Z – coordinates of erroneous picket;
• DZ – discrepancy by Z between DEM and TIN.
The status line of the window displays root mean square error (RMS) of discrepancies,
Mean absolute, maximal discrepancy by Z found (Max) on points found.
The
button allows to save the list to file with csv extension.
Double click the point record line by mouse to select the point in the DEM active
layer.
140
DTM Generation
PHOTOMOD 6.0.2
A list of erroneous nodes includes those located on all stereopairs of current project.
4. [optional] To change the list display parameters, click the
display changes in the list click the
button.
button. In order to
5. To edit TIN using the list the system provides the following features:
• to remove selected TIN node, click the
button or press the Delete key;
• to remove all nodes, where the error is more or equal to the error selected in the
list, click the
button.
6. Click the
button, to re-build the DEM considering all changes.
7.8.5. DEM control by vector objects
The system provides possibility to control DEM creation quality by comparing DEM
vertices coordinates with coordinates of vertices of vector objects layer. This vector
objects layer should not be used as a base layer during this DEM or TIN creation.
DEM control by vector objects is needed to estimate accuracy of imported DEM or, vice
versa, of vector objects by ’master’ DEM.
During comparing vector objects with DEM the system compares Z-coordinates of
pickets or vector objects vertices with elevation in corresponding points of the DEM.
To control DEM creation against vector objects perform the following actions:
1. Select DEM › Check accuracy › Check against vector objects. The Parameters
of check DEM by vectors window opens.
Fig. 116. Parameters of accuracy control by vectors
2. Set the following parameters:
• Display the worst..values – allows to show a list of specified number of pickets
with maximal error;
• Display with shift more than..m – allows to show a list of points with discrepancy
from DEM by Z greater than specified.
141
DTM Generation
PHOTOMOD 6.0.2
3. Click OK. The system starts operation of selected DEMs comparing. When the
operation is completed the system opens the Check DEM using vector objects
window.
Fig. 117. Results of DEM control by vector objects
The window displays a list of points coordinates, where:
• N – is serial number;
• X, Y, Z – coordinates of erroneous picket;
• DZ – discrepancy by Z between DEM and vector objects vertices.
The status line of the window displays root mean square error (RMS) of discrepancies,
Mean absolute, maximal discrepancy by Z found (Max) on points found.
The
button allows to save the list to file with csv extension.
Double click the point record line by mouse to select the point in the DEM active
layer.
A list of erroneous nodes includes those located on all stereopairs of current project.
7.8.6. DEM control by triangulation points
The system provides possibility to control DEM creation quality by comparing DEM
vertices coordinates with coordinates of points located in triangulation points layer. This
triangulation points layer should not be used during this DEM creation.
To do this use the TIN › Check accuracy › Check against triangulation points menu
item.
It is not necessary to create points vector layer.
142
DTM Generation
PHOTOMOD 6.0.2
The Accuracy control window includes a table of all points (GCP/check/tie), acquired
on on aerial triangulation step (see the ’Aerial triangulation’ User Manual).
Fig. 118. Accuracy control using triangulation points
The top toolbar of the window is used to setup of triangulation points display in the list:
Gr.control, Check, Tie, Targeted, Measured only (triangulation points with Z coordinate
calculated during DEM creation), Adjusted.
The Used points field is used to display number of points used for calculation of DEM
deviation by Z-coordinate (in the Use column the
is set).
The table of triangulation points contains the following columns:
• Name – point number;
• Type – point type: GCP, check or tie point;
• Use – data about point use for calculating of DEM deviation by Z-coordinate:
○
– the triangulation point was used;
○
– the triangulation point was not used;
○
– the triangulation point cannot be used, since it was not used for adjustment.
• X, Y, Z – adjusted coordinates of triangulation points;
• Ez – value of DEM deviation from the triangulation point by Z-coordinate.
Status panel is used to display values of root mean square error (RMS) and a value of
maximal error of DEM deviation by Z-coordinate (Max).
143
DTM Generation
PHOTOMOD 6.0.2
The
button allows to display in the list a point with maximal error of deviation from
triangulation points by Z-coordinate.
The
button allows to display detailed report on accuracy control.
Fig. 119. Report on accuracy control using triangulation points
The top panel of the Report window contains the following buttons:
•
– allows to close report window;
•
– allows to save a report to file system of Windows;
•
– allows to change font, style, size, and color of report text;
•
– allows to print a report.
7.9. DEM saving
The system allows to save a DEM to file with x-dem extension. File name and target
folder to place DEM in active profile resources should be specified prior to the DEM
creation.
To save opened DEM to a new file the system provides the DEM › Save copy... menu
item.
To save DEM area select a part of the DEM (see the chapter ’Vector objects selection’
in the ’Vectorization’ User Manual) and choose DEM › Save selection.
To save a DEM as a raster file with geodetic reference perform the following actions:
144
DTM Generation
PHOTOMOD 6.0.2
1. Load DEM.
2. Select DEM › Save as georeferenced raster.... The Settings window opens.
Fig. 120. Parameters of saving DEM to raster file
3. In the Output file section click the
button and specify name and target folder
of output DEM out active profile resources.
4. Select Output file type – TIFF or Windows BMP.
5. Select Georeferenced file type:
• No – if there is no georeferenced files;
• PHOTOMOD GEO;
• ArcWorld TFW;
• MapInfo TAB.
6. [optional] To create additional interior system file in MS TIFF format, that allows to
use output raster file in the system without any conversion, set the Create MS TIFF
checkbox on.
7. [optional] To save as an image the level of the pyramid that is different from the
original, specify the Layer number.
8. Select the Colorization of output file – Color or Grayscale.
9. [optional] To increase the detail of the display when save the DEM as a raster file,
set the Hypsometry checkbox on.
10. Click OK. After that the system creates file with raster representation of the DEM,
and georeferenced file as well.
145
DTM Generation
PHOTOMOD 6.0.2
7.10. DEM recovering
The system provides possibility to recover DEM’s consistency, which may be disrupted
by applying of DEM editing or filtering operations.
To recover a DEM perform the following actions:
1. Load a DEM in the project.
2. Select DEM › Recover. The Rebuild DEM pyramid window opens.
Fig. 121. DEM recovering
3. Select the following parameters of DEM recovering:
• Rebuild fragment pyramids – allows to rebuild a DEM by fragments (tiles) if
the DEM consist of them;
• Rebuild common pyramid (is set on by default) – allows to rebuild common
pyramid for DEM;
• Recalculate elevation bounds – allows to change DEM colour representation
after changing its boundaries elevation.
4. Click OK. After that the system rebuilds DEM and shows a message about successful or unsuccessful DEM update.
7.11. DEM loading
The system allows to load saved DEM both from active profile resources and from file
that is out of active profile resources.
In order to load a DEM from active profile resources, do the following:
1. Select DEM| Load (Ctrl+O, D) or click the
window opens.
146
buttons of the main toolbar. The Open
DTM Generation
PHOTOMOD 6.0.2
Fig. 122. DEM loading
2. Select one or multiple DEM files in active profile resources with x-dem extension.
When multiple files are selected, each DEM is loaded to separate layer.
3. Click Open. If one or multiple DEM containing layers are already loaded to active
layer, then during loading of a new layer the window of loading type is opened.
Fig. 123. DEM loading
The system provides the following possibilities of new layer loading to existing DEM
layer:
• Clear layer and continue loading into it – data of active layer is replaced by
data from loading layer;
• Create new layer and load data into it – data is loaded to a new layer.
Corresponding DEM layers are displayed in Manager.
147
DTM Generation
PHOTOMOD 6.0.2
To load DEM from external data without its conversion to internal format the DEM ›
Open from file... menu item is used.
DEM loading and opening in format with extension different from x-dem may take a lot of time.
The system also allows to transfer lidar data to a DEM (see the ’LIDAR Data processing’
User Manual).
7.12. DEM export
7.12.1. Convert DEM to pickets
The system allows to convert DEM cells pickets with specified simplifying.
To do this conversion perform the following actions:
1. Load or create a DEM.
2. [optional] Load vector layer and select polygons, within which it is necessary to
perform the conversion.
3. Select DEM › Convert to points.... The Parameters of converting to points
window opens.
Fig. 124. Parameters of DEM converting to pickets
4. Specify Thinout coefficient of DEM.
Depending on this coefficient the system calculates the Cell size of output DEM in
meters, Height and Width in meters and in pickets number. Besides, the estimated
Number of output points is displayed in this window.
148
DTM Generation
PHOTOMOD 6.0.2
5. [optional] If additional vector layer with polygons is loaded, set the Convert inside
selected polygons checkbox on and select a layer with polygons in the list to
perform conversion in specified areas only.
6. Click OK. When the conversion is completed the system displays a message about
number of acquired pickets and new vector layer with obtained pickets is created.
7.12.2. DEM export
The system provides possibility of DEM export to the following formats.
• ArcInfo ASCII grid – exchange format with asc or grd extension, that is used in the
program ArcInfo;
• ASCII – exchange text format with txt extension, that is supported by a large number
of programs with different specializations (see description of the format in the ’Vectorization’) User Manual;
• Panorama MTW – exchange format with mtwextension, that is used in the program
GIS Map 2000;
• SurferASCII grid – exchange format with grdextension, that is used in the program
Surfer;
• USGS DEM – exchange format with dem extension, developed in United States
Geological Survey (USGS).
To export DEM, for example, to ArcInfo ASCII grid format choose DEM › Export ›
ArcInfo ASCII grid.... The Export to ArcInfo grid window opens. Choose a folder to
place a file in Windows file system. Specify a file name in the File name input field.
Click the Save button to complete the export.
7.12.3. Export to CSV
The system provides possibility of DEM export to CSV format. CSV format is exchange
text format with csv extension, which is supported by major applications in different industries. It is used as exchange format when special geospatial data formats are not
applicable for some reason.
In order to export DEM to CSV format perform the following actions:
1. Select DEM › Export › CSV. The Export to CSV window opens.
2. Choose a folder to place a file to file system of Windows.
3. Click the Save button. The Export to CSV window opens.
149
DTM Generation
PHOTOMOD 6.0.2
Fig. 125. Parameters of export to CSV format
4. [optional] To fill DEM null cells set the Set value for null cells checkbox on and
input necessary value to the input field in meters.
5. [optional] To split CSV-file into separate parts, set the Split into fragments
checkbox on.
6. In the Decimal separator section select point or comma to be used to separate
coordinates.
7. In the Field separator section choose, what is used to separate fields: comma,
space, tab, semicolon or other delimiters.
If the Field separator is selected as a comma, it is not recommended to specify the
Decimal separator as a comma, since objects with incorrect coordinates will be created
after export operation.
8. [optional] In order to swap coordinate system (left/right) during DEM export, set the
Swap X Y checkbox.
If the Swap X Y checkbox is off, the initial data will be imported in the right coordinate
system. Otherwise, in the left one.
9. Click OK to complete the export operation.
7.12.4. Export to DTED
The system provides possibility of DEM export to Digital Terrain Elevation Data (DTED)
format. This is exchange format with dt2 extension, that is used in the following programs: ESRI ArcGIS Desktop and Pitney Bowes MapInfo.
In order to export DEM to DTED format perform the following actions:
1. Select DEM › Export › DTED. The Export to DTED window opens.
150
DTM Generation
PHOTOMOD 6.0.2
2. Choose a folder to place a file in Windows file system.
3. Specify a file name in the File name input field.
4. Click the Save button. The Settings window opens.
Fig. 126. Parameters of export to DTED format
To export the data type having an integer value in the Data type field the Int16
parameters is set by default (integer data type is used to represent numbers in the
range from -32 768 to 32 767).
5. [optional] To fill DEM null cells specify the Set value for null cells parameter in
meters.
6. Click OK to complete the export operation.
7.12.5. Export to ERDAS Imagine
The system provides possibility of DEM export to ERDAS Imagine format. This is exchange format with img extension, that is used in the following programs: ERDAS Imagine
and ESRI ArcGIS Desktop.
In order to export DEM to ERDAS Imagine format perform the following actions:
1. Select DEM › Export › ERDAS Imagine. The Export to ERDAS Imagine window
opens.
2. Choose a folder to place a file in Windows file system.
3. Specify a file name in the File name input field.
4. Click the Save button. The Settings window opens.
Fig. 127. Parameters of export to ERDAS Imagine format
151
DTM Generation
PHOTOMOD 6.0.2
5. Choose in the Data type list one of the following data types:
• UInt 8 – integer data type, that is used to represent numbers in the range from
0 to 255;
• Int 8 – integer data type, that is used to represent numbers in the range from 128 to 127;
• UInt 16 – integer data type, that is used to represent numbers in the range from
0 to 65535;
• Int 16 – integer data type, that is used to represent numbers in the range from 32,768 to 32,767;
• UInt 32 – integer data type, that is used to represent numbers in the range from
0 to 4,294,967,295;
• Int 32 – integer data type, that is used to represent numbers in the range from 2,147,483,648 to 2,147,483,647;
• Float 32 – data type, that is used to represent numbers with floating point in the
range from 3.4е-038 to 3.4е+038;
• Float 64 – data type, that is used to represent numbers with floating point in the
range from 1.7е-308 to 1.7е+308.
6. [optional] To fill DEM null cells specify the Set value for null cells parameter in
meters.
7. Click OK to complete the export operation.
7.12.6. Export to GeoTIFF
The system allows to export DEM to GeoTIFF format, that is exchange format with tif
extension. GeoTIFF format – is common format for storing georeferenced images.
Information about used coordinates system for DEM are displayed as a code of European
Petroleum Survey Group (EPSG) standard.
In order to export DEM to GeoTIFF format perform the following actions:
1. Select DEM › Export › GeoTIFF. The Export to GeoTIFF window opens.
2. Choose a folder to place a file in Windows file system.
3. Specify a file name in the File name input field.
4. Click the Save button. The Settings window opens.
152
DTM Generation
PHOTOMOD 6.0.2
Fig. 128. Parameters of export to GeoTIFF format
5. Choose in the Data type list one of the following data types:
• UInt 8 – integer data type, that is used to represent numbers in the range from
0 to 255;
• Int 8 – integer data type, that is used to represent numbers in the range from 128 to 127;
• UInt 16 – integer data type, that is used to represent numbers in the range from
0 to 65535;
• Int 16 – integer data type, that is used to represent numbers in the range from 32,768 to 32,767;
• UInt 32 – integer data type, that is used to represent numbers in the range from
0 to 4,294,967,295;
• Int 32 – integer data type, that is used to represent numbers in the range from 2,147,483,648 to 2,147,483,647;
• Float 32 – data type, that is used to represent numbers with floating point in the
range from 3.4е-038 to 3.4е+038;
• Float 64 – data type, that is used to represent numbers with floating point in the
range from 1.7е-308 to 1.7е+308.
6. [optional] To fill DEM null cells specify the Set value for null cells parameter in
meters.
7. Click OK to complete the export operation.
7.12.7. Export to PCIDSK
The system allows to export DEM to PCIDSK format, that is exchange format with pix
extension and is used in the following program: PCI Geomatics Geomatica.
In order to export DEM to PCIDSK format perform the following actions:
1. Select DEM › Export › PCIDSK. The Export to PCIDSK window opens.
153
DTM Generation
PHOTOMOD 6.0.2
2. Choose a folder to place a file in Windows.
3. Specify a file name in the File name input field.
4. Click the Save button. The Settings window opens.
Fig. 129. Parameters of export to PCIDSK format
5. Choose in the Data type list one of the following data types:
• UInt 8 – integer data type, that is used to represent numbers in the range from
0 to 255;
• Int 8 – integer data type, that is used to represent numbers in the range from 128 to 127;
• UInt 16 – integer data type, that is used to represent numbers in the range from
0 to 65535;
• Int 16 – integer data type, that is used to represent numbers in the range from 32,768 to 32,767;
• UInt 32 – integer data type, that is used to represent numbers in the range from
0 to 4,294,967,295;
• Int 32 – integer data type, that is used to represent numbers in the range from 2,147,483,648 to 2,147,483,647;
• Float 32 – data type, that is used to represent numbers with floating point in the
range from 3.4е-038 to 3.4е+038;
• Float 64 – data type, that is used to represent numbers with floating point in the
range from 1.7е-308 to 1.7е+308.
6. [optional] To fill DEM null cells specify the Set value for null cells parameter in
meters.
7. Click OK to complete the export operation.
154
DTM Generation
PHOTOMOD 6.0.2
7.13. DEM import
The system allows to import DEM from files with the following extensions: grd, asc, tif,
dem, mtw, dt1, dt2, img, pix, hgt.
In order to perform import of DEM from a file of supported format, do the following:
1. Select DEM › Import. The DEM import window opens.
2. In the file system of Windows select a DEM file.
3. Click the Open button. The DEM import window opens.
Fig. 130. Parameters of DEM import
4. [optional] To convert DEM cells with specified values to null cells, set the Convert
the following value to null cells checkbox and define necessary value.
5. [optional] To prevent creating text attributes with an empty value during import, set
the Do not create empty text attributes checkbox on.
When the Do not create empty text attributes checkbox is on, in some cases a data loss
may occur.
6. [optional] In order to swap coordinate system during DEM import, set the Swap X
Y checkbox on.
If the Swap X Y checkbox is set off, the initial data will be imported in the right coordinate
system. Otherwise, in the left one.
7. Click OK. The Destination file window opens.
155
DTM Generation
PHOTOMOD 6.0.2
Fig. 131. Imported DEM saving
8. Select target file placement in active profile resources and click Save.
The system allows to import DEM in batch mode from files with the following extensions:
grd, asc, tif, dem, mtw, dt1, dt2, img, pix, hgt. During batch import the system loads
multiple files from specified folder at once.
In order to import necessary number of layers, containing DEMs, from specified folder,
perform the following actions:
1. Select DEM › Batch import. The DEM import window opens.
2. In the file system of Windows select multiple files with DEM.
3. Click the Open button. The DEM import window opens.
Fig. 132. Parameters of DEM import
4. [optional] To convert DEM cells with specified values to null cells, set the Convert
the following value to null cells checkbox and define necessary value.
5. Click OK. The Select folder window opens.
156
DTM Generation
PHOTOMOD 6.0.2
Fig. 133. Imported DEM saving
6. Select a folder or create a new one using the Create... button.
7. Click OK to complete the import operation.
157