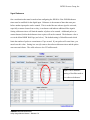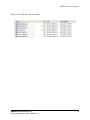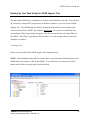
1
JNIOR Series 3 A Network I/O Resource Utilizing the JAVA Platform Utility Usage Monitor Manual Release 5.0 NOTE: JNIOR OS 4.3 or greater required INTEG Process Group, Inc. 2919 East Hardies Rd, First Floor Gibsonia, PA 15044 PH (724) 933-9350 FAX (724) 443-3553 www.integpg.com [email protected] © 2012 INTEG Process Group, Inc. All Rights Reserved Last updated on: October 31, 2012 INTEG Process Group, Inc TABLE OF CONTENTS Introduction 1 Hardware Connections 1 Signal Debounce 2 Software Installation 3 Setting the JNIOR Date, Time and Time Zone 3 Utility Usage Monitor Registry Keys 6 Instantaneous Flow Settings 10 Data Storage 11 Utility Web Screen 12 Utility Usage Monitor Charts 13 Instantaneous Chart 14 6-Minute Chart 17 Hourly Chart 18 Weekly Chart 19 Monthly Chart 20 Yearly Chart – By Weeks 21 Yearly Chart – By Months 22 Saving Your Data via the Web Page 23 Backing Up Your Data Using the JNIOR Support Tool 25 Clearing Your Current Data 26 JNIOR A Network I/O Resource Utility Usage Monitor Manual – Release 5.0 2 INTEG Process Group, Inc Introduction Welcome to the Utility Usage Monitor application for the INTEG JNIOR. It is designed to help you monitor your utility meters (gas, water, electric, steam, biogas, etc.) or any other meter and report your totalized consumption on a 6-minute, hourly, daily, weekly, monthly and yearly basis and also chart your instantaneous flow. There are two parts to this application. There is a part that runs on the JNIOR and a part that you view via your web browser (Java Applet). A Java plug-in will be required to run with your browser for the Utility Usage Monitor web screen to work properly. If your PC does not already have the Java plug-in, please visit www.java.com to verify you have it and/or to download it. Hardware Connections The Utility Usage Monitor application requires, at a minimum, 1 pulsed signal connected to one digital input on the JNIOR that represents a totalized pulse of x amount of the utility (gas, electric, etc.) where x is determined by the meter configuration. The pulses are counted on the JNIOR to sum the flow (pulse counts) on an hourly basis. An optional analog signal representing the instantaneous flow can be connected to an analog expansion module. The Utility Usage Monitor application can handle up to eight (8) meters (one pulsed signal and one instantaneous flow per meter). The user can connect the totalized pulse signal to any one of the digital inputs. The instantaneous flow must be connected to the corresponding analog signal number. For example, if the totalized count signal is connected to digital input 3, then the instantaneous flow signal must be connected to analog input 3. If the totalized count signal is connected to digital input 7, then the instantaneous flow signal must be connected to analog input 7 (which is analog input 3 on the “second” analog expansion module). By going to the main JNIOR web page and then the I/O Control/External tab, you can see the “number” assigned to each analog input. JNIOR A Network I/O Resource Utility Usage Monitor Manual – Release 5.0 1 INTEG Process Group, Inc Signal Debounce One consideration that must be made when configuring the JNIOR is if the JNIOR debounce timer must be modified for the digital input. Debounce is the amount of time that must pass before another input pulse can be counted. This is needed because when a signal is activated, especially a contact closure from a relay, it can bounce and indicate additional false signals. Setting a debounce timer will limit the number of pulses to be counted. Additional pulses (or contact bounces) before the debounce timer expires will not be counted. The debounce value is set via the Main JNIOR Web Page (see below). The default setting is 200 milliseconds which limits the number of pulses to a maximum of 5 per second. If your pulses will come faster, you must lower this value. Setting it to zero (0) removes the software debounce timer and the pulses can come much faster. The valid values are 0 to 255 milliseconds. Input 3 has a debounce setting of 0 milliseconds or ‘no software debounce’. JNIOR A Network I/O Resource Utility Usage Monitor Manual – Release 5.0 2 INTEG Process Group, Inc Software Installation If the Utility Usage Monitor software was not already installed on your JNIOR prior to shipment, it can be easily added using the JNIOR Support Tool. Please visit our website to download the JNIOR Support Tool and the installation project for the Utility Usage Monitor application. The project will install the Utility web page, JNIOR application and set the program to run on boot. The Utility Usage Monitor application version 5.0 requires JNIOR operating system (OS) 4.3 or greater. The Update project that loads the Utility software on your JNIOR does NOT contain a step that will update your JNIOR OS. You must do this separately. An All-in-One software update package that includes a new OS for the JNIOR is available on our website in the JNIOR Downloads area. However, please make sure you run the OS update BEFORE you load the Utility software as the Utility Update replaces some common files used for the Utility web page. Setting the JNIOR Date, Time and Time Zone For proper data storage and graphing, it is important that you set the correct date and time on your JNIOR. The time is set on the JNIOR at the factory and since the JNIOR clock is battery backed, the time should be relatively accurate when you receive your JNIOR. However, the default time zone is GMT (Greenwich Mean Time) and must be changed. You must set the JNIOR time zone to your location. This is done via the JNIOR Support Tool or via the Command Line tab in the Main JNIOR Web Page or via a Telnet or HyperTerminal Session. The following commands are used in the Command Line tab or a Telnet session. Please see the JNIOR Support Tool Manual for instructions on how to use it. JNIOR A Network I/O Resource Utility Usage Monitor Manual – Release 5.0 3 INTEG Process Group, Inc If you ‘right click’ on your JNIOR in the Beacon tab on the JNIOR Support Tool and select Configuration, a window will be displayed that will allow you to set the time zone for your JNIOR. JNIOR A Network I/O Resource Utility Usage Monitor Manual – Release 5.0 4 INTEG Process Group, Inc From the Command Line (or Telnet or HyperTerminal) prompt you can type any of the following commands and then hit enter (return) to determine the date, time and time zone: date The current date and time zone will be displayed. date –t Displays the valid time zones date EST Sets the time zone for EST (please pick yours from the list) (NOTE: The time zone must be typed as all CAPITAL Letters) help date Lists all the features available with the date command If you open the Main JNIOR Web page and go the Configuration tab and then the Misc tab, you can define an NTP Server URL or IP address. (NTP = Network Time Protocol). If the JNIOR can reach the NTP server IP address or has a DNS server IP address entered in its configuration to resolve a URL, then the JNIOR will sync its time every 4 hours with this NTP server. JNIOR A Network I/O Resource Utility Usage Monitor Manual – Release 5.0 5 INTEG Process Group, Inc Utility Usage Monitor Registry Keys The user can configure the Utility Usage Monitor system via the following Registry Keys. The keys are displayed in the JNIOR Registry System after the Utility program is started for the first time. You can edit the keys from the Main JNIOR Web Page via the Registry Editor tab. AppData/Utility/AltTextChannelX AppData/Utility/Externals AppData/Utility/FirstDayOfWeek AppData/Utility/HoursToDump AppData/Utility/InstTextChannelX AppData/Utility/Name AppData/Utility/Title AppData/Utility/UnitLabelTextChannelX AppData/Utility/UnitsPerPulseX AppData/Utility/UsedInput The functionality of each key is as follows: AltTextChannelX – a free form field where you can enter any additional information (for example amount of material per pulse) that is displayed on the fourth line of each chart except for the instantaneous flow chart. There are individual keys for channels 1 through 8 (X is the channel number). Externals – the unique ID number given to each analog expansion module for the JNIOR. This number is detected and automatically written to the Registry Key by the Utility Usage Monitor program running on the JNIOR. The number is also on the label on the side of the analog expansion box and/or can be viewed from the Main JNIOR Web Page under the external devices JNIOR A Network I/O Resource Utility Usage Monitor Manual – Release 5.0 6 INTEG Process Group, Inc tab. Zero, one or two numbers will be displayed depending upon the number of analog expansion modules being used. The user does not edit this key. FirstDayOfWeek – This is the day of week that will be used to start the summation of the daily usage for the total week calculation. The default day is Sunday (Sun). The allowable values are Sun, Mon, Tue, Wed, Thu, Fri, or Sat. HoursToDump – the JNIOR always stores 24 hours worth of data for the instantaneous signal in battery backed RAM on the JNIOR. The HoursToDump key sets the amount of this data to be sent to the Utility Usage Monitor web page when it first loads. The default value is 4 (for the most recent 4 hours of data) and the range is 0 – 24 in whole numbers. The larger you make this number the longer it can take for the Utility Usage Monitor web page to completely load. InstTextChannelX – a free form field where you can enter any additional information (for example the type of material being monitored) that is displayed only at the top of the instantaneous flow chart. There are individual keys for channels 1 through 8 (X is the channel number). Name – the name of the JNIOR program, Utility. The user does not edit this key. Title – a common title that is displayed on the first line of each chart. UnitLabelTextChannelX – the text to describe the unit measurement for the totalized flow, for example, cubic feet, cubic meters, gallons, kilowatts, etc. This text will be used along the bottom of each chart to the right of the Current Consumption value and will also be used when holding the mouse over any bar chart. There are individual keys for channels 1 through 8 (X is the channel number). UnitsPerPulseX – a number that represents the quantity of the material (gas, electric, etc.) per pulse from the flow meter. The Utility Usage Monitor web display multiplies the count value received from the JNIOR by this value (Units Per Pulse) for display purposes. There are individual keys for channels 1 through 8 (X is the channel number). JNIOR A Network I/O Resource Utility Usage Monitor Manual – Release 5.0 7 INTEG Process Group, Inc UsedInput – the signal (channel) number on the JNIOR that will be loaded when the web page is first launched. The user can display other signals by using the pull down on the web page. The default value is 1. The acceptable values are 1 – 8. The following are screen shots of the default Registry Keys for the Utility Usage Monitor application as viewed from the main JNIOR web page on the Registry Editor tab. The keys with a $ are temporary keys used by the program and must not be changed by the user. Please read the above descriptions for the meaning of each key. Default Key Settings (shows top half of window) JNIOR A Network I/O Resource Utility Usage Monitor Manual – Release 5.0 8 INTEG Process Group, Inc Default Key Settings (shows bottom half of window) JNIOR A Network I/O Resource Utility Usage Monitor Manual – Release 5.0 9 INTEG Process Group, Inc Instantaneous Flow Settings The following configuration items are set via the analog expansion module display on the Main JNIOR Web Page. Right click in the analog input area to display the configuration box. Y- Axis Scaling on the Instantaneous Flow Chart. The Minimum and Maximum values entered for the analog input via the Main JNIOR Web Page become the minimum and maximum values for the y-axis on the Instantaneous Flow Chart. Units Displayed at the bottom of the Charts – read from the analog input Units configuration for the specific analog input. JNIOR A Network I/O Resource Utility Usage Monitor Manual – Release 5.0 10 INTEG Process Group, Inc Data Storage The Utility Usage Monitoring System logs the utility consumption on an hourly, daily, weekly, monthly and yearly basis to files located ON the JNIOR. The system also displays an instantaneous flow (when an analog signal is present) and the amount consumed in 6-minute intervals, however, these values are stored in ‘memory only’ on the JNIOR and are not stored in a log file on the JNIOR. The hourly, daily, weekly, monthly and yearly utility consumption data is stored on the JNIOR in the www/logs directory on the following time intervals. These logs can be copied from the JNIOR to a PC by using the JNIOR Support Tool and the Snapshot tab. This feature is describing later in this manual in the section called Backing Up Your Data. Hourly – a rolling 24 hour file (new hour replaces oldest hour, so oldest data – 25th hour – is overwritten every hour) and stored as hourly.csv. Weekly – a rolling 7 day file (new day replaces oldest day at midnight, so oldest data – 8th day – is overwritten at midnight) and stored as weekly.csv. Monthly – a file created for each month of the year (not deleted, but will be overwritten when the month occurs in the following year) and stored, for example, as Jan.csv where Jan represents the month of January, and so on. Yearly – a file created once a year and stored as ‘year’.csv, for example 2012.csv, and is not overwritten. At the bottom of Utility web page is a SAVE button. When you click on the Save button, the data currently loaded in the web page will be saved to your PC as CSV files. A pop-up is displayed that allows you to navigate and/or create a new folder to store the data. This data INCLUDES the instantaneous values and the 6-minute interval data. This feature is described later in this manual. JNIOR A Network I/O Resource Utility Usage Monitor Manual – Release 5.0 11 INTEG Process Group, Inc Utility Web Screen The web screen brings a user friendly aspect to the application. There is one screen you will need to use to view the data stored by the Utility Usage Monitor application. To view the web page, type the following in your web browser: http://10.0.0.188/utility.html where 10.0.0.188 is replaced with the IP address of your JNIOR. When the Utility Usage Monitor Charts load, the channel configured to load first is the one configured in the Used Input Registry key. There is a pull down along the bottom of the charts that allows you to switch to a different input signal. Unit Label Text Instantaneous Flow Text Set via Registry Key Set via External Module Tab JNIOR A Network I/O Resource Utility Usage Monitor Manual – Release 5.0 12 INTEG Process Group, Inc Utility Usage Monitor Charts The Utility Usage Monitor web screen is designed to give you both current and historical information about your utility consumption. By holding the mouse over the thumbnails on the screen you can see the names of the various charts, including instantaneous, hours of the day, days of the week, days of the month, and weeks of the year. When one of these thumbnails is selected by clicking on it, the associated chart will be displayed in the main area on the screen. When a chart is selected there are a couple of options that can be invoked by right clicking on the graph itself. All of the charts, with the exception of the instantaneous chart, will give you the same choices. The exception being that the instantaneous chart has the ability to vary the timeframe for the data to be displayed. When a right click is performed you will have the following options to print the chart; Print Current Chart This option will open a print dialog and offer to print the current visible chart. Print All Charts This option will open a print dialog and offer to send all charts to the printer. When selecting a print option, you will be prompted with a Java print warning message. This is because the applet is not fully trusted by your PC. Select “OK” to continue. Selecting “Cancel” will abort the printing process. JNIOR A Network I/O Resource Utility Usage Monitor Manual – Release 5.0 13 INTEG Process Group, Inc Instantaneous Chart The instantaneous chart displays the instantaneous flow for the utility meter (if the signal is available). The amount of data loaded when you first launch the web page is defined by the Hours to Dump Registry Key. The chart has additional options that allow you to change the amount of data (time based) to display to 1 Hour, 2 Hours, 4 Hours, 8 Hours, and Show All. The default is Show All. Once you select another option, the web page will continuously display that amount of data. You can also scroll left or right in the graph by ‘left clicking’ on the graph and dragging your cursor left or right. A red line will be displayed to indicate the location and value for that point on the chart. NOTE: The Instantaneous Chart is not designed to be displayed for long periods of time. The data will continue to accumulate in your PC as long as the web page is open and may slow it down. Adjustable text via Registry Keys Move the mouse to display the value at any location on the graph Min and Max value based on all of the instantaneous data JNIOR A Network I/O Resource Utility Usage Monitor Manual – Release 5.0 14 INTEG Process Group, Inc The instantaneous chart will get its initial data from the JNIOR when the Web screen is launched. All other updates are dynamic updates directly from the JNIOR. These will occur every 15 seconds. The instantaneous data is also stored in the JNIOR once a minute for up to 24 hours in battery backed RAM so that if you close the Applet and launch it later, the data recorded while the Applet was open will still be available. The amount loaded into the Applet is dependent upon the HoursToDump Registry Key setting. The X axis scale will change automatically to fit whatever time basis is selected and the Y axis will scale according to the scale of the analog input entered for the analog expansion module. The analog input scale is entered via the Main JNIOR Web Page. The Y axis scale on all the charts can also be adjusted via a ‘zoom’ feature. When you right click on a chart, you can select Set Custom Y Scale. After you click on this, you can then ‘left click’ on the chart and drag the mouse to highlight the Y axis range you want displayed. The Y axis will change its scaling accordingly. To return to full scale, right click and select Clear Custom Y Scale. The following screen shot shows the graph after ‘highlighting’ the range. JNIOR A Network I/O Resource Utility Usage Monitor Manual – Release 5.0 15 INTEG Process Group, Inc The following screen shot shows the ‘zoomed in’ Y axis range. JNIOR A Network I/O Resource Utility Usage Monitor Manual – Release 5.0 16 INTEG Process Group, Inc 6-Minute Chart The 6-minute chart displays the totalized count in 6-minute intervals for the last 8 days. There is a scroll bar that allows you to view historical data. The vertical axis scaling (Y-axis) is automatically calculated for display purposes. If you ‘mouse over’ any specific column, it will display the start time for the 6-minute interval and the actual amount recorded for that period. You can zoom in on the graph by ‘right-clicking’ and setting a Custom Y Scale. NOTE: The 6 minute data is stored in battery backed memory in the JNIOR and is not stored in a file. However, you can save this data to a file by clicking on the SAVE button in the lower right corner of the web page. The SAVE function is described later in this manual. Adjustable text via Registry Keys Scroll bar so you can view 8 days worth of data JNIOR A Network I/O Resource Utility Usage Monitor Manual – Release 5.0 17 INTEG Process Group, Inc Hourly Chart The hourly chart displays the rolling 24 hour period for the totalized count. The vertical axis scaling (Y-axis) is automatically calculated for display purposes. If you ‘mouse over’ any specific column, it will display the hour and the actual amount recorded for that period. You can zoom in on the graph by ‘right-clicking’ and setting a Custom Y Scale. JNIOR A Network I/O Resource Utility Usage Monitor Manual – Release 5.0 18 INTEG Process Group, Inc Weekly Chart The weekly chart displays the rolling 8 day period for the totalized count. The vertical axis scaling (Y-axis) is automatically calculated for display purposes. If you ‘mouse over’ any specific column, it will display the date and the actual amount recorded for that period. You can zoom in on the graph by ‘right-clicking’ and setting a Custom Y Scale. JNIOR A Network I/O Resource Utility Usage Monitor Manual – Release 5.0 19 INTEG Process Group, Inc Monthly Chart The monthly chart displays the 31 day period for the current month for the totalized count. The vertical axis scaling (Y-axis) is automatically calculated for display purposes. If you ‘mouse over’ any specific column, it will display the date and the actual amount recorded for that period. You can zoom in on the graph by ‘right-clicking’ and setting a Custom Y Scale. JNIOR A Network I/O Resource Utility Usage Monitor Manual – Release 5.0 20 INTEG Process Group, Inc Yearly Chart – By Weeks The yearly chart displays the 53 week period for the current year for the totalized count. The multiplier at the top (x 10000 on the chart below) is automatically calculated for display purposes and is the amount to multiply for the y-axis. If you ‘mouse over’ any specific column, it will display the week number and the actual amount recorded for that period. JNIOR A Network I/O Resource Utility Usage Monitor Manual – Release 5.0 21 INTEG Process Group, Inc Yearly Chart – By Months The yearly chart displays the 53 week period for the current year for the totalized count. The multiplier at the top (x 10000 on the chart below) is automatically calculated for display purposes and is the amount to multiply for the y-axis. If you ‘mouse over’ any specific column, it will display the week number and the actual amount recorded for that period. JNIOR A Network I/O Resource Utility Usage Monitor Manual – Release 5.0 22 INTEG Process Group, Inc Saving Your Data via the Web Page When you are viewing the Utility web page, you can save the data displayed in the various charts by clicking on the SAVE button in the lower right corner of the Utility web page. When you click the SAVE button, a file save window will be displayed that will allow you to navigate to the folder where you want to save the data. You can also create a new folder from this window. The data for each graph will be saved in CSV formatted files. You can then use a program such as Microsoft Excel to view the data, manipulate it, etc. JNIOR A Network I/O Resource Utility Usage Monitor Manual – Release 5.0 23 INTEG Process Group, Inc Below is a list of the files that are created. JNIOR A Network I/O Resource Utility Usage Monitor Manual – Release 5.0 24 INTEG Process Group, Inc Backing Up Your Data Using the JNIOR Support Tool The data on the JNIOR will eventually be overwritten as described for each chart. You can back up your data by using an FTP program such as Windows Explorer, or you can use the JNIOR Support Tool. The JNIOR Support Tool has a Snapshot tab that allows you to transfer all or some of the files from a JNIOR. By using the filter feature, you can elect to transfer the files created by the Utility Usage Monitor program. The files are stored in the www/logs folder on the JNIOR. The Utility Usage Monitor files all end in .csv so the complete filter to enter into Snapshot is as follows: /www/logs/*.csv Below is a screen shot of the JNIOR Support Tool Snapshot feature. NOTE: The instantaneous data and the 6-minute data is stored in battery-backed memory in the JNIOR and is not written to a file on the JNIOR. To save this data, you must use the SAVE button on the Utility web page as previously described. JNIOR A Network I/O Resource Utility Usage Monitor Manual – Release 5.0 25 INTEG Process Group, Inc Clearing Your Current Data Data is stored in the JNIOR in both data buffers and data files. Should your data be corrupt or bad, you can clear the 24 hour buffers and current data by typing the follow command. This command can be typed using the Main JNIOR Web page and the Command Line tab or in a Telnet session or a HyperTerminal session. registry AppData/Utility/CleanBuffers = true NOTE: This command is case sensitive and must be type exactly as above. After you type this command, then type: reboot After the JNIOR reboots, the current data will be cleared. This command must be entered each time you want to clear your data buffers. JNIOR A Network I/O Resource Utility Usage Monitor Manual – Release 5.0 26 INTEG Process Group, Inc Summary Thank you for purchasing the JNIOR. Hopefully this manual made the getting-to-know process of your new JNIOR very quick and easy. The JNIOR has many more wonderful tools and features available, and are explained in detail in the supplied documents. Copyright Copyright 2012 INTEG Process Group, Inc. All rights reserved. Notice Every effort was made to make this manual as accurate and useful as practical at the time of the writing of this manual. However, all information is subject to change. Trademarks Trademarks are the property of their respective holders. Sun, Sun Microsystems, the Sun logo and Java are trademarks or registered trademarks of Sun Microsystems, Inc. in the United States and other countries. Microsoft, Windows, MS-DOS and Internet Explorer are registered trademarks of Microsoft Corporation. HyperTerminal is a registered trademark of Hilgraeve, Inc. Use Restrictions This User’s Manual and the software contained in the JNIOR are copyrighted by INTEG Process group and may not be copied or reproduced without prior consent from INTEG Process Group, Inc. INTEG Process Group is not responsible for any errors or omissions that may be contained in this manual. Please do not hesitate to contact our JNIOR team at INTEG Process Group, Inc. We can be reached via phone, fax or e-mail as follows: INTEG Process Group, Inc. 2919 East Hardies Road, First Floor Gibsonia, PA 15044 www.integpg.com [email protected] PH (724) 933-9350 FAX (724) 443-3553 JNIOR A Network I/O Resource Utility Usage Monitor Manual – Release 5.0 27