1
Meta Imaging Series®
MetaFluor
Version 7.0 for
®
Microsoft Windows XP
User’s Guide
1030 2101-03
MetaFluor User’s Guide
MetaFluor
2
Version 7.0
MetaFluor User’s Guide
Copyrights, Notices, and Trademarks
© 2004 – 2006 Molecular Devices Corporation. All rights reserved. Printed in the
U.S.A.
Information in this document is subject to change without notice and does not
represent a commitment on the part of Molecular Devices Corporation. The
software described in this document, including information contained in any
databases, is furnished under a license agreement and may be used or copied
only in accordance with the terms of the agreement. It is illegal to copy the
software, except as specifically allowed in the license agreement. No part of this
manual may be reproduced or transmitted in any form or by any means,
electronic or mechanical, including photocopying and recording, for any purpose,
without the express written permission of Molecular Devices Corporation.
MetaMorph and ImageXpress are registered trademarks and Discovery-1,
MetaXpress, MDCStore and ImageXpress Micro are trademarks of Molecular
Devices Corporation.
All other trademarks are the property of their respective owners
Disclaimer
Molecular Devices Corporation reserves the right to change its products and
services at any time to incorporate technological developments. This user guide
is subject to change without notice.
Although this user guide has been prepared with every precaution to ensure
accuracy, Molecular Devices Corporation assumes no liability for any errors or
omissions, nor for any damages resulting from the application or use of this
information.
MetaFluor
3
Version 7.0
MetaFluor User’s Guide
MetaFluor
4
Version 7.0
MetaFluor User’s Guide
Table of Contents
Navigating Through the MetaFluor Online Help
16
MetaFluor Online Help Structure
17
18
Journal Functions
List of Commands By Menu
File Menu
27
New Experiment (File Menu)
Starting a New Experiment
Open Experiment (File Menu)
Opening an Experiment
Open Experiment - Dialog Box Options
Close Experiment (File Menu)
Closing an Experiment
Get Info (File Menu)
Getting Information About an Experiment
Get Info - Dialog Box Options
Open Measurements File (File Menu)
Opening a Measurements File
Open Measurements Log File - Dialog Box Options
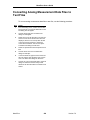
Creating a DDE Link to Excel
Creating a DDE Link to Lotus 1-2-3, Borland Quattro Pro, or MicroCal Origin
Linking to Another Application
Measurements - Dialog Box Options
View Measurements (File Menu)
Viewing Measurements
Select Measurement Log File - Dialog Box Options
Close Measurements File (File Menu)
Closing a Measurements File
Open Save Images File (File Menu)
Saving Wavelength Image Files
Save Images File (INF File) - Dialog Box Options
Close Save Images File (File Menu)
Terminating Wavelength Image Saving
Open Save Ratios File (File Menu)
Saving Ratio Image Files
Open Save Ratios - Dialog Box Options
Close Save Ratios File (File Menu)
Terminating Ratio Image Saving
Load Protocol File (File Menu)
Loading a Protocol File
Load Protocol - Dialog Box Options
Save Protocol File (File Menu)
Saving a Protocol File
Saving a Protocol File and Closing an Experiment
Save Protocol - Dialog Box Options
Archive Experiment (File Menu)
Archiving an Experiment
Archive Experiment - Dialog Box Options
28
29
30
31
32
33
34
35
36
37
39
40
41
42
43
44
45
46
47
48
49
50
51
53
54
55
56
57
58
59
60
61
62
63
64
66
67
68
69
71
72
73
MetaFluor
5
Version 7.0
MetaFluor User’s Guide
Extract Archived Files (File Menu)
Extracting Archived Files
Extract Archived Files - Dialog Box Options
Print Image (File Menu)
Printing an Image
Selecting Printing Options
Print - Dialog Box Options
Print Options - Dialog Box Options
Select Video/Camera for Acquisition (File Menu)
Preferences (File Menu)
Selecting Preferences
General Preferences - Dialog Box Options
Digital Camera Preferences - Dialog Box Options
Video Camera Preferences - Dialog Box Options
Scale Bar Preferences - Dialog Box Options
Calibration Preferences - Dialog Box Options
Playback Preferences - Dialog Box Options
Data Logging Preferences - Dialog Box Options
Dual View Preferences - Dialog Box Options
Initialize to Defaults (File Menu)
Initializing MetaFluor Settings to Their Default State
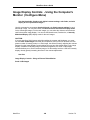
Configure Paths (File Menu)
Configuring Paths
Configure Paths - Dialog Box Options
Exit (File Menu)
Exiting MetaFluor
74
75
76
77
78
79
81
82
84
85
86
87
89
90
91
92
93
94
95
96
97
98
99
100
101
102
Configure Menu
103
Configure Acquisition (Configure Menu)
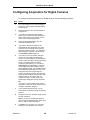
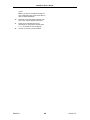
Configuring Acquisition for Digital Cameras
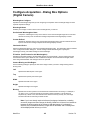
Configure Acquisition - Dialog Box Options (Digital Camera)
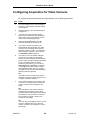
Configuring Acquisition for Video Cameras
Configure Acquisition - Dialog Box Options (Video Camera)
Selecting a Region for Acquisition
Select Region - Dialog Box Options
Configure Experiment (Configure Menu)
Configuring Acquisition, Display, Saving, and Data Logging for an Experiment
Configure Experiment - Dialog Box Options
Configure Ratios/FRET
Determining FRET Coefficients
Determining FRET Coefficients for Fully Specified Bleed Through Correction
104
105
107
109
111
113
114
115
117
119
121
122
122
MetaFluor
6
Version 7.0
MetaFluor User’s Guide
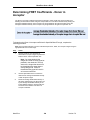
Determining FRET Coefficients - Sensitized Emission
Determining FRET Coefficients - Fully Specified Bleed Though
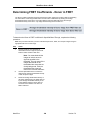
Determining FRET Coefficients - Donor in Acceptor
Determining FRET Coefficients - Acceptor in Donor
Determining FRET Coefficients - Donor in FRET
Determining FRET Coefficients - Acceptor in FRET
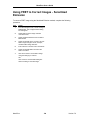
Using FRET to Correct Images - Sensitized Emission
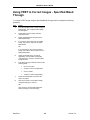
Using FRET to Correct Images - Specified Bleed Through
Configuring Ratios
Configure Ratios/FRET - Dialog Box Options
Z Position Control (Configure Menu)
Controlling Z Position
Z Position Control - Dialog box options
Z-Axis Calibration
Calibrating the Z-Axis
Z-Axis Calibration - Dialog Box Options
Configure Dual View
Configuring Dual View
Configure Dual View - Dialog Box Options
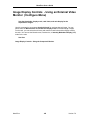
Image Display Controls - Using the Computer's Monitor (Configure Menu)
Image Display Controls - Using an External Video Monitor (Configure Menu)
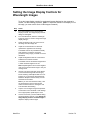
Setting the Image Display Controls for Wavelength Images
Setting the Image Display Controls for an External Video Monitor
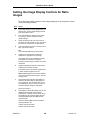
Setting the Image Display Controls for Ratio Images
Measure Spectra (Configure Menu)
Measuring Spectra
Measure Spectra - Dialog Box Options
Configure Illumination (Configure Menu)
Creating Illumination Settings
Deleting Illumination Settings
Configure Illumination - Dialog Box Options
123
125
126
127
128
129
130
131
132
133
135
136
137
138
139
140
141
142
143
144
145
146
147
149
151
152
154
156
157
158
159
Run Experiment Menu
161
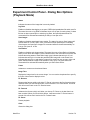
Experiment Control Panel - Digital Camera (Run Experiment Menu)
Focusing the Digital Camera Using a Computer Image Window
Focusing the Digital Camera Using an External Video Monitor
Preparing for Image Acquisition
Running the Experiment
Experiment Control Panel - Dialog Box Options (Digital Camera)
Focus - Dialog Box Options (Digital Camera with Computer Monitor)
Focus Digital Camera - Dialog Box Options (Digital Camera with External Monitor)
Experiment Control Panel - Playback Mode (Run Experiment Menu)
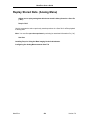
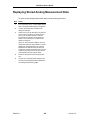
Playing Back a Stored Experiment
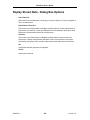
Experiment Control Panel - Dialog Box Options (Playback Mode)
Stop Acquisition (Run Experiment Menu)
Stopping Image Acquisition
One Acquisition (Run Experiment Menu)
Acquiring One Acquisition
Zero Clock (Run Experiment Menu)
Zeroing the Clock
Set Timelapse
Save Last Acquired Images (Run Experiment Menu)
Saving the Last Acquired Images
Log Now (F9) (Run Experiment Menu)
Using Log Now
162
164
167
168
169
170
172
176
177
178
179
180
181
182
183
184
185
186
187
188
189
190
MetaFluor
7
Version 7.0
MetaFluor User’s Guide
Scale 16-Bit Images (Run Experiment Menu)
191
193
Scaling 16-Bit Images
194
Scale 16-Bit Images - Dialog Box Options
196
Selecting a Video Device
197
Selecting a Video Device
198
Select Video/Camera for Acquisition - Dialog Box Options
199
Video Cameras
Experiment Control Panel (Run Experiment Menu) - Video Camera and External Monitor
200
202
Adjusting the Image Using a Video Camera with an External Video Monitor
Experiment Control Panel (Run Experiment Menu)
204
Video Camera with Computer's Monitor
Experiment Control Panel - Dialog Box Options
206
(Video Camera with Computer's Monitor)
208
Focusing the Video Camera Using the Computer Monitor
Focus - Dialog Box Options (Computer Monitor
211
Display of Focus Image from Video Camera with No External Monitor)
Experiment Control Panel - Dialog Box Options (Video Camera with External Monitor)214
216
Analog Contrast - Dialog Box Options
217
Focusing the Video Camera Using an External Video Monitor
219
Focus Video Using External Monitor - Dialog Box Options
Focus - Dialog Box Options (Computer Monitor
220
Display of Focus Image from Video Camera with External Monitor Present)
221
Image Display Controls - Dialog Box Options (Using an External Video Monitor)
222
Image Display Controls - Dialog Box Options (Using the Computer's Monitor)
224
Reference Images
225
Reference Images - External Monitor Display (Run Experiment Menu)
226
Saving Reference Images (External Monitor Display)
227
Loading Reference Images (External Monitor Display)
228
Reference Images - Dialog Box Options (External Monitor Display)
229
Reference Images - Computer Window Display (Run Experiment Menu)
231
Configuring Background and Shading Correction (Computer Window Display)
233
Acquiring and Saving New Reference Images (Computer Window Display)
235
Loading Previously Stored Reference Images (Computer Window Display)
236
Reference Images - Dialog Box Options (Computer Window Display)
239
Select Save Region (Run Experiment Menu)
240
Selecting a Save Region
242
Select Source Image for Defining Regions - Dialog Box Options
243
Define Save Region - Dialog Box Options
244
Event Marks (Run Experiment Menu)
245
Logging One Event
247
Creating a Stored Events List
249
Using the Stored Events List
250
Event Marks - Dialog Box Options
252
Event Mark Hotkeys (Run Experiment Menu)
253
Using Event Mark Hotkeys
254
Show Event List (Run Experiment Menu)
255
Showing the Event List
256
Event List - Dialog Box Options
257
Stream Setup (Run Experiment Menu)
259
Configuring Stream Setup
261
Stream Setup - Dialog Box Options
263
Acquire Stream (Run Experiment Menu)
264
Using Stream Acquisition
265
Move All Regions (Run Experiment Menu)
266
Moving All Regions
MetaFluor
8
Version 7.0
MetaFluor User’s Guide
Move All Regions - Dialog Box Options
Align Wavelengths (Run Experiment Menu)
Aligning Wavelengths
Align Wavelengths - Dialog Box Options
Edit Conditions (Run Experiment Menu)
Editing Experimental Conditions
Edit Conditions - Dialog Box Options
Conditions (Run Experiment Menu)
Tagging Data with an Experimental "Conditions" State
Conditions - Dialog Box Options
267
268
269
270
271
272
273
274
275
276
Graphs Menu
277
Define Regions for Measurement (Graphs Menu)
Defining Regions for Measurement
Printing an Image While Defining Regions
Select Source Image for Defining Region - Dialog Box Options
Edit Regions - Dialog Box Options
Configure Graphs (Graphs Menu)
Configuring Region Data Measurements Graphs
Configure Graphs - Dialog Box Options
Clear Graphs (Graphs Menu)
Clearing MetaFluor Graphs
Clear Measurement Regions and Graphs (Graphs Menu)
Clearing Measurement Regions and Graphs
278
280
282
283
284
286
287
289
291
292
293
294
Utilities Menu
295
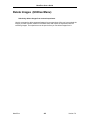
Play Movie from Disk (Utilities Menu)
Creating a Movie from a Set of Images
Build INF File (Utilities Menu)
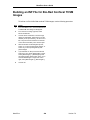
Building an INF File for MetaFluor, MetaGFP, or Image-1/FL Images
Building an INF File for Sequentially Named Images
Building an INF File for Image Stacks
Building an INF File for RGB TIFF Images
Building an INF File for Bio-Rad Confocal TCSM Images
Build INF File - Dialog Box Options
Delete Images (Utilities Menu)
Deleting Images from a Stored Experiment
Delete Images - Dialog Box Options
Import N-Dimensional Imaging Sequence
Importing an N-Dimensional Imaging Sequence
Save as 8-Bit Image (Utilities Menu)
Saving as an 8-Bit Image
Save as 8-Bit Image - Dialog Box Options
Spot Measurements (Utilities Menu)
Making Spot Measurements
Spot Measurements - Dialog Box Options
Configure Intensifier Gain Control (Utilities Menu)
Configuring the Intensifier Gain Control
Configure Intensifier Gain Control - Dialog Box Options
Set Intensifier Gain (Utilities Menu)
Setting the Intensifier Gain
Set Intensifier Gain - Dialog Box Options
Set Camera Level and Gain (Utilities Menu)
Setting the Camera Level and Gain
296
298
299
300
301
302
303
304
305
307
308
309
310
311
312
313
314
315
316
317
318
319
320
321
322
323
325
326
MetaFluor
9
Version 7.0
MetaFluor User’s Guide
Set Camera Level and Gain - Dialog Box Options
PI Video ICCD Settings (Utilities Menu)
Specifying the PI Video ICCD Settings
PI Video ICCD Settings - Dialog Box Options
Convert PI MultiViewer Images (Utilities Menu)
Converting PI MultiViewer Images
Convert PI MultiViewer Experiment - Dialog Box Options
Convert MultiViewer Experiment - Dialog Box Options
Define Split in Image - Dialog Box Options
Align Top and Bottom/Align Left and Right - Dialog Box Options
Twain Configure (Utilities Menu)
Configuring Use of a TWAIN-Compliant Device
Twain Configure - Dialog Box Options
327
328
329
330
331
332
335
336
337
338
339
340
341
Calibration Menu
342
Acquire Calibration Standards (Calibration Menu)
Acquiring Calibration Standards
Acquire Calibration Standards - Dialog Box Options
Equation Calibration in situ (Calibration Menu)
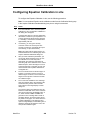
Configuring Equation Calibration in situ
Equation Calibration in situ - Dialog Box Options
Equation Calibration in vitro (Calibration Menu)
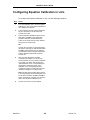
Configuring Equation Calibration in vitro
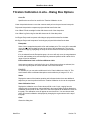
Equation Calibration in vitro - Dialog Box Options
Titration Calibration in situ (Calibration Menu)
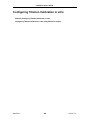
Configuring Titration Calibration in situ
Titration Calibration in situ - Dialog Box Options
Titration Calibration in vitro (Calibration Menu)
Configuring Titration Calibration in vitro
Manually Configuring Titration Calibration in vitro
Configuring Titration Calibration in vitro Using Reference Images
Titration Calibration in Vitro - Dialog Box Options
Quench Calibration (Calibration Menu)
Configuring the Quench Calibration
Quench Calibration - Dialog Box Options
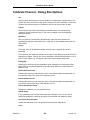
Calibration Map (Calibration Menu)
Generating a Calibration Map
Calibration Map - Dialog Box Options
Save Calibration Maps (Calibration Menu)
Saving Calibration Maps
Save Calibration Maps - Dialog Box Options
Save Calibration Table (Calibration Menu)
Saving Calibration Tables
Save Calibration Table - Dialog Box Options
Import Image-1/FL CAL File (Calibration Menu)
Importing an Image-1/FL CAL File
Import Image-1/FL CAL File - Dialog Box Options
343
344
346
348
349
351
352
353
354
356
357
358
359
360
361
362
363
365
366
367
368
369
370
371
372
373
374
375
376
377
378
379
Journals Menu
380
Create Journal (Journals Menu)
Creating a Journal
Create Journal - Dialog Box Options
Edit Journal (Journals Menu)
Editing a Journal
381
382
384
387
388
MetaFluor
10
Version 7.0
MetaFluor User’s Guide
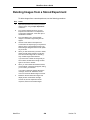
Adding a Journal Entry
Cutting, Copying, and Pasting Journal Entries
Editing Entries in a Journal
Edit Journal - Dialog Box Options
Run Journal (Journals Menu)
Running a Journal
Select a Journal to Run - Dialog Box Options
Auto-Execute Journals (Journals Menu)
Autoexecuting Journals
Auto-Execute Journals - Dialog Box Options
Use Auto-Execute Journals (Journals Menu)
Using the Auto-Execute Journals Command
Sequence Journals (Journals Menu)
Sequencing Journals
Sequence Journals - Dialog Box Options
Add Sequence Journals - Dialog Box Options
Use Sequence Journals (Journals Menu)
Using Sequence Journals
Run Sequence (Journals Menu)
Running a Journal Sequence
Trigger Journals (Journals Menu)
Configuring Trigger Journals
Trigger Journals - Dialog Box Options
Use Trigger Journals (Journals Menu)
Using Trigger Journals
Wait for Trigger (Journals Menu)
Waiting for a Trigger
Create Journal Toolbar (Journals Menu)
Creating a Journal Toolbar
Create Journal Toolbar - Dialog Box Options
Edit Journal Toolbar - Dialog Box Options
Edit Journal Toolbar (Journals Menu)
Editing Journal Toolbars
Edit Journal Toolbar - Dialog Box Options
Load Journal Toolbar (Journals Menu)
Loading a Journal Toolbar
Load Journal Toolbar- Dialog Box Options
Journal Toolbar Shortcuts (Journals Menu)
Using the Journal Toolbar Shortcuts
Show Journal Toolbar (Journals Menu)
Showing the Active Journal Toolbar
Hide Journal Toolbar (Journals Menu)
Hiding the Active Journal Toolbar
390
391
392
393
396
397
398
399
400
401
402
403
404
405
407
408
409
410
411
412
413
414
416
417
418
419
420
421
422
424
425
427
428
430
432
433
434
435
436
437
438
439
440
Windows Menu
441
Show or Hide Toolbar (Windows Menu)
Showing or Hiding the Icon Toolbar
Show or Hide Command Bar (Windows Menu)
Showing or Hiding the Command Bar
Show or Hide Graphs (Windows Menu)
Showing or Hiding Graphs
Open Sequence Status (Windows Menu)
Opening the Sequence Status Window
Sequence Status - Dialog Box Options
Close Sequence Status (Windows Menu)
442
443
444
445
446
447
448
449
450
451
MetaFluor
11
Version 7.0
MetaFluor User’s Guide
Closing the Sequence Status Window
Open Status Window (Windows Menu)
Opening the Status Window
Status - Dialog Box Options
Close Status Window (Windows Menu)
Closing the Status Window
Open Notebook (Windows Menu)
Opening the Notebook
Open Notebook - Dialog Box Options
Close Notebook (Windows Menu)
Closing the Notebook
Open Annotation (Windows Menu)
Opening the Annotation Window
Open Annotation - Dialog Box Options
Close Annotation (Windows Menu)
Closing the Annotation Window
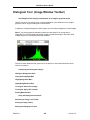
Arrange Windows (Windows Menu)
Arranging the Image Windows
Bring Images to Front (Windows Menu)
Bringing Images to Front
Bring Dialogs to Front (Windows Menu)
Bringing Dialogs to Front
Bring Graphs to Front (Windows Menu)
Bringing Graphs to Front
452
453
454
455
456
457
458
459
460
461
462
463
464
465
466
467
468
469
470
471
472
473
474
475
Analog Menu
476
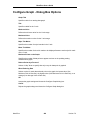
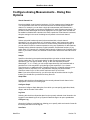
Introduction to the Analog Measurements Drop-in
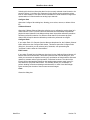
Configure Analog Measurements (Analog Menu)
Overview of the Use of the Configure Analog Measurements Command
Defining Virtual Analog Measurements Channels
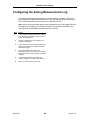
Configuring the Analog Data Graphs
Configure Graph - Dialog Box Options
Configuring the Analog Measurements Log
Configuring the Analog Measurements Save File
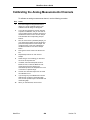
Calibrating the Analog Measurements Channels
Calibrate Channel - Dialog Box Options
Configure Analog Measurements - Dialog Box Options
Configure Log - Dialog Box Options
Configure Save - Dialog Box Options
Configure Ratio - Dialog Box Options
Edit Formula - Dialog Box Options
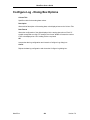
Analog Display (Analog Menu)
Configuring the Analog Display
Analog Display - Dialog Box Options
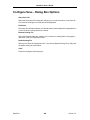
Analog Async Status (Analog Menu)
Controlling Analog Async Status
Analog Async Status - Dialog Box Options
Replay Stored Data (Analog Menu)
Replaying Stored Analog Measurement Data
Replay Stored Data - Dialog Box Options
Convert Data File to Text File (Analog Menu)
Converting Analog Measurement Data Files to Text Files
Convert Data File to Text File - Dialog Box Options
477
478
479
480
482
483
484
485
486
487
489
491
492
493
494
495
496
497
498
499
500
501
502
503
504
505
506
Help Menu
507
MetaFluor
12
Version 7.0
MetaFluor User’s Guide
Updates History (Help Menu)
Updates History - Dialog Box Options
Reading Your Updates History
Basic Tools
Dialog Boxes
Icon Toolbar
508
509
510
511
512
513
Using Image Window Tools
514
Image Window Toolbar
515
Zoom Tool (Image Window Toolbar)
Using the Zoom Tool
Histogram Tool (Image Window Toolbar)
Using the Histogram Tool
Display Mode Tool (Image Window Toolbar)
Selecting a Display Mode
Loading an Existing LUT
Configuring the Display Mode
Defining a User LUT
Contrast Tool and Slider (Image Window Toolbar)
Using the Contrast Tool
Using the Contrast Slider
Palette Tool (Image Window Toolbar)
Using the Palette Tool
Threshold Tool and Slider
Threshold Tool and Slider (Image Window Toolbar)
Using the Threshold Tool and Slider
516
517
518
520
521
522
523
524
525
527
528
529
530
531
532
533
534
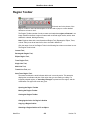
Using Region Tools
536
Region Toolbar
537
Region Tools
539
Locator Tool (Region Toolbar)
Selecting a Region as the Active Region
Deselecting the Active Region
Editing the Shape of a Region
Deleting a Region
Moving the Pointer Using Keystrokes
Moving a Closed Region
Moving a Line Region
Displaying a Region's X and Y Coordinates, Width, and Height
Resizing a Rectangular or Elliptical Region
Resizing or Reshaping a Line Region
Rectangular Region Tool (Region Toolbar)
Creating a Rectangular Region
Creating and Resizing a Rectangular Region
Deleting Any Region, Made by Any Tool
Using the Locator Tool Without Switching Tools
Ellipse Region Tool (Region Toolbar)
Creating an Elliptical Region
Creating and Resizing an Elliptical Region
Single Line Tool (Region Toolbar)
540
541
542
543
544
545
546
547
548
549
550
551
552
553
554
555
556
557
558
559
MetaFluor
13
Version 7.0
MetaFluor User’s Guide
Starting the Single Line
Ending the Single Line
Multi-Line Tool (Region Toolbar)
Starting a Multi-Line Region
Completing the First Segment of the Multi-Line
Adding Additional Segments
Ending the Last Line Segment
Traced Line Tool (Region Toolbar)
Starting a Hand-Traced Line
Adding a Point Using a Straight Line
Ending the Hand-Traced Line
Auto-Trace Region Tool (Region Toolbar)
Configuring the Auto-Trace Region Tool
Tracing an Object
Trace Region Tool (Region Toolbar)
Starting a Hand-Traced Region
Adding Points Using a Freehand Curve
Deleting the Last Added Point
Closing the Hand-Traced Region
Using the Region Toolbar
Opening the Region Toolbar
Moving the Region Toolbar
Closing the Region Toolbar
Changing the Color of a Region’s Outline
Copying a Region Outline
Shrinking a Region Outline to Fit an Object
Shrinking a Region Outline Using a Three-Button Mouse
Configuring the Default Behavior for Region Tools
Configuring the Default Color for Regions
Locking Region Positions
Locking Region Sizes
Setting the Default Region Size
560
561
562
563
564
565
566
567
568
569
570
571
572
574
575
576
577
578
579
580
581
582
583
584
585
586
587
588
589
590
591
592
Graphs
593
Using Shortcuts
595
Keyboard Shortcuts
596
Menu Shortcuts
597
Intensity Modulated Display (IMD) Mode
598
Exiting MetaFluor
Export Log Data - Dialog Box Options
605
Selecting the Drive
Selecting the File's Directory
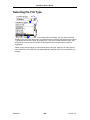
Selecting the File Type
Selecting the File
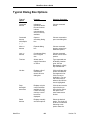
Typical Dialog Box Options
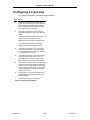
Configuring a Trace Line
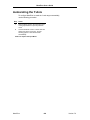
Autoscaling the Y-Axis
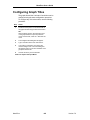
Configuring Graph Titles
Configuring the X-Axis or Y-Axis
607
608
609
610
611
613
614
615
616
MetaFluor
14
Version 7.0
MetaFluor User’s Guide
Configuring the Background
Printing a Standard Graph
Printing a Scrolling Graph
Copying a Graph to the Clipboard
Saving a Graph as a Bitmap
Configuring a Trace Line
Autoscrolling the Graph
Hiding the Histogram Labels
Using Show Highlight Bars
Highlighting Under Bars
Highlighting Between Bars
Turning On Area as a Percentage
Turning On Apply LUT to Graph
Scaling Between Bars
Stretching an Image's LUT
Scaling 16-Bit Images
Setting the Histogram's X-Axis
Resetting the Histogram's X-Axis
Invert
Using the Contrast Tool and the Contrast Slider
Using the Locator Tool
Adding a Point Using a Straight Line
Adding Points Using a Freehand Curve
Deleting the Last Added Point
Locator Tool
Rectangular Region Tool
Ellipse Region Tool
Trace Region Tool
Single Line Tool
Multi-Line Tool
Traced Line Tool
Auto-Trace Region Tool
Preparing for Image Acquisition
Running the Experiment
Histogram of Scaled 16-Bit Image
Scaling Example
MetaFluor
15
617
618
619
620
621
622
623
624
625
626
627
628
629
630
631
632
633
634
634
635
636
637
638
639
639
639
639
639
639
639
639
641
642
643
644
Version 7.0
MetaFluor User’s Guide
Navigating Through the MetaFluor Online Help
If you have used a Windows-based online Help system before, you will find the MetaFluor
Online Help familiar and easy to use. If you have never used online Help, you should take
a moment to read How to Use Windows Help. You can do this by positioning the pointer
over the highlighted (green) text "How to Use Windows Help" below.
How to Use Windows Help
Most commands listed in MetaFluor's Online Help have three Help pages--a summary
page, a procedure page, and a dialog box options page. Summary pages are displayed
in a main window. Procedure and dialog box options pages are displayed in Procedure
and Dialog Box Options windows, respectively. These are smaller, "secondary" windows.
Unlike the main Help window, these two types of secondary window will always stay on
top of any other application you are running. This is so that you can read step-by-step
procedures or descriptions of dialog box options while you work in MetaFluor.
If you have used a Windows-based online Help file before, you may notice several
additional buttons in the MetaFluor Online Help button bar at the top of main window: the
Procedure, and Dialog buttons.
The Procedure button displays the command's procedure page.
The Dialog button displays the command's dialog options page. Some commands do not
have dialog boxes: the Dialog button will be disabled for these commands.
Like the main Help window, the Procedure and Dialog Box Options windows have
Procedure and Dialog buttons. You can use these buttons to toggle between the
Procedure and Dialog Box Options pages for the current topic displayed within the
smaller window. To update the contents of the Procedure or Dialog Box Options window
with a new topic displayed in the main Help window, choose the Procedure or Dialog
button from the main Help window's toolbar (not the Procedure or Dialog button in the
smaller window).
The Procedure and Dialog Box Options windows also have a Print button which allows
you to print the current topic in the window. You can also drag the pointer over text that
you want to print, click the right mouse button, and choose Print from the shortcut menu
that appears.
The Main button in the Procedure and Dialog Box Option windows allows you to:
(1) Display the main window if you minimized or closed its window,
(2) Move the smaller window to the left of the main window, or
(3) Close the main window but leave the smaller window open.
There are several other buttons in the button bar of the main Help window which are very
useful for navigating in MetaFluor's online Help. The Browse buttons (<< and >>) allow
you to browse through topics that are on the same level in the online Help. The Help
Topics button takes you back to the MetaFluor Help Topics window.
MetaFluor
16
Version 7.0
MetaFluor User’s Guide
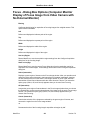
MetaFluor Online Help Structure
Help Topics Dialog Box - Contents Tab
Click the Contents tab at the top. You can select an online Help topic by clicking the book or
page icon displayed before the topic title. A book icon indicates that there is a group of related
topics together. Click the book icon to display these topics. Clicking a page icon will lead you
directly to its topic. For example, if you click the File menu icon, you will see a list of its
commands. Clicking the Open Experiment page icon will open the summary page for the
Open Experiment command.
New Experiment
Open Experiment
...
You can use the Browse buttons to jump between summary pages for commands on this
level. You can use the Procedure button to jump to "Opening an Experiment" or you can use
the Dialog button to jump to "Open Experiment - Dialog Box Options."
Opening an Experiment
Open Experiment - Dialog Box
Options
You can use the Procedure and Dialog buttons in the command toolbar of these windows to
jump between topics on this level. At this level, the button pertaining to your current page will
be disabled unless there are multiple Procedure or Dialog Box Options pages (for complex
commands with multiple dialog boxes).
MetaFluor
17
Version 7.0
MetaFluor User’s Guide
Journal Functions
-AAcquire Background
Acquires a background subtraction image.
Acquire Shading
Acquires a shading correction image.
Acquire Stream
Starts stream acquisition of wavelength images as rapidly as possible into computer memory.
Adjust Exposure Time
Adjusts the exposure time for the selected wavelength by increasing or decreasing the exposure time by a
selected amount.
Adjust Frames to Average
Adjusts the frame averaging for the selected wavelength by adding or subtracting from the number of frames
to average.
Adjust Frames to Integrate
Adjusts the frame integration for the selected wavelength by adding or subtracting from the number of
frames to integrate.
Analog Display
Opens or closes analog measurements graphs for a specified analog channel.
Analog Settle Time
Sets how long to wait to acquire an image after changing the analog gain and black level.
Ask to Subtract Backgrounds
Sets whether or not to query the user if background reference images are to be used.
Async Analog Measurements
Starts or stops analog asynchronous measurements.
Auto Shutter
Toggles between an open and closed shutter state when showing live video.
-BBeep
Issues the computer's beep sound.
-CChannel Settle Time
Sets the analog video channel settle time, in milliseconds, for the specified video channel.
Clear Graph On Reset
Configures whether or not to erase the time-based graphs if the clock is reset during playback.
Clear Message
Clears the message (if any) displayed on the Status window's message line.
MetaFluor
18
Version 7.0
MetaFluor User’s Guide
Clear Regions
Clears all regions. Closes the Intensity and Ratio graphs if they are open.
Close DIO Driver
Closes the specified DIO (digital I/O) driver.
Close Measurements File
Closes the currently open measurements log file.
Close Save Images File
Closes the .inf file and the associated wavelength image files.
Close Save Ratios File
Clears the selected base name from use in saving a set of ratio images and closes the ratio image files.
Close Serial Driver
Closes the serial driver for the named device.
Configure Background
Configures a background subtraction mode (Image, average gray value in a selected Region, Constant gray
value, or None) for each selected wavelength image.
Configure Image Acquisition
Defines the acquisition settings for each wavelength. This includes the Illumination Device control as well as
the camera acquisition parameters. You must add a new journal entry for each wavelength whose
acquisition parameters you want to define.
Configure Intensifier Gain Control
Specifies the model of ICCD you are using, its serial port, its baud rate, and whether its control is manual or
by computer.
Configure Shading
Configures a shading correction mode (Image or None) for each selected wavelength image.
-D-
Delay
Adds a specified amount of time (in milliseconds) to wait before the next command is carried out.
Display Channel Graph
Shows or hides the analog measurements graph for a selected analog data channel.
Display Message
Displays a message on the message line of the Status window.
Display Windows
Opens a selected command's dialog box.
Draw Image Labels
Enables or disables the display of image labels on an external video monitor.
Draw Quadrant Marks
Enables or disables the display of quadrant marks on an external video monitor.
Draw Region Labels
Enables or disables the use of region labels and specifies their placement.
MetaFluor
19
Version 7.0
MetaFluor User’s Guide
Draw Save Region
Enables or disables the display of the Save Region outline on an external video monitor.
Draw Regions
Enables or disables the display of region of interest outlines on an external video monitor.
-EExecute Journal
Runs the specified journal.
-FFocus Method
Selects between computer image window and external monitor display for focusing images acquired with a
digital camera.
-GGraph Channel
Enables or disables graphing of a selected analog measurements data channel.
Graph Clear When Regions Change
Configures whether or not to clear the Intensity and Ratio graphs when regions are changed.
Graph Click Displays Image
Configures whether or not to display the image nearest to the time point in the graphs where the pointer is
clicked.
-LLoad Backgrounds
Loads a reference image for background subtraction.
Load Calibration Standards
Loads a calibration standards file.
Load Event List
Loads a set of event marks from disk.
Load Journal Sequence
Loads a journal sequence file.
Load Journal Toolbar
Loads the specified journal toolbar.
Load Regions
Loads in a set of regions of interest.
Load Shadings
Loads a reference image for shading correction.
Lock Shutter Open
Sets the Lock Shutter Open state.
Log Channel
Enables or disables logging of data from a selected analog measurements channel.
Log Now
MetaFluor
20
Version 7.0
MetaFluor User’s Guide
Logs the current set of data to an open measurements file.
-MMark an Event in List
Selects the number of an Event Mark List entry in preparation for marking the associated event.
Mark Current Event
Displays the currently selected event mark on the graphs and/or logs it in the open measurements (log) file.
Maximum Graph Points
Selects the maximum number of points to be displayed on time-based graphs.
Measure Channel
Switches asynchronous measurement on or off for a selected analog measurements channel.
Move to Next Event Mark
Moves the highlighter to the next event mark in the Event Mark List.
-OOne Acquisition Cycle
Performs one cycle of acquisition.
Open DIO Driver
Opens the specified DIO (digital I/O) driver.
Open Experiment Control Panel
Configures whether or not to open the Experiment Control Panel whenever an experiment is opened.
Open Notebook
Configures whether or not to open the Notebook window whenever an experiment is opened.
Open Protocol File
Configures whether or not to open the Load Protocol File dialog box whenever an experiment is opened.
Open Serial Driver
Opens the serial port for the specified device using the specified serial communications parameters.
Open Status
Configures whether or not to open the Status window whenever an experiment is opened.
-PPause Experiment
Pauses a running experiment. This command will not take effect until the journal completes.
Play Sound
Plays a selected sound (*.wav) file (requires a sound card).
-RReset Event Mark Timer
Zeroes the clock used by the Event Marks countdown timer.
Resize Image to Fit Scale Bar
Configures whether or not images will resize to accommodate a scale bar outside of the image area.
Resume Experiment
MetaFluor
21
Version 7.0
MetaFluor User’s Guide
Resumes running an experiment. This command will not take effect until the journal completes.
Run Journal Sequence
Initiates a journal sequence.
Run Program
Runs an external program from within MetaFluor. You can run the external application in a window that is
Normal, Minimized, or Maximized.
-SSave Backgrounds
Saves the selected background subtraction image to disk.
Save Channel
Switches binary saving on or off for a selected analog measurements channel.
Save Current Images
Saves the current images.
Save Event List
Saves a set of event marks to disk.
Save Journal Sequence
Saves the journal sequence to a file.
Save Ratio Now
Saves the current ratio image.
Save Settings
Saves the current MetaFluor configuration settings.
Save Shadings
Saves the selected shading correction image to disk.
Scale Bar Continuous
Configures whether to make the scale bar continuous or discrete.
Scale Bar Drawing
Configures whether or not to draw scale bars, and if so on what images to draw them.
Scale Bar Location
Sets the location for the scale bar.
Scale Bar Stamp
Configures whether or not to stamp the scale bar on images.
Send DIO Data
Sends DIO (digital I/O) data using the selected DIO driver.
Send Serial Data
Sends the specified serial command string to the named device. The Data to Send is based on the device's
documentation.
Set Analog Settle Time
Sets the analog settle time, in milliseconds.
Set Analog Values
MetaFluor
22
Version 7.0
MetaFluor User’s Guide
Sets the analog black level and white level for the selected video channel.
Set Bit Depth
Sets the digital camera bit-depth to use when acquiring a specific wavelength.
Set Camera Black Level
Sets a video camera's black level.
Set Camera Shutter
Sets the shutter's state for a selected wavelength image.
Set Camera Video Gain
Sets a video camera's gain.
Set Correct Shading
Enables or disables shading correction.
Set Condition
Defines up to five experimental conditions which can be used to "tag" the experimental data at appropriate
times.
Set Display Mode
Sets the display mode for a wavelength, ratio, or quadrant display on an external video monitor.
Set Exposure Time
Sets the exposure time for digital cameras to the specified number of milliseconds, seconds, or minutes.
Set Frames to Average
Sets the frame averaging time for the Matrox Image-LC board to the specified number of frames. Use the
value "1" for no frame averaging.
Set Gain
Sets the digital camera gain for acquisition of a selected wavelength image.
Set Image Update
Enables or disables image updating for the selected image.
Set Image Update Interval
Sets the image updating interval for the selected image.
Set Integration Time
Sets the number of frames to average for images of a specified wavelength.
Set Intensifier Gain
Sets the gain of the ICCD's intensifier.
Set Intensity
Directly changes the Intensity setting of the desired Illumination MetaDevice.
Set Log Data
Enables or disables data logging to the open measurements (log) file.
Set Number of Acquisitions
Sets the acquisitions acquired to the specified number.
Set Ratio Display
Configures the display mode and ratio range for a selected ratio image.
MetaFluor
23
Version 7.0
MetaFluor User’s Guide
Set Ratio Name
Specifies a name for a selected ratio image.
Set Save Calibration Map
Configures whether or not to save Calibration Maps.
Set Save Calibration Map Sequence
Sets the sequence name for saving Calibration Maps.
Set Save Images
Enables or disables wavelength image saving.
Set Save Interval
Specifies a saving interval for a selected wavelength or ratio image.
Set Save Ratios
Enables or disables ratio image saving.
Set Shading
Enables or disables shading correction.
Set Shutter
Directly changes the Shutter state of the desired Illumination MetaDevice.
Set Speed
Sets the digital camera transfer speed for acquisition of a selected wavelength image.
Set Subtract Backgrounds
Enables or disables background subtraction.
Set Thresholds
Sets the high and low threshold limits for images of a selected wavelength image.
Set Timelapse
Sets the timelapse interval to the specified number of milliseconds, seconds, minutes, or hours.
Set Wave 1 Intensifier Gain
Sets the gain of the ICCD intensifier for the Wavelength 1 image.
Set Wave 2 Intensifier Gain
Sets the gain of the ICCD intensifier for the Wavelength 2 image.
Set Wave 3 Intensifier Gain
Sets the gain of the ICCD intensifier for the Wavelength 3 image.
Set Wavelength
Directly changes the Wavelength setting of the desired Illumination MetaDevice.
Set Wavelength Acquisition
Enables or disables acquisition for a selected wavelength image.
Set Wavelength Acquisition Interval
Sets the acquisition interval for a selected wavelength image.
Set Wavelength Display
Configures the display mode, brightness and contrast, threshold levels, and 16-bit scaling for a selected
wavelength image.
MetaFluor
24
Version 7.0
MetaFluor User’s Guide
Set Wavelength Name
Specifies a name for the display window of a selected wavelength image.
Show Dialog on Event
Configures whether or not to display the associated dialog when an event mark occurs during playback.
Show Event List on Playback
Configures whether or not to open the Event List whenever an experiment is opened.
Show Live
Stops running an experiment and shows live video. This command will not take effect until the journal has
finished.
Show Message and Wait
Displays the selected message in a dialog box and waits for the specified number of seconds for the user to
choose OK or Cancel.
Show or Hide Image Window
Configures whether or not to display a selected wavelength or ratio image.
Stop Playing Sounds
Terminates the sound (*.wav) file currently being played.
Subtract Backgrounds From Loaded Calibration Image
Sets whether or not to subtract a background image when calibration reference images are loaded.
Summarize Regions
Configures whether or not to average all regions of the same color during measurement procedures.
-TTransfer Regions
Transfers regions from the active image to another specified image.
Twain Configure
Selects a TWAIN-compliant device for image acquisition and specifies whether to use the device's user
interface.
-UUse Auto-Execute Journals
Sets whether or not to use Auto-Execute Journals.
Use Channel
Enables or disables use of a selected analog measurements channel.
Use Frame Averaging
Sets whether or not to use frame averaging when showing live video.
Use Graph Markers
Configures whether or not to use graph markers.
Use Same Analog Settings for All Wavelengths
Sets whether or not to use the same analog contrast settings for all wavelength images.
Use Sequence Journals
Sets whether or not to use Sequence Journals.
MetaFluor
25
Version 7.0
MetaFluor User’s Guide
Use Trigger Journals
Sets whether or not to use Trigger Journals.
-WWait for DIO Data
Waits for DIO (digital I/O) data to be received from a specified DIO driver.
Wait for Serial Data
Waits for serial data to be received from a specified serial driver.
Wait for Trigger
Waits for one of the Trigger Journals conditions to be met.
Write to Log File
Logs text you enter in the Text to Log text box to an open measurements file.
-ZZero Clock
Resets the clock to zero.
Zero Cycle Count
Resets the cycle counter to zero.
Zero Sequence Clock
Resets the sequence clock to zero.
Zero Sequence Counter
Resets the sequence counter to zero.
Zero Timelapse Countdown
Resets the timelapse counter to zero.
© 1992 – 2005 Molecular Devices Corporation. All rights reserved.
MetaFluor
26
Version 7.0
MetaFluor User’s Guide
File Menu
MetaFluor
27
Version 7.0
MetaFluor User’s Guide
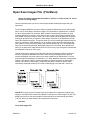
New Experiment (File Menu)
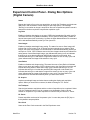
Prepares MetaFluor for a new experiment by opening an image window for each
selected wavelength and/or ratio that you have defined for your experiment and
opening the Experiment Control Panel.
Use this command when you want to begin acquiring new data. When you start MetaFluor,
most of its commands will be unavailable and will appear dimmed until you choose New
Experiment or Open Experiment. The appropriate commands and image display will appear
after you choose New Experiment. If you want to play back a saved experiment, use the Open
Experiment command instead of the New Experiment command.
Note: This command is unavailable in the MetaFluor Offline system.
For most camera and board configurations, your computer monitor will display acquired
images from a new experiment in image windows named Wavelength 1, Wavelength 2, Ratio
1, Wavelength 3, etc. These image windows will open automatically when you choose the
New Experiment command.
If you want, you can configure MetaFluor to prompt you for an appropriate protocol file by
selecting Prompt to Select a Protocol File in the General Preferences dialog box (Preferences
command, File menu).
Depending on the preferences you set using the Preferences command, the Notebook and
the Status window may also appear when you start a new experiment.
See Also:
Open Experiment
Close Experiment
Open Status Window
Open Notebook
Load Protocol File
Preferences
MetaFluor
28
Version 7.0
MetaFluor User’s Guide
Starting a New Experiment
To start a new experiment, use the following procedure:
Step
Action
1
From the File menu, choose New Experiment.
2
Wait while MetaFluor starts the new
experiment, loads a protocol file, and opens
the Status window and the Notebook (if so
configured). If a journal toolbar was open
when the protocol file was last saved, it will be
opened, too.
3
Image windows will appear on your computer
monitor.
MetaFluor
29
Version 7.0
MetaFluor User’s Guide
Open Experiment (File Menu)
Opens a previously acquired experiment that was stored on the hard disk so that
you can play back and examine its images.
Use this command when you want to play back and examine images from an experiment that
has been stored on the hard drive. When you start MetaFluor, most of its commands will be
unavailable and will appear dimmed until you choose Open Experiment or New Experiment.
The appropriate commands and image display will appear after you choose Open Experiment.
If you want to start a new experiment, you should use the New Experiment command, rather
than the Open Experiment command.
An experiment can be played back only if the images acquired during the experiment were
saved to disk. MetaFluor does not have a "Save Experiment" command. Rather, it allows you
to specify base file names for saving sets of wavelength and/or ratio images, and direct
MetaFluor to save images during the experiment by selecting or clearing the appropriate
check box in the Experiment Control Panel.
When you open an experiment, MetaFluor will build the ratio images using the saved
wavelength image pairs. This allows you to conserve disk space because you will not be
required to save the ratio images. (You can, however, save ratio images either during the
acquisition or during playback. You may wish to do so to build a movie from them or to load
them into MetaFluor.)
Your computer will load the saved images into image windows named Wavelength 1,
Wavelength 2, Ratio 1, Wavelength 3, etc.
When you want to open an experiment that uses settings different from those used in your last
session, you may first need to load the pertinent protocol file that was active during
acquisition. Otherwise, some options may be different or missing during playback. You can
configure MetaFluor to prompt you for the appropriate protocol file by selecting Prompt to
Select a Protocol File in the General Preferences dialog box (Preferences command, File
menu).
See Also:
New Experiment
Close Experiment
Load Protocol File
Preferences
MetaFluor
30
Version 7.0
MetaFluor User’s Guide
Opening an Experiment
To open an experiment, use the following procedure. (If necessary, you should load the
appropriate protocol file.)
Step
Action
1
From the File menu, choose Open
Experiment. The Select Image File (INF File)
dialog box will appear.
2
Select the desired .inf file. If necessary, use
the Look In list or the Up One Level button to
select the appropriate drive and folder.
3
Choose Open.
4
MetaFluor will open the experiment's images
and build ratio images from each pair of
images.
MetaFluor
31
Version 7.0
MetaFluor User’s Guide
Open Experiment - Dialog Box Options
File Name
Lists the name of the currently selected file.
Files of Type
Determines the file format of the files displayed in the File Name list. Select All Files (*.*)
to display all file names.
Look In
Displays the currently selected folder. Click the icon for the desired folder to display its
files. Click the Up One Level button to go up one level in the directory structure.
Open
Opens the experiment.
Cancel
Cancels the command.
MetaFluor
32
Version 7.0
MetaFluor User’s Guide
Close Experiment (File Menu)
Closes the current experiment.
Use this command when you want to close the current experiment. You must close the current
experiment to start a new experiment or play back another one. If any files are open, they will
be closed when the experiment is closed.
See Also:
New Experiment
Open Experiment
MetaFluor
33
Version 7.0
MetaFluor User’s Guide
Closing an Experiment
To close an experiment, use the following procedure:
Step
Action
1
Select the File menu.
2
Choose Close Experiment.
3
A dialog box will appear, asking if you want to
save a custom protocol file while closing the
experiment. Choose:
Yes to close the experiment and save the
protocol file,
No to close the experiment without saving the
protocol file, or
Cancel to cancel the Close Experiment
command.
MetaFluor
34
Version 7.0
MetaFluor User’s Guide
Get Info (File Menu)
Displays configuration and acquisition information for the current experiment.
Use this command when you want to view information about the current experiment, such as
the timelapse interval, exposure time, camera gain, and illumination settings. An annotation
text box and a table which lists the current set of event marks are also available in this dialog
box. You can export the information to a text file, copy it to the Clipboard, or send it to a
printer. Choosing this command will display much of the same information as is displayed for
the Load Protocol File or Save Protocol File commands, with the exception that the
commands for choosing the file and directory will be absent.
Shortcut: ALT + I
See Also:
Load Protocol File
Save Protocol File
Event Marks
MetaFluor
35
Version 7.0
MetaFluor User’s Guide
Getting Information About an Experiment
To view information about an experiment, use the following procedure:
Step
Action
1
From the File menu, choose Get Info. The Get
Info dialog box will appear.
2
From the Wavelength drop-down list, select
the wavelength for which you want to see the
configuration, acquisition, and display settings.
3
The Protocol Annotation text box will show any
previously stored comments for the file that
you may have entered from the Save Protocol
dialog box's Description text box. You can
enter an annotation or edit the existing one.
4
If you want to print or export the information in
the Get Info dialog box, choose Export. The
Export dialog box will appear. Choose
Save Info to a Text File if you want to store the
information as a text file. The export Info to
File dialog box will appear. Type a name for
the file in the File Name text box, use the Save
In list or Up One Level button to select the
drive and folder if necessary, and choose
Save.
Copy Info to Clipboard if you want to copy the
information to the Clipboard for pasting into
another Windows-based program.
Print Info if you want to send the information to
a printer.
5
Repeat Steps 2 - 4, as necessary, for any
other wavelengths.
6
When you have finished, choose Close.
MetaFluor
36
Version 7.0
MetaFluor User’s Guide
Get Info - Dialog Box Options
Protocol Annotation
This editable text box displays any comments that were entered when the current
protocol file was last saved. When you type a new annotation or edit the existing one, you
can press CTRL + ENTER to skip to the next line in the annotation.
Timelapse Interval
Displays the time interval between image acquisitions. If images were not acquired in
timelapse fashion, this will read "0 sec."
Load INF
Displays the path for the folder from which the .inf file will be loaded.
Save INF
Displays the path for the folder where the .inf file will be saved.
Acquire Image
Specifies whether image acquisition has been enabled.
Update Image
Specifies whether updating of image display has been enabled.
Display Window
Specifies whether the image will be displayed.
Save Image
Specifies whether image saving has been enabled.
Exposure Time
Displays the exposure time for the selected wavelength image (digital acquisition).
Camera Gain
Displays the gain setting if your digital camera supports this feature.
Illum. Device
Displays the name of the installed Illumination MetaDevice used for the selected
wavelength image.
Wavelength
Displays the wavelength of illumination for the selected wavelength image.
Intensity
Displays the intensity of illumination for the selected wavelength image.
Use Shutter
Displays the shutter usage status (Yes or No) for the selected wavelength image.
Wavelength
MetaFluor
37
Version 7.0
MetaFluor User’s Guide
Selects the wavelength image for which the configuration, acquisition, and display
information is displayed. Most of these settings were specified in the Configure
Acquisition dialog box (Configure menu).
Event Marks
Displays the event marks in the current Events List.
Export
Opens the Export dialog box, from which you can save the information to a text file, copy
it to the Clipboard, or send it to a printer.
Close
Closes the dialog box.
MetaFluor
38
Version 7.0
MetaFluor User’s Guide
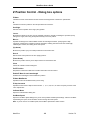
Open Measurements File (File Menu)
Opens the measurements (log) file for storing measurements made during an
experiment.
Use this command to open a measurements file before logging measurement data from an
experiment. Measurement data collected from either new or saved experiments can be logged
to a text file, logged directly to an open spreadsheet program by Dynamic Data Exchange
(DDE), or both. These files, also called log files, allow you to store measurement data on disk
so that you can view the data after you complete an experiment.
To log measurement data, MetaFluor must know where you want the data stored, that is,
which text file or spreadsheet application to use. This information is supplied by the Open
Measurements File command. What is logged is determined by the types of measurement
data you have selected using the Configure Experiment command. However, even if a log
file is open and configured, nothing will be logged until you select the Log Data check box in
the Experiment Control Panel (Run Experiment menu). This option allows you to log
measurement and event data selectively when you need it.
If you move or redefine regions with the Define Regions for Measurement command while
saving regional data to a measurements file, and want to log the new region information
automatically (new coordinates, size, and thresholded area), you can do so by selecting the
Log Header After Editing Regions check box in the Data Logging Preferences dialog box
(Preferences command, File menu). This will not be the case when regions are moved with
the Move All Regions command, however, because a large number of meaningless log entries
would be generated during the movement and resizing procedures.
See Also:
Preferences
Experiment Control Panel:
For Video Camera with External Monitor
For Video Camera with Computer's Monitor
For Digital Camera
Close Measurements File
Define Regions for Measurement
MetaFluor
39
Version 7.0
MetaFluor User’s Guide
Opening a Measurements File
To open a measurements file, use the following procedure:
Step
Action
1
Start a new experiment or open a stored
experiment from which you want to log
measurement data.
2
From the File menu, choose Open
Measurements File. The Measurements dialog
box will appear.
3
Select where you want the data to be logged:
To an open spreadsheet program by Dynamic
Data Exchange (DDE),
To A Text File, or
To both.
4
If you selected A Text File in the previous step,
the Open Measurement Log File dialog box
will appear.
If necessary, select the destination drive and
folder for the log file using the Save In list or
Up One Level button. Type the desired file
name in the File Name text box.
AND
Choose Save to close the dialog box.
5
If you chose an existing log file name in the
previous step, the Log File Exists dialog box
will appear. You can Overwrite the contents of
the file, Append new data to the file, or Cancel
the command.
Note: If you choose Cancel, you can specify a
different file name by repeating Steps 2 - 4.
6
If you selected Dynamic Data Exchange
(DDE) in Step 3, the Export Log Data dialog
box will appear.
7
Select the desired application from the
Application drop-down list. Choose Default to
use the default settings for that application.
AND
Choose OK.
Note: The spreadsheet application must be
open before you can create a DDE link to a
worksheet.
8
The status line for Log Data in the Experiment
Control Panel will now indicate that you have
opened a log file or activated a DDE link.
MetaFluor
40
Version 7.0
MetaFluor User’s Guide
Open Measurements Log File - Dialog Box
Options
File Name
Lists the name of the currently selected file.
Files of Type
Determines the file format of the files displayed in the File Name list. For opening log
files, the default is *.LOG.
Save In
Displays the currently selected folder. Click the icon for the desired folder to display its
files. Click the Up One Level button to go up one level in the directory structure.
Save
Opens the log file.
Cancel
Cancels the command.
MetaFluor
41
Version 7.0
MetaFluor User’s Guide
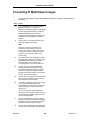
Creating a DDE Link to Excel
Using a New Microsoft Excel Worksheet
If you already have data in an open spreadsheet, you can request that MetaFluor link to a
new Microsoft Excel worksheet. After you have selected the appropriate program version
from the Application drop-down list in the Export Log Data dialog box, type <NEW> in the
Sheet Name text box (include the brackets surrounding the word "New"). This will open
the next new sheet--Book2[Sheet1] (or Sheet2 in Microsoft Excel 4.0).
Using a Microsoft Excel Worksheet Other Than the Default Worksheet
To use a previously saved worksheet, type its path and file name in the Sheet Name text
box of the Export Log Data dialog box. For example, type the following in the Sheet
Name text box:
C:\MSOFFICE\EXCEL\SHEETS\TEST.XLS
Then carefully select the Starting Row and Starting Column values for the new data so
that you do not use rows and columns that already contain data. After you have done
this, you can choose OK to close the Export Log Data dialog box.
If you selected the wrong file name for the sheet, the Connect to Application dialog box
will appear. Select the correct name from the list at the bottom of the dialog box. Or you
can create a new sheet by selecting <New>. Then choose Connect.
MetaFluor
42
Version 7.0
MetaFluor User’s Guide
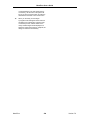
Creating a DDE Link to Lotus 1-2-3, Borland
Quattro Pro, or MicroCal Origin
Creating a DDE link to the default worksheet in Lotus 1-2-3 for Windows, MicroCal Origin,
or Borland Quattro Pro is similar to the procedure for Microsoft Excel, except that you will
need to select the appropriate spreadsheet application name from the Application dropdown list. In this case, the default Sheet Name is Untitled.
If you want to use a previously saved worksheet, you must both start the spreadsheet
program and open the worksheet prior to using the Open Measurements File command.
Type the path and file name of the worksheet in the Sheet Name text box in the Export
Log Data dialog box (for example, type: C:\123R4W\SHEETS\TEST.WK4). Then
carefully select the starting row and column for the new data so that you do not use rows
and columns that already contain data.
If you select the wrong name, the Connect to Application dialog box will appear. Select
the correct name from the list at the bottom of the dialog box and choose Connect. The
<New> option for creating a new sheet is not available for Lotus 1-2-3.
MetaFluor
43
Version 7.0
MetaFluor User’s Guide
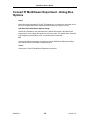
Linking to Another Application
You can use an application for DDE that is not listed in the Application drop-down list in
the Export Log dialog box.
To do so, select Other Application from the Application drop-down list in the Export Log
Data dialog box. You must supply the information for the Application Name, Topic Name,
Item Name, Starting Row, and Starting Column. You will need to contact the software
developer's technical support department or consult its user's manual to determine the
first three options. You will need to determine the numbers used for the Starting Row and
Starting Column.
Option
Description
Example
Application
Name
Defined by the application
receiving the data. Typically it
is a single word that refers to
the software.
EXCEL
Topic Name
Defined by the application
receiving the data. For
spreadsheets, it is the name of
the worksheet that will receive
the data.
Sheet1
[Book]Sheet1
Item Name
Defined by the application
receiving the data. Specifies
where the data are to be sent.
Application's
Format:
MetaFluor recognizes two
special symbols in this text
string: "<r>" which is replaced
by the current row
number/letter and "<c>" which
is replaced by the current
column number/letter.
MetaFluor
44
R1C1
RAC1
Enter in MetaFluor:
R<r>C<c>
Version 7.0
MetaFluor User’s Guide
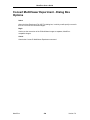
Measurements - Dialog Box Options
Log Measurements To
Specifies whether the measurements will be logged to an open spreadsheet program by
Dynamic Data Exchange (DDE), logged to A Text File, or both. Select both check boxes
if you want to log data to both an open spreadsheet program and a text file.
OK
Opens the Export Log Data dialog box so that you can select an open, DDE-linked
spreadsheet program. Opens the Open Measurement Log File dialog box so you can
specify a text file, depending on the choice(s) selected for Log Measurements To.
Cancel
Cancels the command.
MetaFluor
45
Version 7.0
MetaFluor User’s Guide
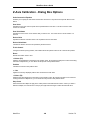
View Measurements (File Menu)
Displays the contents of a measurements file in table format within the Viewer
window.
Use this command to view the current log file or another log file in the Viewer window. You
can view more than one log file at a time: MetaFluor will open separate viewers for each file.
This command only displays the contents of text-based log files; you must use the
spreadsheet program to view data that were logged by a DDE link.
The viewer allows you only to view the data stored in the log file. You will not be able to edit or
add information to the log file using the viewer.
See Also:
Open Measurements File
Close Measurements File
MetaFluor
46
Version 7.0
MetaFluor User’s Guide
Viewing Measurements
To view a log file while in image acquisition or playback mode, use the following
procedure. (If you are not in image acquisition or playback modes, follow this procedure
using the option for Another Log File.
Step
Action
1
From the File menu, choose View
Measurements. A secondary menu will
appear.
2
From the secondary menu, choose:
Current Log File to view the log file that is
currently open, or
Another Log File to view a log file other than
the current log file. You must use this option if
a log file is not currently open.
3
If you chose Another Log File in the previous
step, the Select Measurement Log File dialog
box will appear.
Select the desired log file. If necessary, use
the Look In list or the Up One Level button to
select the appropriate drive and folder.
Choose Open. MetaFluor will display the
contents of the selected log file in the Viewer
window.
MetaFluor
47
Version 7.0
MetaFluor User’s Guide
Select Measurement Log File - Dialog Box Options
File Name
Lists the name of the currently selected file.
Files of Type
Determines the file format of the files displayed in the File Name list. For viewing log files,
the default is *.LOG. Select All Files (*.*) to display all file names.
Look In
Displays the currently selected folder. Click the icon for the desired folder to display its
files. Click the Up One Level button to go up one level in the directory structure.
Open
Opens the measurements log file.
Cancel
Cancels the command.
MetaFluor
48
Version 7.0
MetaFluor User’s Guide
Close Measurements File (File Menu)
Closes the active text-based measurements file and/or closes the DDE link to the
open spreadsheet program. This command also clears the Log Data check box in
the Experiment Control Panel if it has been selected.
Use this command to close the measurements file and/or the DDE link to the spreadsheet
program when you have finished logging measurements from an experiment. If the Log Data
check box has been selected in the Experiment Control Panel dialog box (Run Experiment
menu), it will be cleared automatically when the log file or DDE link is closed.
Note: This command only closes the DDE link to the open worksheet. You will still need to
switch to the spreadsheet program to save the worksheet and quit the program.
See Also:
Experiment Control Panel:
For Video Camera with External Monitor
For Video Camera with Computer's Monitor
For Digital Camera
Open Measurements File
MetaFluor
49
Version 7.0
MetaFluor User’s Guide
Closing a Measurements File
To close a measurements file, use the following procedure:
Step
Action
1
Select the File menu.
2
Choose Close Measurements File.
3
MetaFluor will clear the Log Data check box in
the Experiment Control Panel if it has been
selected. The status line next to Log Data will
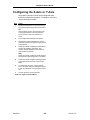
change from "DDE" and/or "Filename.log " to
"[File not open]." MetaFluor will close the DDE
link to the spreadsheet program if you are
logging by DDE.
Note: This command only closes the DDE link
to the open worksheet. You will still need to go
to the spreadsheet program to save the
worksheet and quit the program.
MetaFluor
50
Version 7.0
MetaFluor User’s Guide
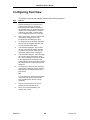
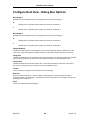
Open Save Images File (File Menu)
Opens an existing experimental information (*.inf) file, or creates a new one, for the
purpose of saving images.
Use this command when you want to save newly acquired wavelength images during an
experiment.
To save images, MetaFluor must know where you want the data stored, that is, which image
files to use or create when it stores the images. This information is supplied to the .inf file by
the Open Save Images File command. What is saved is determined by whether you have
instructed MetaFluor to save the entire image or only a region of the image using the Select
Save Region command. However, even if an .inf file is open and saving has been configured,
nothing will be saved until you select the Save Images check box in the Experiment Control
Panel (Run Experiment menu). This option allows you to save wavelength images selectively
when you need them. "LED" indicators next to the Save Images check box will indicate the
saving status of each Wavelength image: gray indicates that saving is off, red indicates that
saving is on but that the particular Wavelength image will not be saved, blue indicates that
saving is on and that the image will be saved, but not on every cycle, and green indicates that
the image will be saved on every cycle.
The file name that you specify in the Open Save Images File dialog box will be used in the
name for a special file that MetaFluor uses to save a list of the image pairs and their file
names, timestamps, and event marks for the series. MetaFluor will add the letter "d" to the
end of the name and assigns it the extension ".inf." When MetaFluor saves the corresponding
images, it will add the number 1 with a sequentially numbered extension for Wavelength 1
images. File names for Wavelength 2 images will end with the number 2 and the same
sequentially numbered extension, file names for Wavelength 3 will end with 3, and so on.
QUICK TIP: A quick way to invoke the Open Save Images File command is to select Save
Images in the Experiment Control Panel. MetaFluor will open the Save Images File (INF File)
dialog box so that you can select a base file name and open an experimental information
(*.inf) file. When you have finished, Save Images will be selected.
See Also:
Close Save Images File
MetaFluor
51
Version 7.0
MetaFluor User’s Guide
Experiment Control Panel:
For Video Camera with External Monitor
For Video Camera with Computer's Monitor
For Digital Camera
MetaFluor
52
Version 7.0
MetaFluor User’s Guide
Saving Wavelength Image Files
To open an information (*.inf) file for saving wavelength images, use the following
procedure:
Step
Action
1
Start a new experiment or open a stored
experiment from which you want to save
images. Load a protocol file if necessary.
2
From the File menu, choose Open Save
Images File. The Save Images File (INF File)
dialog box will appear.
3
Type a new base file name for the wavelength
images in the File Name text box, or select the
icon for the desired .inf file if you want to use
an existing file name. If necessary, use the
Save In list or the Up One Level button to
select the appropriate drive and folder. Then
select the file name.
AND
Choose Save to close the Save Images File
(INF File) dialog box.
4
If you chose an existing file name, the File
Exists dialog box will inform you that the file
already exists. MetaFluor will ask you how you
want to handle the previous contents of the
selected file. You can Overwrite the contents
of the file, Append new data to the file, or
Cancel the Open Save Images File command.
5
If you selected Overwrite in Step 4, another
message box will appear, asking you to verify
that you want to overwrite. Choose Yes if you
want to do so.
6
The status line for Save Images in the
Experiment Control Panel will now indicate the
name of the open .inf file.
MetaFluor
53
Version 7.0
MetaFluor User’s Guide
Save Images File (INF File) - Dialog Box Options
File Name
Lists the name of the currently selected .inf file, or specifies a new one, which will be
used as the base file name for the wavelength (intensity) images.
Files of Type
Determines the file format of the files displayed in the File Name list.
Save In
Displays the currently selected folder. Click the icon for the desired folder to display its
files. Click the Up One Level button to go up one level in the directory structure.
Save
Opens the experimental information (*.inf) file.
Cancel
Cancels the command.
MetaFluor
54
Version 7.0
MetaFluor User’s Guide
Close Save Images File (File Menu)
Closes the .inf file and the associated wavelength image files.
Use this command to close the Information (*.inf) file and associated wavelength image files
when you have finished saving images from an experiment. This command also clears the
Save Images check box in the Experiment Control Panel (Run Experiment menu) if it has
been selected.
See Also:
Experiment Control Panel:
For Video Camera with External Monitor
For Video Camera with Computer's Monitor
For Digital Camera
Open Save Images File
MetaFluor
55
Version 7.0
MetaFluor User’s Guide
Terminating Wavelength Image Saving
To close an .inf file after saving wavelength images, use the following procedure:
Step
Action
1
Select the File menu.
2
Choose Close Save Images File.
3
MetaFluor will clear the Save Images check
box in the Experiment Control Panel if it is still
selected. The status line next to Save Images
will change from "FILENAME.INF" to "[File not
open]."
MetaFluor
56
Version 7.0
MetaFluor User’s Guide
Open Save Ratios File (File Menu)
Selects a base name for an existing set of ratio images that you want to open, or
selects a new name for the purpose of saving ratio images.
Use this command when you want to save ratio images during the acquisition of new images
or during playback of an existing experiment.
Most of the time, you probably will not want to save ratio images because MetaFluor can build
ratio images from the wavelength images whenever you open an experiment. However, if you
want to create a movie from the ratios or export the ratios to MetaFluor for further analysis,
you must save the ratio images first.
Each ratio image is saved as a .tif file using a sequential number format consisting of a unique
sequentially numbered name. The letters "A" and "B" are used to distinguish ratio A
(Wavelength 1 / Wavelength 2) from ratio B (Wavelength 4 / Wavelength 5). For example, a
series of ratio images might consist of the following files: RatioA0001.tif, RatioB0001.tif,
RatioA0002.tif, RatioB0002.tif, RatioA0003.tif, etc. MetaFluor will add the four digits to the end
of the name, to signify the acquisition cycle number.
After you have selected a base name for the set of ratio images, you can save the ratio
images by selecting the Save Ratios check box in the Experiment Control Panel (Run
Experiment menu) as needed.
QUICK TIP: A quick way to invoke the Open Save Ratios File command is to select Save
Ratios in the Experiment Control Panel dialog box. MetaFluor will open the Open Save Ratios
File dialog box so you can select a base name for the ratio image set. When you have
finished, Save Ratios will be selected in the Experiment Control Panel. "LED" indicators next
to the Save Ratios check box will indicate the saving status of each Ratio image: gray
indicates that saving is off, red indicates that saving is on but that the particular Ratio image
will not be saved, blue indicates that saving is on and that the image will be saved, but not on
every cycle, and green indicates that the image will be saved on every cycle.
See Also:
Experiment Control Panel:
For Video Camera with External Monitor
For Video Camera with Computer's Monitor
For Digital Camera
Close Save Ratios File
MetaFluor
57
Version 7.0
MetaFluor User’s Guide
Saving Ratio Image Files
To carry out the Open Save Ratios File command, use the following procedure:
Step
Action
1
Start a new experiment or open a stored
experiment from which you want to save
images. Load a protocol file if necessary.
2
From the File menu, choose Open Save
Ratios File. The Save Ratios File dialog box
will appear.
3
Type the base name for the ratio image series
in the File Name text box. MetaFluor will add
four digits and assign the extension ".tif" to
your name. Choose OK.
WARNING:
MetaFluor will automatically continue the
naming sequence that you select for the first
image--you must verify that there are no other
series of ratio images that use this sequence
before you select a name.
4
If you selected a file name that already exists,
MetaFluor will display a warning dialog box.
Choose Yes if you want to replace the existing
files.
OR
If you want to select another file name, choose
No.
5
The status line for Save Ratios in the
Experiment Control Panel will now display the
base name of the ratio image series.
MetaFluor
58
Version 7.0
MetaFluor User’s Guide
Open Save Ratios - Dialog Box Options
File Name
Lists the name of the currently selected file or specifies a new one, which will be used as
the base file name for the ratio image series.
Files of Type
Determines the file format of the files displayed in the File Name list.
Save In
Displays the currently selected folder. Click the icon for the desired folder to display its
files. Click the Up One Level button to go up one level in the directory structure.
Save
Opens the first image in the selected ratio image series, or saves the selected base
name for a new set of ratio images.
Cancel
Cancels the command.
MetaFluor
59
Version 7.0
MetaFluor User’s Guide
Close Save Ratios File (File Menu)
Clears the selected base name from use in saving a set of ratio images.
Use this command when you have finished saving ratio images from an experiment. This
command also clears the Save Ratios check box in the Experiment Control Panel (Run
Experiment menu) if it has been selected.
See Also:
Experiment Control Panel:
For Video Camera with External Monitor
For Video Camera with Computer's Monitor
For Digital Camera
Open Save Ratios File
MetaFluor
60
Version 7.0
MetaFluor User’s Guide
Terminating Ratio Image Saving
When you have finished saving ratio images, use the following procedure:
Step
Action
1
Select the File menu.
2
Choose Close Save Ratios File.
3
MetaFluor will clear the Save Ratios check box
in the Experiment Control Panel if it is still
selected. The status line next to Save Ratios
will change from "FILENAME" to "[File not
open]."
MetaFluor
61
Version 7.0
MetaFluor User’s Guide
Load Protocol File (File Menu)
Loads a protocol file for use during an experiment.
Use this command to load a protocol file that was saved previously with the Save Protocol File
command.
A protocol file stores each dialog box's selected options and position on-screen. Saving a
protocol file for each type of experiment (ratio, single-wavelength, and Delta F/F) will eliminate
the need to reconfigure such options as data logging or acquisition and display each time you
complete an experiment. MetaFluor protocol files use the extension ".fsf".
If you want to be prompted to load a protocol file whenever you open an experiment or start a
new one, you can configure an option in the General Preferences dialog box to do so
(Preferences command, File menu).
The settings for the currently active protocol file can be viewed at any time using the Get Info
command. The Get Info command can save the protocol settings to a text file, copy them to
the Clipboard, or send them to a printer.
See Also:
Preferences
Save Protocol File
Get Info
MetaFluor
62
Version 7.0
MetaFluor User’s Guide
Loading a Protocol File
To open a protocol file for a particular experiment, use the following procedure:
Step
Action
1
From the File menu, choose Load Protocol
File. The Load Protocol dialog box will appear.
2
Choose Select Protocol Directory. The Select
Directory dialog box will appear.
3
Open the desired folder. If necessary, use the
Save In list or Up One Level button to select
the desired folder. Then select any file in the
folder and choose Select.
The Select Directory dialog box will close, and
the path for the selected directory will appear
in the Load Protocol dialog box's Protocol Files
Are Located In status line.
4
Select the desired protocol file from the list by
clicking its entry in the Protocol Files (*.FSF)
list table.
5
Choose OK. The selected protocol file be
loaded, and the Load Protocol dialog box will
close.
MetaFluor
63
Version 7.0
MetaFluor User’s Guide
Load Protocol - Dialog Box Options
Select Protocol Directory
Opens the Select Directory dialog box, from which the current directory can be changed.
After you select the directory, its path will appear in the Protocol Files Are Located In
status line.
Protocol Files (*.FSF)
Selects one of the protocol files in the current folder.
Protocol Files Are Located In
Indicates the current directory, as selected with the Select Protocol Directory command
button.
Description
Displays any annotation that was entered when the protocol file was saved.
Timelapse Interval
Displays the time interval between image acquisitions. If images were not acquired in
timelapse fashion, this will read "0 sec."
Load INF
Displays the path for the folder from which the .inf file will be loaded.
Save INF
Displays the path for the folder where the .inf file will be saved.
Acquire Image
Specifies whether image acquisition has been enabled.
Update Image
Specifies whether updating of image display has been enabled.
Display Window
Specifies whether the image will be displayed.
Save Image
Specifies whether image saving has been enabled.
Wavelength
Selects the wavelength image for which the wavelength configuration information is to be
displayed.
Event Marks
Displays the event marks in the Events List.
OK
Loads the selected protocol file.
MetaFluor
64
Version 7.0
MetaFluor User’s Guide
Cancel
Cancels the command.
MetaFluor
65
Version 7.0
MetaFluor User’s Guide
Save Protocol File (File Menu)
Saves the on-screen position of each dialog box and image window, and the
current selection of configuration options (illumination, acquisition, etc.).
Use this command to save a protocol file. A protocol file stores each dialog box's selected
options and position on-screen, as well as all acquisition and display settings. Saving a
protocol file for each type of experiment (ratio, single wavelength, and Delta F/F) will eliminate
the need to reconfigure such options as data logging or acquisition, and you can configure
MetaFluor to display its settings each time you complete an experiment.
When you save a protocol file, the Save Protocol dialog box will appear. MetaFluor will add
the extension ".fsf" to your file name.
Protocol files can be loaded using the Load Protocol File command. If you want to be
prompted to load a protocol file whenever you open an experiment or start a new one, you can
configure an option in the General Preferences dialog box to do so (Preferences command,
File menu).
The settings for the currently active protocol file can be viewed at any time using the Get Info
command. Both the Save Protocol File and Get Info commands can save the protocol settings
to a text file, copy them to the Clipboard, or send them to a printer.
See Also:
Preferences
Load Protocol File
Get Info
MetaFluor
66
Version 7.0
MetaFluor User’s Guide
Saving a Protocol File
To save a protocol file, use the following procedure:
Step
Action
1
From the File menu, choose Save Protocol
File. The Save Protocol dialog box will appear.
2
If you wish, type an annotation in the
Description text box.
3
If you want to print or export the information in
the Save Protocol dialog box, choose Export.
The Export dialog box will appear. Choose
Save Info to a Text File if you want to store the
information as a text file. The export Info to
File dialog box will appear. Type a name for
the file in the File Name text box, use the Save
In list or Up One Level button to select the
drive and folder if necessary, and choose
Save.
Copy Info to Clipboard if you want to copy the
information to the Clipboard for pasting into
another Windows-based program.
Print Info if you want to send the information to
a printer.
4
Choose Save. The Save Protocol dialog box
will appear.
5
Select the desired directory. If necessary, use
the Save In list or Up One Level button to
change to the correct location.
6
Type the desired name in the File Name text
box. For example, a protocol file for a Delta
F/F experiment could be named "DeltaF."
MetaFluor will add the file extension ".fsf" to
your file name.
7
Choose Save. The Select Directory dialog box
will close and the Save Protocol dialog box will
reappear.
8
When you have finished, click the Close button
in the upper right corner of the Save Protocol
dialog box to close it.
MetaFluor
67
Version 7.0
MetaFluor User’s Guide
Saving a Protocol File and Closing an Experiment
The best time to save a protocol file is right after you have completed an experiment
since all of the appropriate dialog box options are already selected.
To save a protocol file, use the following procedure:
Step
Action
1
From the File menu, choose Close
Experiment. A dialog box will appear.
2
Choose Yes to close the experiment and save
the protocol. The Save Protocol dialog box will
appear.
3
If you wish, type an annotation in the
Description text box.
4
If you want to print or export the information in
the Save Protocol dialog box, choose Export.
The Export dialog box will appear. Choose
Save Info to a Text File if you want to store the
information as a text file. The export Info to
File dialog box will appear. Type a name for
the file in the File Name text box, use the Save
In list or Up One Level button to select the
drive and folder if necessary, and choose
Save.
Copy Info to Clipboard if you want to copy the
information to the Clipboard for pasting into
another Windows-based program.
Print Info if you want to send the information to
a printer.
5
Choose Save. The Save Protocol dialog box
will appear.
6
Select the desired directory. If necessary, use
the Save In list or Up One Level button to
change to the correct location.
7
Type the desired name in the File Name text
box. For example, a protocol file for a Delta
F/F experiment could be named "DeltaF."
MetaFluor will add the file extension ".fsf" to
your file name.
8
Choose Save. The Select Directory dialog box
will close and the Save Protocol dialog box will
reappear.
9
When you have finished, click the Close button
in the upper right corner of the Save Protocol
dialog box to close it.
MetaFluor
68
Version 7.0
MetaFluor User’s Guide
Save Protocol - Dialog Box Options
Description
Use this text box to type any comments or annotation that you want to attach to the
protocol file.
Timelapse Interval
Displays the time interval between image acquisitions. If images were not acquired in
timelapse fashion, this will read "0 sec."
Load INF
Displays the path for the folder from which the .inf file will be loaded.
Save INF
Displays the path for the folder where the .inf file will be saved.
Acquire Image
Specifies whether image acquisition has been enabled.
Update Image
Specifies whether updating of image display has been enabled.
Display Window
Specifies whether the image will be displayed.
Save Image
Specifies whether image saving has been enabled.
Exposure Time
Displays the exposure time for the selected wavelength image (digital acquisition).
Camera Gain
Displays the gain setting if your digital camera supports this feature.
Illum. Device
Displays the name of the installed Illumination MetaDevice used for the selected
wavelength image.
Wavelength
Displays the wavelength of illumination for the selected wavelength image.
Intensity
Displays the intensity of illumination for the selected wavelength image.
Use Shutter
Displays the shutter usage status (Yes or No) for the selected wavelength image.
Wavelength
MetaFluor
69
Version 7.0
MetaFluor User’s Guide
Selects the wavelength image for which the configuration, acquisition, and display
information is displayed. Most of these settings were specified in the Configure
Acquisition dialog box (Configure menu).
Event Marks
Displays the event marks in the current Events List.
Save
Opens the Save Protocol dialog box, from which you can select a file name, folder, and
drive for the protocol file. The file will be saved when you choose Save and return to the
Save Protocol dialog box.
Export
Opens the Export dialog box, from which you can save the information to a text file, copy
it to the Clipboard, or send it to a printer.
Cancel
Cancels the command.
MetaFluor
70
Version 7.0
MetaFluor User’s Guide
Archive Experiment (File Menu)
Compresses a selected set of files pertaining to an experiment using PKZIP
compression software.
Use this command to create a PKZIP file that compresses an experiment's files. The archive
file can be stored anywhere, such as on an optical memory disk recorder (OMDR) drive. You
can also use this command to append to an existing archive file when you need to add new
files or replace existing files in it. You must type an Archive Description in the dialog box
before archiving the experiment.
When an .inf file is selected as a source file, MetaFluor will automatically select the images
associated with that experiment file so that you do not need to mark each image file
separately when marking files for the compressed file.
An archived experiment can be extracted using the Extract Archived Files command.
See Also:
Extract Archived Files
MetaFluor
71
Version 7.0
MetaFluor User’s Guide
Archiving an Experiment
To archive an experiment, use the following procedure:
Step
Action
1
From the File menu, choose Archive
Experiment. The Archive Experiment dialog
box will appear.
2
Choose Source File Directory. The Browse for
Folder dialog box will appear.
Select the folder which contains the files you
want to archive and choose OK to return to the
Archive Experiment dialog box. The files in
your selected folder will appear in the Source
Files table.
3
To mark files for the archive, select the desired
file name in Source Files table so that it is
highlighted. Then choose Toggle Check
On/Off. A check mark will appear before the
file's name. Repeat for each file you want to
add.
OR
Double-click a file's name to select or clear the
check mark.
4
To choose the location and file name for the
compressed file, choose Archive Location. The
Archive Location dialog box will appear.
Use the Save In list to select the desired
location. Then type the file name for the
compressed file in the File Name text box.
Choose Save.
5
When you have marked the desired files for
the archive, type a description for the archive
in the Archive Description text box.
6
If the archive file already exists, the Archive
Exists dialog box will appear.
Choose Freshen to add files to an existing
archive or Replace to replace the entire
archive with new files.
7
A confirmation message will appear, informing
you of the number of files and the size of the
archive file.
Choose Archive to compress the selected files
into a single archive (*.zip) file.
MetaFluor
72
Version 7.0
MetaFluor User’s Guide
Archive Experiment - Dialog Box Options
Source File Directory
Opens the Browse for Folder dialog box, from which you can selects the folder containing
the source files that are to be archived. The files in your selected folder will appear in the
Source Files table.
Archive Location
Specifies the name of the archive file and the location for storage of the file. Use the
Save In list to specify the location. You can create a new subfolder by clicking the Create
New Folder button, if necessary. Then type the name of the archive file in the File Name
text box. Choose Save when you have finished. After you have specified an archive file,
its name and location will be displayed next to the Archive Location command button.
Source Files
Lists the files in the source file directory. Only those marked with a check mark will be
archived when you choose Archive. Use the commands below the Source Files list to
enable/disable the check marks. You can also double-click the desired file names to
enable/disable the check marks.
Source File Description
Displays a description of the selected file. If an .inf file is selected, the number of image
files associated with the experiment will also be displayed in the description.
Archive Description
Lists your choice of a description for the archive. You must type a description in this text
box before archiving an experiment.
Toggle Check On/Off
Enables or disables the check mark for the selected source file name.
Check All On
Enables the check marks for all files in the directory.
Check All Off
Clears the check marks from all files in the directory.
Archive
Compresses the marked files in an archive file. If an existing archive file is selected, this
command can be used to freshen (add to) the archive or completely replace the contents
of the archive.
Cancel
Cancels the command.
MetaFluor
73
Version 7.0
MetaFluor User’s Guide
Extract Archived Files (File Menu)
Extracts files from an archive file using PKUNZIP decompression software.
Use this command to extract files that were compressed using the Archive Experiment
command. This command displays the names of all files in a compressed file. The Extract
Archived Files command displays the amount of space that the files will occupy after they are
extracted, as well as the space currently available on the selected destination drive.
See Also:
Archive Experiment
MetaFluor
74
Version 7.0
MetaFluor User’s Guide
Extracting Archived Files
To extract files which have been archived, use the following procedure:
Step
Action
1
From the File menu, choose Extract Archived
Files. The Extract Archived Files dialog box
will appear.
2
To select the location of the archive file you
want to extract, choose Archive Directory. The
Browse for Folder dialog box will appear.
Select the folder which contains archived file
that you want to decompress. Then choose
OK to return to the Extract Archived Files
dialog box. Any archive files residing in the
selected folder will appear in the Archives
table.
3
To choose the location and file name for the
extracted files, choose Extracted Files
Directory. A second version of the Browse for
Folder dialog box will appear.
Select the folder where you want the extracted
files to reside. If necessary, choose New to
create a new folder, and type a name for the
folder in the text box which appears next to the
new folder's icon. Then choose OK to return to
the Extract Archived Files dialog box.
4
Select the archive file that you want to extract
from Archives table.
The name of the files in the archive file will be
displayed in the Archive Contents list.
5
Choose Extract.
If a file to be extracted has the same name as
an existing file in the folder, you will be asked
if you want to rename the file or overwrite it.
When the file(s) are extracted, a confirmation
message will be displayed. Choose OK.
MetaFluor
75
Version 7.0
MetaFluor User’s Guide
Extract Archived Files - Dialog Box Options
Archive Directory
Opens the Browse for Folder dialog box, from which you can select the folder containing
the archive file to be unzipped. Any archive files residing in the selected folder will appear
in the Archives table.
Extracted Files Directory
Opens the Browse for Folder dialog box, from which you can specify a location for the
extracted files. If necessary, choose New to create a new folder, and type a name for the
folder in the text box which appears next to the new folder's icon. When you have
specified a folder for the extracted files, its name will be displayed next to the Extracted
Files Directory command button.
Archives
Lists the names of the archive files in the selected archive directory. The highlighted
folder will be the one that is extracted.
Archive Contents
Displays a list of the names of the files contained in the archive file. For compressed
experiment files, this includes both the .inf files and the image files.
Archive Description
Displays the archive's description.
Extracted Files from This Archive Will Occupy
Displays the amount of space needed for the files in the archive when they are extracted.
Disk Space Available on Selected Drive
Displays the amount of disk space currently available on the selected drive.
Extract
Extracts the archive file selected in the Archives list.
Close
Closes the dialog box.
MetaFluor
76
Version 7.0
MetaFluor User’s Guide
Print Image (File Menu)
Prints the active image to the selected printer.
Use the Print Image command to print images if a printer is available. You can select the exact
size and position of the image on the printed page. You can also choose whether or not to
print the name of the image (which you can change) at the top of the page, and whether or not
to include the overlay information (thresholding overlays, object overlays, graphics, and so
on).
The image will be printed as displayed. Thus, if the Scale 16-Bit Images command has been
applied to a 16-bit image prior to printing, the scaled "8-bit" view of the image will be printed.
Note: All images that are printed with their object overlays will be rendered using 24-bit pixel
encoding (even 8-bit images and scaled 16-bit images). Because this requires three times as
much printer memory as an 8-bit image, and because a temporary buffer is used to render the
image, you must make certain that your printer has sufficient memory to print full-page
graphics.
See Also:
Scale 16-Bit Images
MetaFluor
77
Version 7.0
MetaFluor User’s Guide
Printing an Image
To print an image, use the following procedure:
Step
Action
1
From the File menu, choose Print Image. The
Microsoft Windows standard Print dialog box
will appear.
2
The currently selected printer will be displayed
at the top of the dialog box. If you do not want
to use this printer, choose Properties and
select a different printer from the Name list in
the Print Setup dialog box that appears. Then
choose OK to return to the Print dialog box.
3
Select All from the Print Range group.
4
Select the desired number of copies you want
to print using Number of Copies.
5
If you want to specify an image size and
position that differs from the default (full page,
centered), choose Options and select your
alternative settings from the Print Options
dialog box. Then choose OK.
6
If you want to print the image overlays, select
the Print Image Overlay Information check box
so that a check mark appears in it.
7
Choose OK to close the Print Options dialog
box and return to the Print dialog box.
8
Choose OK to carry out the print command.
9
MetaFluor will display a status box while
printing the image.
You can choose Cancel from the status box to
stop the printing.
Note: If Windows has started downloading the
print job to the printer when you choose
Cancel, you may need to wait for the printer to
finish, or you may need to reset the printer
manually.
MetaFluor
78
Version 7.0
MetaFluor User’s Guide
Selecting Printing Options
To change the Print Option settings for the image to be printed, use the following
procedure:
Step
Action
1
From the Print dialog box, choose Options.
The Print Options dialog box will appear.
2
If you want to include the image title with the
printed image, select Yes from the Print Title
radio button group. If necessary, you can type
a different title in the accompanying text box.
OR
If you want to omit the image title, select No.
3
Use the Left and Top text boxes in the Position
group to specify the distance, in inches,
between the upper left corner of the paper and
the left and top edges, respectively, of the
printed image. Alternatively, you can drag the
box-in-box, displayed at the left of the Print
Options dialog box, to manipulate the
placement of the image on the printed page.
OR
If you want to center the image on the printed
page, choose Center.
4
Use the Width and Height text boxes in the
Size group to specify the horizontal and
vertical size, in inches, of the image on the
printed page.
OR
If you want the image to be as large as the
paper size (and printer) permits, choose Fill
Page.
5
If there are any regions of interest defined on
the image, select a setting for the Region
Outline Color. You can select either a White or
Black outline, or, if you do not want to draw the
regions on the printed image, select None.
6
If you want to print the image overlays
(segmentation and thresholding overlays,
object measurement overlays, etc.), select
Print Image Overlay Information.
7
If the lines and edges of objects in your image
are "jaggy" (i.e., appear "boxy") and you want
to use an algorithm to smooth the edges,
select the Interpolate Image to Smooth Pixel
Edges check box.
Note: This algorithm works by increasing the
number of pixels and interpolating where the
newer, intervening pixels should be. Image
overlays can not be expanded in this manner.
Consequently, the Interpolate Image to
Smooth Pixel Edges option and the Print
MetaFluor
79
Version 7.0
MetaFluor User’s Guide
Image Overlay Information option are mutually
exclusive.
8
Choose OK to accept the Print Options
settings and return to the Print dialog box.
MetaFluor
80
Version 7.0
MetaFluor User’s Guide
Print - Dialog Box Options
Printer
Lists the current printer.
Print Range
Selects the print range to be printed.
Number of Copies
Selects the number of copies to print.
Collate Copies
When more than one copy of a multiple-page selection is being printed, selecting this
check box will direct the printer to print all pages in the first copy of the selection before
starting any of the pages for the next copy. When this box is cleared, all copies of a page
in the selection will be printed before starting on the next page in the selection.
Properties
If you do not want to use the printer listed in the Printer status line, choosing this
command button will open the Print Setup dialog box. You can select a different printer
from the Name drop-down list box .
Options
Opens the Print Options dialog box.
Cancel
Cancels the command.
OK
Starts the printing process and displays a printing status dialog box while the image is
printing.
MetaFluor
81
Version 7.0
MetaFluor User’s Guide
Print Options - Dialog Box Options
Print Title
Specifies whether the image title is to be printed with the image. Select Yes to print the
title, which you can change by typing a new name in the accompanying text box. Select
No to omit the title.
Left
Specifies the distance, in inches, from the edge of the page to the left edge of the printed
image.
Top
Specifies the distance, in inches, from the top of the page to the top edge of the printed
image.
Center
Prints the image directly in the center of the printed page. This is the default setting for
image position.
Width
Specifies the horizontal size, in inches, of the printed image.
Height
Specifies the vertical size, in inches, of the printed image.
Fill Page
Prints the image as large as the paper size will permit. This is the default setting for
image size.
Region Outline Color
Selects whether the outlines of regions of interest are to be left off of the printed image
(None), to be drawn in White, or drawn in Black. The default setting is None.
Print Image Overlay Information
When selected, this option allows you to print all image overlays (except region outlines,
which can nevertheless be printed using Region Outline Color) that are on the image
when the image is printed.
Interpolate Image to Smooth Pixel Edges
Applies an algorithm to smooth the lines and the edges of objects in the image. Note:
This algorithm works by increasing the number of pixels and interpolating where the
newer, intervening pixels should be. Image overlays can not be expanded in this manner.
Consequently, the Interpolate Image to Smooth Pixel Edges option and the Print Image
Overlay Information option are mutually exclusive.
OK
Accepts the Print Options settings.
Cancel
MetaFluor
82
Version 7.0
MetaFluor User’s Guide
Cancels any changes to the dialog box settings.
MetaFluor
83
Version 7.0
MetaFluor User’s Guide
Select Video/Camera for Acquisition (File Menu)
Selects an active video board or camera and video channel from a list of the video
devices that have been installed with the Video Driver Manager.
Use this command to change the current video device from the default selection without
needing to quit MetaFluor and use the Video Driver Manager. This command's dialog box will
display only those video devices that are currently installed. If you want to use a video device
that is not currently installed, you must quit MetaFluor and use the Video Driver Manager to
install it.
This command temporarily changes the current video device for the current work session; it
does not change the default video device selection in the Video Driver Manager.
You can use this command only before opening a new or stored experiment. After you open a
stored experiment or start a new experiment, this command will become unavailable.
Note: This command is unavailable in the MetaFluor Offline system.
See Also:
Video Driver Configuration
MetaFluor
84
Version 7.0
MetaFluor User’s Guide
Preferences (File Menu)
Changes the default settings for one or more states or actions that occur in the
MetaFluor environment to your preferred choice among the available settings.
Use the Preferences command to change settings for options that fall in one of the following
categories:
General,
Digital Camera,
Video Camera,
Scale Bar,
Calibration,
Playback,
Data Logging, and
Dual View.
In addition, you can use the Initialize to Defaults command in the File menu to return settings
to their original state. This command will affect such settings as the automatic appearance of
the Status and Notebook windows and the graph configuration settings, but will not affect
video or device drivers or image window placement. The Initialize to Defaults command is
available only when there is no experiment open or active.
Changes made to the Preferences settings will affect the remainder of the current work
session and all subsequent sessions unless you change the settings later.
Note: The Video Camera, Digital Camera, and Focusing Preferences are unavailable in the
MetaFluor Offline system.
MetaFluor
85
Version 7.0
MetaFluor User’s Guide
Selecting Preferences
To select preferences, use the following procedure:
Step
Action
1
From the File menu, choose Preferences. The
Preferences dialog box will appear.
2
Select the tab for the type of preferences you
wish to configure: General, Digital Camera,
Video Camera, Scale Bar, Calibration,
Playback, Data Logging, or Focusing.
3
Select the options you want to use. (Refer to
the description for each option next to the
appropriate check box in each of the
Preferences dialog box pages.)
4
Choose OK to accept the selected
preferences.
MetaFluor
86
Version 7.0
MetaFluor User’s Guide
General Preferences - Dialog Box Options
Prompt to Select a Protocol File
Opens the Load Protocol dialog box automatically when you open an existing experiment
or start a new experiment.
Open the Status Window
Opens the Status window automatically when you open an experiment or start a new
experiment.
Open the Notebook Window
Opens the Notebook window automatically when you open an experiment or start a new
experiment.
Open the Experiment Control Panel
Opens the Experiment Control panel automatically when you open an experiment or start
a new experiment.
Backup the INF File to *.BAK
When this check box is selected, the .inf file will be copied to a backup (*.bak) file at the
specified interval of acquisition cycles.
Make Backup Every… Cycles
Specifies the acquisition cycle interval between .inf file backups.
Save Using LZW Compressed TIFF Files
Uses Lempel Ziff compression to store your images. This is a lossless compression (i.e.,
with no loss of image data) that can save storage space, particularly with images that
have less pixel-to-pixel variability of gray values.
Average All Regions of the Same Color
All regions of the same color will be considered one disjoint region.
Draw Labels Next to Region Outlines
Displays numeric labels next to each region of interest.
Region Label
Opens the Regions Label Position dialog box. You can specify the location of the label
(Top, Bottom, Left, or Right), its position inside the region outline, and its foreground and
background colors. You can also choose whether or not to fill the label background.
Use Graph Markers
If this option is selected, clicking on a graph displays a line which appears at that location
on all graphs, and moves with the pointer when the mouse button is held down. This
option allows you to compare data at a given X-axis position in all graphs.
Do Not Clear Graph When Regions Change
When this option is selected, the graphs will not be cleared even when new regions are
created or when regions are edited.
MetaFluor
87
Version 7.0
MetaFluor User’s Guide
Maximum Number of Points on Graph
Specifies the maximum number of points plotted on the MetaFluor graphs.
Allow Repositioning of Acquisition Region When Focusing
When selected, this option permits repositioning of the acquisition region during a
focusing procedure in which the image is displayed in an image window. This ability is
optional because it may be undesirable when certain cameras are used because some
cameras, such as the Hamamatsu 4880-80, take a long time to download the new region.
Ratio Image Display
Selects the method by which ratio images are calculated and displayed in an Intensity
Modulated Display (IMD). If you select Display as 8-Bit Image with LUT, ratio images
will be displayed by scaling the IMD display over a range of 256 possible pixel
color/intensity values. If you select Display as 24-Bit Image (Default value), you will be
able to select an IMD overlay display with the Image Display Controls command
(Configure menu), using a grayscale image of your choice (either one of the wavelength
images, the average of the intensity values at each pixel in all wavelength images, or the
maximum intensity value at each pixel in the wavelength images) to represent intensity.
The ratio images will be displayed over a range of ~16.7 million color values, using an
IMD display that represents the ratio values by the hue in each image pixel. Note: This
latter method is mathematically intensive and therefore slower. It is thus best suited for
display of images from stored experiments.
OK
Accepts any changes to the general preferences.
Cancel
Cancels the command.
MetaFluor
88
Version 7.0
MetaFluor User’s Guide
Digital Camera Preferences - Dialog Box Options
Current Camera Temperature
Displays the current temperature for the camera. Use the configuration settings in the
Meta Imaging Series Administrator to specify the cooling temperature for the camera.
Camera Settings
Sets the Light Mode and Camera Offset values for Hammamatsu cameras.
Light Mode
Sets the camera’s light mode to either High or Low.
Camera Offset
Adjusts the black level reference above the zero level to reduce or eliminate background
noise.
Chip Clear Counts
Specifies the "Clear Counts" setting for wiping the camera chip before acquisition. The
default setting is 2 wipes.
Method of Focusing the Camera
Selects a location for the images that are displayed during the Experiment Control
Panel's focusing procedure--either on the computer's monitor (Update an Image Window
on the Screen) or on an external video monitor (Use an External Monitor).
Maximum Bit Depth
Sets the image bit depth. Enables you to expand the camera image bit depth range to fit
within the bit depth range of the acquired image. Set this value to 24-Bit to enable color
image acquisition from qualified color video cameras.
Reset Camera
Sends a command to the camera to reinitialize it.
Keep Stream Memory
If this box is checked, the contents of memory are retained after streaming is finished.
OK
Accepts any changes to the digital camera preferences.
Cancel
Cancels the command.
MetaFluor
89
Version 7.0
MetaFluor User’s Guide
Video Camera Preferences - Dialog Box Options
Settling Time (ms) for Changing Analog Values
Specifies the time to wait before acquisition changing the video analog settings.
Settling Time (ms) for Changing Input Channel
Specifies the time to wait before acquisition after changing the video input channel.
Sum Frames Instead of Averaging Frames
Directs MetaFluor to acquire images by summation into a 16-bit image, rather than by
averaging. This option will be useful in low-light applications in which averaging yields
images that are too dark to discern contrast differences.
Note: This option only applies when you are using a video-rate camera.
Focus using an external monitor if it is attached
Indicates that image focusing will use an optional external monitor connected to the video camera
interface. If your video camera interface provides a connection for an external monitor to use for
focusing, and you have a monitor connected, click this box.
OK
Accepts any changes to the video camera preferences.
Cancel
Cancels the command.
MetaFluor
90
Version 7.0
MetaFluor User’s Guide
Scale Bar Preferences - Dialog Box Options
Scale Bar Drawing
Specifies which images should have scale bars drawn on them. Choose one of the
following options:
Off – No scale bar
Scale Bar on Ratio Only – Scale bar only on the ratio image
Scale Bar on All Images – Scale bars on all images
Scale Bar Size
Determines the size of the scale bar displayed in the image viewer and the amount of
space that it will use. Choices are Large, Medium, and Small.
Scale Bar Location
Specifies the location of the scale bar as either the left or right side of the image.
Scale Bar Labels
Stamps a scale bar on the image.
Scale Bar Location
Specifies whether the scale bar is to appear on either the left or right side of the image.
OK
Accepts any changes that you made to the preferences dialog box.
Cancel
Closes the Preferences dialog box and disregards any changes that you made on any
preference tab.
MetaFluor
91
Version 7.0
MetaFluor User’s Guide
Calibration Preferences - Dialog Box Options
Ask Whether Backgrounds Should Be Subtracted
When this option is selected, you will be asked whether background reference images
should be subtracted when you load calibration reference images.
Default to Subtracting Backgrounds
Specifies the default for background subtraction when loading calibration reference
images to subtract the background reference images.
Equation Calibration in vitro:
Provides a checkbox to specify using a higher ratio for lower concentration solutions.
Invert Equation Calibration
Specifies that a higher ration is needed to accommodate a lower concentration.
Equation Calibration Method
Specifies one of two possible methods to use as the Equation Calibration Method.
Standard
Uses a single set of calibration constants for the experiment. This method is
recommended when the calibration images are from standard solutions, or the calibration
constants are determined from calibrating experimental images.
Normalized per region calibration
Uses a different set of calibration constants for each Region-of-Interest in the experiment.
Use this method when an independent Rmin-Rmax dynamic range is assumed for each
region or pixel in the image.
OK
Accepts any changes to the calibration preferences.
Cancel
Cancels the command.
MetaFluor
92
Version 7.0
MetaFluor User’s Guide
Playback Preferences - Dialog Box Options
First Image Is at Original Time
Determines what time is to be assigned to the first image in the series. If image
acquisition was not initiated immediately when the New Experiment command was
chosen, the first image will have a non-zero time. Selecting the First Image Is at Original
Time check box will assign that time to the image. Clearing the check box will assign a
time of 0.00. Times for all subsequent images will be assigned in accordance with your
selection.
Automatically Open Event List on Experiment Playback
Automatically displays a list of events when an experiment is played back.
Display Dialog When an Event Mark Occurs During Playback
Displays a message dialog box notifying the user that an event has occurred during
playback.
Erase Graphs If Clock Reset During Playback
Erases the graphs if the clock is reset during playback mode.
Clicking on Graph Displays Image Nearest That Time
If this option is selected, MetaFluor will display the images that correspond to that time on
the graph.
OK
Accepts any changes to the playback preferences.
Cancel
Cancels the command.
MetaFluor
93
Version 7.0
MetaFluor User’s Guide
Data Logging Preferences - Dialog Box Options
Time
Specifies the units of measure for the logged data (Milliseconds, Seconds, Minutes, or
Hours).
Average Value, Integrated Value, Area, Ratio, and Calibrated Value
Specifies the formatting used for logging each of these values. You can use the period (.)
and the number sign (#). For example, to use three significant digits in the decimal, type
"#.###".
Log Header After Editing Regions
Logs regional coordinates, size, and thresholded areas automatically whenever you edit
any regions (move, resize, add, remove) with the Define Regions for Measurement
command.
OK
Accepts any changes to the data logging preferences.
Cancel
Cancels the command.
MetaFluor
94
Version 7.0
MetaFluor User’s Guide
Dual View Preferences - Dialog Box Options
A Dual View Emission Splitter is installed.
Check this box to enable the Configure Dual View command on the Configure menu.
Orientation
Choose Vertical or Horizontal to specify the orientation of the camera to the emission splitter.
OK
Accepts any changes to the focusing preferences.
Cancel
Cancels the command.
MetaFluor
95
Version 7.0
MetaFluor User’s Guide
Initialize to Defaults (File Menu)
Returns the MetaFluor system settings to their default states.
Use this command to return settings to their original "factory-configured" state. This command
will affect such settings as the automatic appearance of the Status and Notebook windows
and the graph configuration settings, but will not affect video or device drivers or image
window placement. The Initialize to Defaults command is available only when there is no
experiment open or active.
See Also:
Load Protocol File
Preferences
MetaFluor
96
Version 7.0
MetaFluor User’s Guide
Initializing MetaFluor Settings to Their Default
State
To reset the MetaFluor system settings back to their "factory" default settings, use the
following procedure:
Step
Action
1
From the File menu, choose Initialize to
Defaults. A message box will appear, asking
you to verify that you want to reset the settings
back to their defaults.
2
Choose Yes. The settings will be reset.
MetaFluor
97
Version 7.0
MetaFluor User’s Guide
Configure Paths (File Menu)
Configures the default directory paths for the location of each type of file that is
opened or saved in MetaFluor.
Use this command to specify the default paths for file types that are frequently saved in the
same directory location. For example, if you always save journal toolbars to a directory called
\MM\Apps\MMFluor\Toolbars, you can use this command to configure the default path for
Journal Toolbars so that whenever you create or load a journal toolbar, the
\MM\Apps\MMFluor\Toolbars directory will appear in the dialog box as the default directory.
See Also:
Save Protocol File
MetaFluor
98
Version 7.0
MetaFluor User’s Guide
Configuring Paths
To configure your default paths, use the following procedure:
Step
Action
1
From the File menu, choose Configure Paths.
The Configure Paths dialog box will appear.
2
Pick the entry in the MetaFluor Path column
that you want to change.
OR
If you want to use the same path for several
file types, select the corresponding entry
check boxes in the MetaFluor Path column.
3
Choose the Set button for the selected entry.
OR
If you selected several check boxes in Step 2,
choose the Set button for any of the entries for
which you checked a MetaFluor Path check
box.
The Browse for Folder dialog box will appear.
4
Select the appropriate folder for the type of
files you selected in the MetaFluor Path list.
Then choose OK to return to the Configure
Paths dialog box.
5
By default, the path that has been stored in a
protocol file will supersede the path you set
here. If you want the path you are configuring
here to be used, rather than the paths
indicated by protocol files, click the In Protocol
button to toggle it to read "Globally." If
necessary, another click will toggle the button
back to the "In Protocol" state.
6
Repeat Steps 2 - 5 for each entry that you
want to configure.
OR
If you selected several check boxes in Step 2,
choose Set Checked Paths to Current
Directory.
7
When you have finished, choose Close.
MetaFluor
99
Version 7.0
MetaFluor User’s Guide
Configure Paths - Dialog Box Options
MetaFluor Path
Selects a file type used by MetaFluor for which you want to modify the default path. The
check boxes allow you to select more than one file type, which you can then set to the
same directory path by choosing the Set Checked Paths to Current Directory button.
Directory Path
Indicates the current directory path setting for the entry.
Set
Opens the Browse for Folder dialog box, from which you can select the desired drive and
folder for the file type.
Path Saved
Selects how the path configuration will be saved. By default, paths that have been saved
in protocol files will supersede the path settings configured in the Configure Paths dialog
box (In Protocol). Clicking this button toggles it to the Globally state, which will force the
use of the path configured here to be used, rather than the paths stored in the protocol
file. Another click of this button toggles it back to In Protocol.
Set Checked Paths to Current Directory
Configures the current directory path for all file types whose check boxes have been
selected in the MetaFluor Path column. At least one check box must be selected for this
button to become available.
Clear Check Marks
Clears all check boxes in the MetaFluor Path column. At least one check box must be
selected for this button to become available.
Close
Closes the dialog box.
MetaFluor
100
Version 7.0
MetaFluor User’s Guide
Exit (File Menu)
Closes any experiments that are currently open or running and quits the MetaFluor
imaging program.
Use the Exit command to end the current work session and to quit the MetaFluor program
before working with another Windows-based program or exiting Windows. In general, it is best
to close the current experiment before exiting. MetaFluor will save the default protocol file
when exiting, but you must save custom protocol files while closing the current experiment.
TIP: To exit quickly, click the Close button in upper right corner of the MetaFluor title bar.
See Also:
Close Experiment
MetaFluor
101
Version 7.0
MetaFluor User’s Guide
Exiting MetaFluor
To exit MetaFluor, use the following procedure:
Step
Action
1
From the File menu, choose Exit.
2
If an experiment is still open, MetaFluor will
direct you to close the experiment. Select:
Yes to close the experiment and save a the
current custom protocol,
No to close the experiment without saving the
current protocol, or
Cancel to cancel the Close Experiment and
Exit commands.
3
MetaFluor will then ask you to confirm the Exit
command. Choose Yes to quit the MetaFluor
program.
MetaFluor
102
Version 7.0
MetaFluor User’s Guide
Configure Menu
MetaFluor
103
Version 7.0
MetaFluor User’s Guide
Configure Acquisition (Configure Menu)
Assigns the wavelength and intensity of the illumination to be used when
acquiring each wavelength image. Configures the camera parameters and
acquisition region for each image. You can also use the Configure Acquisition
command to assign a name to each of the wavelength images.
When configuring a wavelength, you need to select an Illumination MetaDevice, the desired
illumination wavelength and/or intensity values, the Z-motor device (if applicable), and the
shutter that you will use (if applicable). If you are using a "video rate" camera, you can also
select the appropriate video channel for that wavelength.
For a typical fura-2 ratioing experiment using a dual filter wheel, this command allows you to
select an excitation wavelength filter and a neutral density filter for each wavelength.
Depending on the hardware available and the type of experiment you are performing, you
could also set the laser line and power for illumination, the wavelengths of a monochromator,
or the position of an emission filter wheel.
This command also enables you to assign a different Z Position to each wavelength to enable
you to compensate for refractive differences in image focus caused by wavelength
transmission property differences.
Notes:
This command is unavailable when you are playing back images stored on disk.
This command is unavailable in the MetaFluor Offline system.
See Also:
Configure Illumination
MetaFluor
104
Version 7.0
MetaFluor User’s Guide
Configuring Acquisition for Digital Cameras
To configure acquisition parameters for digital cameras, use the following procedure:
Step
Action
1
From the Configure menu, choose Configure
Acquisition. The Configure Acquisition dialog
box will appear.
2
Select Wavelength 1 from the Wavelength to
Configure list.
3
If you want to rename the image window,
select Custom Defined from the Wavelength
Name option button group and type the new
name in the accompanying text box.
4
Select the desired MetaDevice from the
Illumination MetaDevice list.
5
If you need to specify a Z position to be
associated with this wavelength, click Set Z
position for this wavelength to and type the
specific Z position in the box. For information
about setting the Z position, see the help for
the Z Position Control dialog box.
6
If you want to use an acquisition subregion,
use the Left, Top, Width, and Height spin
boxes in the Camera Binning and Sub-Region
group to select the region's starting (upper left)
X and Y coordinate, width, and height,
respectively. Alternatively, you can choose
Select Region. This will display a restrictedmode image window that contains a region
with draggable borders. The acquisition region
will be defined proprotionally such that, if you
change the size of the overall image (for
example by changing binning), the region will
remain the same relative size and in the same
relative location on the image. After you
configure the region, choose OK from the
Select Region dialog box that also appeared.
OR
If you want to use the entire camera chip for
acquisition, choose Use Entire Image from the
Configure Acquisition dialog box.
7
If your camera supports binning, you can
select values for pixel binning with the Binning
spin box.
8
Using Exposure Time, select the length of time
for each acquisition.
Note: If you want to use different exposure
times for each wavelength image, select Allow
Items to Differ for Each Wavelength.
9
If available for your camera, you can select
settings for Gain, Bit Depth, and Transfer
MetaFluor
105
Version 7.0
MetaFluor User’s Guide
Speed.
Note: If you want to use different settings for
each wavelength image, select Allow Items to
Differ for Each Wavelength.
10
Optionally set an appropriate Intensifer Gain
level if your camera supports this feature.
11
Select the next wavelength from the
Wavelength to Configure list. Repeat Steps
3 - 11, as needed, for each wavelength
12
Choose Close when you have finished.
MetaFluor
106
Version 7.0
MetaFluor User’s Guide
Configure Acquisition - Dialog Box Options
(Digital Camera)
Wavelength to Configure
Specifies the wavelength image that you are configuring for acquisition. Each wavelength image can have
separate acquisition settings.
Wavelength Name
Enables you to assign a custom name to each wavelength that you will use.
Use Selected Wavelength as Name
Accepts the "Wavelength X" entry as the name to use for the wavelength image name. This name
will also be used by such commands as Configure Experiment and Image Display Controls.
Custom Defined
Specifies an alternate name for the corresponding wavelength image. This name will also be used
by such commands as Configure Experiment and Image Display Controls.
Illumination Device
Selects the Illumination Device to use for the specified wavelength image. The Illumination device is defined
in the Configure Illumination dialog box. Use the Configure Illumination dialog box to specify the
wavelength, intensity, and shutter settings for each wavelength.
Z Position (Set Z Postion for this Wavelength to)
Specifies the Z position setting to be associated with the current wavelength. Use this setting if spectral
characteristics of the optics dictate the use of a different focal plane for the selected wavelength, and/or
when using automated filter cube changers when non-par-focal.
Camera Binning and Sub-Region
Use the following settings to specifiy the area of the image to which you want to assign binning and the
binning value.
Left
Specifies the leftmost point of the region.
Top
Specifies the topmost point of the region.
Width
Specifies the width of the region.
Height
Specifies the height of the region.
Binning
Specifies the number of pixels in the horizontal and vertical direction for binning. For example, if
you select 2, a 2 x 2 pixel binning will be used during image acquisition. This will speed up
acquisition by a factor of four, and will reduce the amount of memory used by 75%, but image
resolution also will be reduced by a similar amount.
Note: If you have already acquired reference (background subtraction or shading
correction) images and then change the binning, MetaFluor will check for mismatches
between the binning setting of the reference and data images. If a mismatch is
detected, any mismatched reference images will be discarded, and a message box
will be displayed that informs you of this.
MetaFluor
107
Version 7.0
MetaFluor User’s Guide
Image Size
This status line will display the size of the acquired images, taking the acquisition region's width
and height and the binning into account.
Select Region
Allows you to specify the region used for acquisition. The acquisition region will be defined
proprotionally such that, if you change the size of the overall image (for example by changing
binning), the region will remain the same relative size and in the same relative location on the
image.
Use Entire Image
Defines the acquisition region as the entire image.
Note: If you have already acquired reference (background subtraction or shading
correction) images and then change the size of the acquisition region, MetaFluor will
detect mismatches between the sizes of the reference and data images. Any
mismatched reference images will be discarded, and a message box will be displayed
that informs you of this.
Digital Camera Acquisition Parameters
Use the settings in this box to specify the settings that will be used by your digital camera.
Exposure Time
Specifies the length of time for each acquisition. When Allow Items to Differ for Each Wavelength is
selected, you can set separate exposure times for each wavelength.
Gain
If your camera supports this feature, this option sets the gain. When Allow Items to Differ for Each
Wavelength is selected, you can set separate settings for each wavelength image.
Bit Depth
If your camera supports this feature, this option sets the bit-depth. When Allow Items to Differ for
Each Wavelength is selected, you can set separate settings for each wavelength image.
Transfer Speed
If your camera supports this feature, this option specifies the camera's speed. When Allow Items to
Differ for Each Wavelength is selected, you can set separate settings for each wavelength image.
Camera Shutter
Selects a state for the shutter: Open for Expose, Always Open, or Always Closed. When Allow
Items to Differ for Each Wavelength is selected, you can set separate settings for each wavelength
image.
Intensifier Gain
Optionally set this gain value for digital cameras that contain and support this feature such as the
Roper Scientific Photometrics Cascade camera. You can set this as a different value for each
separate wavelength.
Allow items to differ for each wavelength
When this option is selected, you can configure different settings for the acquisition region,
Exposure Time, Gain, Bit Depth, Transfer Speed, and Camera Shutter for each wavelength image.
Close
Closes the dialog box.
MetaFluor
108
Version 7.0
MetaFluor User’s Guide
Configuring Acquisition for Video Cameras
To configure acquisition parameters for video cameras, use the following procedure:
Step
Action
1
From the Configure menu, choose Configure
Acquisition. The Configure Acquisition dialog
box will appear.
2
Select Wavelength 1 from the Wavelength to
Configure list.
3
If you want to rename the image window,
select Custom Defined from the Wavelength
Name option button group and type the new
name in the accompanying text box.
4
Select the desired MetaDevice from the
Illumination MetaDevice drop-down list.
5
If you need to specify a Z position to be
associated with this wavelength, click Set Z
position for this wavelength to and type the
specific Z position in the box. For information
about setting the Z position, see the help for
the Z Position Control dialog box.
6
If you want to use an acquisition subregion,
use the Left, Top, Width, and Height spin
boxes in the Camera Binning and Sub-Region
group to select the region's starting (upper left)
X and Y coordinate, width, and height,
respectively. Alternatively, you can choose
Select Region. This will display a restrictedmode image window that contains a region
with draggable borders. After you configure
the region, choose OK from the Select Region
dialog box that also appeared.
OR
If you want to use the entire camera chip for
acquisition, choose Use Entire Image from the
Configure Acquisition dialog box.
7
If your camera supports frame averaging, use
the Frames to Average spin box to select the
number of frames to be averaged for each
image.
OR
If you selected the Sum Frames Instead of
Averaging Frames check box in the Video
Camera Preferences dialog box before starting
the experiment, use the Frames to Sum spin
box to select the number of frames to be
summed for each image.
OR
If you are using an integrating camera, use the
Frames to Integrate spin box to select the
number of frames to be integrated on-chip for
each image.
MetaFluor
109
Version 7.0
MetaFluor User’s Guide
8
From the Video Channel drop-down list, select
the video channel to which your camera is
connected.
9
Select the next wavelength from the
Wavelength to Configure list. Repeat Steps
3 - 9 for each wavelength, as needed.
10
Choose Close when you have finished.
MetaFluor
110
Version 7.0
MetaFluor User’s Guide
Configure Acquisition - Dialog Box Options (Video
Camera)
Wavelength to Configure
Specifies the wavelength image that you are configuring for acquisition. Each wavelength image can have
separate acquisition settings.
Wavelength Name
Enables you to assign a custom name to each wavelength that you will use.
Use Selected Wavelength as Name
Accepts the "Wavelength X" entry as the name to use for the wavelength image name. This name
will also be used by such commands as Configure Experiment and Image Display Controls.
Custom Defined
Specifies an alternate name for the corresponding wavelength image. This name will also be used
by such commands as Configure Experiment and Image Display Controls.
Illumination Device
Selects the Illumination Device to use for the specified wavelength image. The Illumination device is defined
in the Configure Illumination dialog box. Use the Configure Illumination dialog box to specify the
wavelength, intensity, and shutter settings for each wavelength.
Z Position (Set Z Position for this Wavelength to)
Specifies the Z position setting to be associated with the current wavelength. Use this setting if spectral
characteristics of the optics dictate the use of a different focal plane for the selected wavelength, and/or
when using automated filter cube changers when non-par-focal.
Camera Acquisition Region
Specifies the location and dimensions of the acquisition region.
Left
Specifies the leftmost point of the acquisition region.
Top
Specifies the topmost point of the acquisition region.
Width
Specifies the width of the acquisition region.
Height
Specifies the height of the acquisition region.
Select Region
Allows you to specify the region used for acquisition.
Use Entire Image
Defines the acquisition region as the entire image. Note: If you have already acquired reference
(background subtraction or shading correction) images and then change the size of the acquisition
region, MetaFluor will detect mismatches between the sizes of the reference and data images. Any
mismatched reference images will be discarded, and a message box will be displayed that informs
you of this.
Frames to Average
Specifies the number of frames to be averaged for each image during acquisition.
MetaFluor
111
Version 7.0
MetaFluor User’s Guide
Frames to Sum
Specifies the number of frames to be summed together (in software) for each image during acquisition.
Frames to Integrate
Selects the number of video frames to be integrated on-chip. This option will appear dimmed unless you
have an integrating camera and configured the appropriate settings with the Video Driver Manager program.
Video Channel
Specifies the video channel to use for the acquisition.
Allow Items to Differ for Each Wavelength
When this option is selected, you can configure different acquisition settings for each wavelength image.
Close
Closes the dialog box.
MetaFluor
112
Version 7.0
MetaFluor User’s Guide
Selecting a Region for Acquisition
To select the region for acquisition, use the following procedure:
Step
Action
1
After you have chosen Select Region from the
Configure Acquisition dialog box, MetaFluor
will close all windows and dialog boxes
temporarily. It will open the Select Region
dialog box and an image window with a region
drawn on it.
2
Choose Update Image if you want to update
the image window to display the most current
image which will assist you in defining the
region accurately.
3
If you have created regions of interest and
want to use the distribution of the regions to
define the acquisition region, select the Show
Measurement Regions check box. Then
choose Area of Chip Enclosing All
Measurement Regions. The region outlines
will be displayed in red, and a yellow region
will be displayed which encloses all defined
regions.
OR
If you want to acquire the entire image area,
choose Full Chip from the Select Region
dialog box.
4
Adjust the acquisition region as desired, by
dragging the region outline in the image
window to define the desired size and position
for acquisition. (The region's position and size
will be displayed in the Select Region dialog
box's Pos and Size status fields, respectively.)
5
After you have finished editing or defining
regions, choose OK. MetaFluor will restore the
image windows and dialog boxes that were
previously open.
MetaFluor
113
Version 7.0
MetaFluor User’s Guide
Select Region - Dialog Box Options
Update Image
Acquires an image for display in the acquisition region configuration image window.
Full Chip
Creates an acquisition region that is the size of the entire chip and shrinks or enlarges
the acquisition region by a factor of two.
Note: If you have already acquired reference (background subtraction or shading
correction) images and then change the size of the acquisition region, MetaFluor will
detect mismatches between the sizes of the reference and data images. Any mismatched
reference images will be discarded, and a message box will be displayed that informs
you of this.
Center
Centers the acquisition region on the chip.
Area of Chip Enclosing All Measurement Regions
Creates an acquisition region that encloses all currently defined regions of interest. The
outline of the acquisition region can be adjusted by dragging its borders.
Show Measurement Regions
Displays any currently defined regions of interest in the acquisition region configuration
image window.
Pos
Displays the X and Y coordinate of the upper left corner of the acquisition region.
Size
Displays the X and Y dimensions of the acquisition region
OK
Accepts the current configuration of the acquisition region and closes the dialog box.
Cancel
Rejects any changes made to the configuration of the acquisition region and closes the
dialog box.
MetaFluor
114
Version 7.0
MetaFluor User’s Guide
Configure Experiment (Configure Menu)
Enables/disables image acquisition and display for each image and configures the
frequency of acquisition and display. Specifies the data to be logged for each
defined region of interest.
Use this command to enable or disable acquisition or display of each image. You can
configure each image window separately by selecting or clearing the individual check boxes.
Alternatively, you can simultaneously switch off acquisition, display, saving, and data logging
for an image by choosing the On/Off button for that image. Although you may not use this
command often, the ability to switch acquisition and display on or off gives you the flexibility to
conduct Delta F/F experiments or those that require short acquisition times.
You can specify the frequency of image acquisition and display from the Configure Experiment
dialog box. For example, if you set the acquisition frequency for Wavelength 1 to 5,
Wavelength 1 would be acquired only once every five cycles. For the intermediate cycles,
MetaFluor would use the last Wavelength 1 image that was still stored in memory.
Note: The Acquire check box and the Acquire Interval check box are available only in
acquisition mode, and will not be displayed in playback mode.
If you are using an external video monitor, you can display the Wavelength 1, Wavelength 2,
Wavelength 3, and Ratio images simultaneously during acquisition using a quadrant display
(as if they were in separate image windows). For faster acquisition, you can choose to display
just one image on the monitor, rather than using the quadrant display.
You can also set different frequencies for saving each type of wavelength or ratio image. For
example, you can set the interval for saving Wavelength 1, 2, and 3 images to five acquisition
cycles. When you enable image saving in the Experiment Control Panel, MetaFluor will save a
set of wavelength images to disk on every fifth acquisition cycle. If you set a saving interval
other than 1, the status text next to Save Images and/or Save Ratios in the Experiment
Control Panel will list the interval. If you want to adjust the saving frequency while running an
experiment, just leave the Configure Experiment dialog box open while using the Experiment
Control Panel. You can set an interval of 0, in which case that image will not be saved. For
example, if you are running a single-wavelength experiment, you could set the Save Interval to
0 for Wavelengths 2 through 5, and set the Save Interval for Wavelength 1 to 1. In this
configuration, when you save images, you will save only the first wavelength image. This will
reduce the amount of disk space you will need to store the experiment.
Note: This command does not initiate image saving; it merely enables it. To save images, you
must also use the Open Save Images File or Open Save Ratios command and select the
Save Images or Save Ratios check box in the Experiment Control Panel.
This command also specifies the data to be logged for each region. You can select the data to
be logged individually for each image. For wavelength images, you can enable or disable
logging of the average intensity, integrated intensity (i.e., the sum of the grayscale values for
all pixels), and the area of the thresholded portion of each region of interest. For ratio images,
you can enable or disable logging of ratio values. If you have calibrated an image series, you
can enable logging of the calibrated data.
MetaFluor
115
Version 7.0
MetaFluor User’s Guide
Note: This command does not enable data logging. You must still open a measurements file
by using the Open Measurements File command and enable data logging by using the
Experiment Control Panel.
See Also:
Experiment Control Panel:
For Video Camera with External Monitor
For Video Camera with Computer's Monitor
For Digital Camera
For Playback
Open Save Images File
Open Save Ratios File
Open Measurements File
MetaFluor
116
Version 7.0
MetaFluor User’s Guide
Configuring Acquisition, Display, Saving, and
Data Logging for an Experiment
To configure acquisition, display, saving, and data logging for an experiment, use the
following procedure:
Step
Action
1
From the Configure menu, choose Configure
Experiment. The Configure Experiment dialog
box will appear.
2
If you are playing back a stored experiment,
skip to Step 5.
OR
If you are acquiring images in a new
experiment, continue to Step 3.
3
To enable image acquisition for Wavelength 1,
select the Acquire? check box in the first row.
AND
Select an acquisition frequency from the
Acquire Interval spin box in the first row. For
example, to specify acquisition on every cycle,
select 1. Likewise, select 5 to specify
acquisition of this image once every five
cycles.
4
From the Save Interval spin box, select a
saving interval. For example, to save the
image once every five acquisition cycles,
select 5. You can also set an interval of 0, in
which case the image will not be saved.
5
To enable display of the image, select the
Show? check box.
AND
Select the Update? check box to allow the
image to be refreshed with updated images.
Then select an updating interval from the
Update Interval spin box.
6
Repeat Steps 4 and 5 (or Steps 3 - 5 if you are
acquiring new images) for each wavelength
and ratio image, selecting or clearing the
pertinent check boxes and selecting the
appropriate frequencies of acquisition, saving,
and updating.
Note: To disable all options for a particular
wavelength or ratio image, choose the
pertinent On/Off button. The Acquire check
box for that image will be cleared and all other
options will be disabled and will become
unavailable. To reenable use of an image,
choose the On/Off button again. The options
will become available once again.
7
From the Data Logging columns, select the
MetaFluor
117
Version 7.0
MetaFluor User’s Guide
types of region data you want to log.
For wavelength images, you can enable
logging of the average intensity value (Avg),
the integrated intensity (Sum), and/or the area
of the thresholded portion of the region (Area).
For ratio images, you can enable logging of
the average Ratio value.
8
If you have already performed a calibration,
you can enable logging of the calibrated data
by choosing the On/Off button for the
Calibrated image to enable the Calibrated
Value check box, or by directly selecting the
Calibrated Value check box.
Note: The most recently calibrated image (as
performed with the Acquire Calibration
Standards command) will be the one
measured and analyzed. The calibrated image
will be indicated in the accompanying status
text for the Calibrated image.
9
When you have finished, choose OK to close
the dialog box.
Note: If you plan to change the acquisition
frequency or saving intervals, you may wish to
leave this dialog box open.
MetaFluor
118
Version 7.0
MetaFluor User’s Guide
Configure Experiment - Dialog Box Options
On/Off
Enables or Disables all options for the associated wavelength or ratio image. When
turned off, the Acquire check box for that image will be cleared and all other options will
be disabled and made unavailable. To reenable use of the image, click the On/Off button
again.
Acquire?
Configures MetaFluor to acquire the associated wavelength image at the interval
specified by the Acquire Interval spin box. This option appears only in acquisition mode,
and will not be displayed in playback mode.
Acquire Interval
Selects an acquisition interval for the associated wavelength image. For example, to
specify acquisition on every cycle, select 1. Likewise, select 5 to specify acquisition of
this image once every five cycles. This option appears only in acquisition mode, and will
not be displayed in playback mode.
Avg
When data logging has been enabled, this check box prompts MetaFluor to save the
average grayscale value for all pixels in each region of interest that has been defined.
Sum
When data logging has been enabled, this check box prompts MetaFluor to save the
integrated grayscale value for each region of interest (i.e., the sum of the grayscale
values for every pixel in the region).
Area
When data logging has been enabled, this check box prompts MetaFluor to save the area
of the thresholded portion of each region of interest that has been defined.
Ratio
When data logging has been enabled, this check box prompts MetaFluor to save the
average ratio value for all pixels in each region of interest that has been defined.
Save Interval
Selects a saving interval for the associated wavelength or ratio image. For example, to
save the image once every five acquisition cycles, select 5. You can also set an interval
of 0, in which case the image will not be saved.
Show?
Configures MetaFluor to display the image or the image window.
Update?
Configures MetaFluor to update (refresh) the image at the interval specified by the
Update Interval spin box.
Update Interval
MetaFluor
119
Version 7.0
MetaFluor User’s Guide
Selects an image updating interval for the associated wavelength or ratio image. For
example, to update the image once every five acquisition, select 5. To update the image
on every acquisition cycle, select 1.
Calibrated Value
When data logging has been enabled, this check box prompts MetaFluor to save the
average calibrated value (i.e., in user units, such as nM) for all pixels in each region in
the currently calibrated image, as performed with the Acquire Calibration Standards
command. The currently calibrated image will be indicated in the accompanying status
text.
OK
Applies the new configuration settings and closes the dialog box.
Cancel
Disregards the new configuration settings and closes the dialog box.
MetaFluor
120
Version 7.0
MetaFluor User’s Guide
Configure Ratios/FRET
Configure Ratios configures names for the ratio images and selects the wavelength
images to be ratioed.
FRET performs background and bleed through correction to Fluorescence Resonance
Energy Transfer (FRET) image sets.
Use the Configure Ratios command to assign the numerator and denominator wavelength images
(Wavelength 1 / Wavelength 2 vs. Wavelength 4 / Wavelength 5) and a name to each of the ratio
images. If you are using an external video monitor, only one ratio image will be available for
configuration and display.
Note: The wavelength images are configured and named from the Configure Acquisition
dialog box.
Use the FRET command to correct FRET image sets. The FRET technique involves observing the
energy transfer between an excited donor fluorophore and a nearby acceptor fluorophore. This energy
transfer is dependent on the overlap of excitation spectrum of the acceptor with the emission spectrum of
the donor, as well as the distance between the fluorophores. Energy transfers can only occur when a
donor and acceptor are very close together (within nanometers) and their spectra sufficiently overlap.
Due to the overlap in spectra of the donor and acceptor, bleed through between observed wavelength
channels (filter sets) influence FRET observations.
Use this command to correct FRET image sets. The FRET command will correct for background and
bleed through between fluorophore filter sets using either of the following methods:
•
Fully Sensitized Emission — use this method, with or without background subtraction, if you
measured the bleed through of the acceptor signal and donor signal through the FRET filter set
when you acquired the FRET images.
•
Specified Bleed Through — use this method, with or without background subtraction, if you
calibrated your system for fully specified bleed through correction; that is, you measured all
possible contaminators into the FRET channel.
The following is an overview of the steps used to create a corrected FRET image in MetaFluor:
1.
Acquire images of the donor, FRET, and acceptor using an appropriate filter set for each image.
2.
Designate the source wavelength in the Configure Ratios/FRET dialog box.
3.
Determine the FRET correction method to use — Fully Sensitized Emission or Specified Bleed
Through.
4.
Enter the correction constants and select the background subtraction method to be used when
creating the corrected image(s).
5.
Create the corrected image(s).
See Also:
Configure Ratios/FRET Procedures
Configure Acquisition
MetaFluor
121
Version 7.0
MetaFluor User’s Guide
Determining FRET Coefficients
Both the Sensitized Emission and Fully Specified Bleed through methods for correcting FRET require
calibration procedures. These calibrations provide the coefficients (or constants) for correcting the
acquired FRET images. Perform these calibrations for each wavelength filter set used for FRET
experiments. After the coefficients values are determined for each filter set, they can be used in
subsequent FRET experiments.
Calibrations for both methods require controls which contain only donor fluorophore (a Donor-only
control) and only acceptor fluorophore (an Acceptor-only control). These samples are used to determine
bleed through between filter configurations.
Determining FRET Coefficients for Sensitized Emission
Determining FRET Coefficients for Fully Specified Bleed Through Correction
MetaFluor
122
Version 7.0
MetaFluor User’s Guide
Determining FRET Coefficients - Sensitized
Emission
To use the Sensitized Emission method to correct FRET image sets, you must determine values for
coefficients A and B.
Coefficient A represents the degree to which the Acceptor signal is contaminating observations made in
the FRET channel. This value is determined by dividing the average thresholded intensity of the image
obtained using the FRET filter configuration by the average thresholded intensity of the image obtained
using the Acceptor filter configuration:
Coefficient B represents the degree to which the Donor signal is contaminating observations made in the
FRET channel. This value is determined by dividing the average thresholded intensity of the image
obtained using the FRET filter configuration by the average thresholded intensity of the image obtained
using the Donor filter configuration:
To determine the coefficient A for Sensitized Emission, complete the following procedure:
Note: This procedure assumes you have collected sample donor, FRET, and acceptor images
using the appropriate filter set for each image.
Step
1
Action
Use the Threshold Tool and Slider to
threshold the Acceptor images acquired from
both the FRET and Acceptor filter sets.
Note: You must threshold the
images to include as much signal as
possible in the threshold. The only
areas of the images that should not
be thresholded are areas that are
clearly background. Failure to
threshold all the signal will result in
an incorrect coefficient.
2
Use the Spot Measurement command to
determine the average thresholded intensity
of both Acceptor images.
3
Divide the average thresholded intensity of
the image obtained using the FRET filter set
by the average thresholded intensity of the
image obtained using the Acceptor filter set.
MetaFluor
123
Version 7.0
MetaFluor User’s Guide
The result of this division is coefficient A.
To determine the coefficient B for Sensitized Emission, complete the following procedure:
Step
1
Action
Use the Threshold Tool and Slider to
threshold the Donor images acquired from
both the FRET and Donor filter sets.
Note: You must threshold the
images to include as much signal as
possible in the threshold. The only
areas of the images that should not
be thresholded are areas that are
clearly background. Failure to
threshold all the signal will result in
an incorrect coefficient.
2
Use the Spot Measurement command to
determine the average thresholded intensity
of both Acceptor images.
3
Divide the average thresholded intensity of
the image obtained using the FRET filter set
by the average thresholded intensity of the
image obtained using the Donor filter set.
The result of this division is coefficient B.
MetaFluor
124
Version 7.0
MetaFluor User’s Guide
Determining FRET Coefficients - Fully Specified
Bleed Though
To use the Fully Specified Bleed Through method to correct FRET image sets, you must determine
values for some or all of the following coefficients:
Donor in Acceptor
Acceptor in Donor (if applicable)
Donor in FRET
Acceptor in FRET (if applicable)
MetaFluor
125
Version 7.0
MetaFluor User’s Guide
Determining FRET Coefficients - Donor in
Acceptor
The Donor in Acceptor coefficient represents the degree to which signal from the Donor filter set is
bleeding into observations made using the Acceptor filter set. This value is determined by dividing the
average thresholded intensity of the Acceptor-only image obtained using the Donor filter set by the
average thresholded intensity of the Acceptor-only image obtained using the Acceptor filter set:
To determine the Donor in Acceptor coefficient for Specified Bleed Through, complete the
following procedure:
Note: This procedure assumes you have collected sample donor, FRET, and acceptor images using the
appropriate filter set for each image.
Step
1
Action
Use the Threshold Tool and Slider to
threshold the Acceptor images acquired from
both the Donor and Acceptor filter sets.
Note: You must threshold the
images to include as much signal as
possible in the threshold. The only
areas of the images that should not
be thresholded are areas that are
clearly background. Failure to
threshold all the signal will result in
an incorrect coefficient.
2
Use the Spot Measurement command to
determine the average thresholded intensity
of both Acceptor images.
3
Divide the average thresholded intensity of
the image obtained using the Donor filter set
by the average thresholded intensity of the
image obtained using the Acceptor filter set.
The result of this division is the Donor in
Acceptor coefficient.
MetaFluor
126
Version 7.0
MetaFluor User’s Guide
Determining FRET Coefficients - Acceptor in
Donor
The Acceptor in Donor coefficient represents the degree to which signal from the Acceptor filter set is
bleeding into observations made using the Donor filter set. This value is determined by dividing the
average thresholded intensity of the Donor-only image obtained using the Acceptor filter set by the
average thresholded intensity of the Donor -only image obtained using the Donor filter set:
To determine the Acceptor in Donor coefficient for Specified Bleed Through, complete the
following procedure:
Note: This procedure assumes you have collected sample donor, FRET, and acceptor images using the
appropriate filter set for each image.
Step
1
Action
Use the Threshold Tool and Slider to
threshold the Donor images acquired from
both the Acceptor and Donor filter sets.
Note: You must threshold the
images to include as much
signal as possible in the
threshold. The only areas of the
images that should not be
thresholded are areas that are
clearly background. Failure to
threshold all the signal will
result in an incorrect coefficient.
2
Use the Spot Measurement command to
determine the average thresholded intensity
of both Acceptor images.
3
Divide the average thresholded intensity of
the image obtained using the Acceptor filter
set by the average thresholded intensity of
the image obtained using the Donor filter set.
The result of this division is the Acceptor in
Donor coefficient.
MetaFluor
127
Version 7.0
MetaFluor User’s Guide
Determining FRET Coefficients - Donor in FRET
The Donor in FRET coefficient represents the degree to which signal from the Donor filter set is bleeding
into observations made using the FRET filter set. This value is determined by dividing the average
thresholded intensity of the Donor-only image obtained using the FRET filter set by the average
thresholded intensity of the Donor -only image obtained using the Donor filter set:
To determine the Donor in FRET coefficient for Specified Bleed Through, complete the following
procedure:
Note: This procedure assumes you have collected sample donor, FRET, and acceptor images using the
appropriate filter set for each image.
Step
1
Action
Use the Threshold Tool and Slider to
threshold the Donor images acquired from
both the FRET and Donor filter sets.
Note: You must threshold the
images to include as much
signal as possible in the
threshold. The only areas of the
images that should not be
thresholded are areas that are
clearly background. Failure to
threshold all the signal will
result in an incorrect coefficient.
2
Use the Spot Measurement command to
determine the average thresholded intensity
of both Acceptor images.
3
Divide the average thresholded intensity of
the image obtained using the FRET filter set
by the average thresholded intensity of the
image obtained using the Donor filter set.
The result of this division is the Donor in
FRET coefficient.
MetaFluor
128
Version 7.0
MetaFluor User’s Guide
Determining FRET Coefficients - Acceptor in
FRET
The Acceptor in FRET coefficient represents the degree to which signal from the Acceptor filter set is
bleeding into observations made using the FRET filter set. This value is determined by dividing the
average thresholded intensity of the Acceptor-only image obtained using the FRET filter set by the
average thresholded intensity of the Acceptor -only image obtained using the Acceptor filter set:
To determine the Acceptor in FRET coefficient for Specified Bleed Through, complete the
following procedure:
Note: This procedure assumes you have collected sample donor, FRET, and acceptor images using the
appropriate filter set for each image.
Step
1
Action
Use the Threshold Tool and Slider to
threshold the Acceptor images acquired from
both the FRET and Acceptor filter sets.
Note: You must threshold the
images to include as much
signal as possible in the
threshold. The only areas of the
images that should not be
thresholded are areas that are
clearly background. Failure to
threshold all the signal will
result in an incorrect coefficient.
2
Use the Spot Measurement command to
determine the average thresholded intensity
of both Acceptor images.
3
Divide the average thresholded intensity of
the image obtained using the FRET filter set
by the average thresholded intensity of the
image obtained using the Acceptor filter set.
The result of this division is the Acceptor in
FRET coefficient.
MetaFluor
129
Version 7.0
MetaFluor User’s Guide
Using FRET to Correct Images - Sensitized
Emission
To correct a FRET image using the Sensitized Emission method, complete the following
procedure:
Step
Action
1
From the Configure menu, choose Configure
Ratios/FRET. The Configure Ratios dialog
box will appear.
2
Select FRET from the Image and data
calculations field.
3
Select Sensitized Emission from the FRET
Method field.
4
Select the desired donor, acceptor, and raw
FRET images using the Donor, Acceptor,
and Raw FRET image selectors
5
Enter values for Constant A and Constant B.
6
Select the desired FRET result from the
FRET result field.
7
Click OK to create a correct FRET image
using the settings you entered.
OR
Click Cancel to exit the FRET dialog box
without creating a corrected image.
MetaFluor
130
Version 7.0
MetaFluor User’s Guide
Using FRET to Correct Images - Specified Bleed
Through
To correct a FRET image using the Specified Bleed Through method, complete the following
procedure:
Step
Action
1
From the Configure menu, choose Configure
Ratios/FRET. The Configure Ratios dialog
box will appear.
2
Select FRET from the Image and data
calculations field.
3
Select Specified Bleed Through from the
FRET Method field.
4
If you have a donor image but no acceptor
image, select Donor Only from the FRET
Method field.
OR
If you have both a donor and an acceptor
image, select Donor and Acceptor from the
FRET Method field.
5
Select the desired donor, acceptor (if
applicable), and raw FRET wavelengths
using the Donor, Acceptor, and Raw FRET
image selectors.
6
Enter bleed through coefficient values for the
following fields:
•
Donor in Acceptor
•
Acceptor in Donor (if applicable)
•
Donor in FRET
•
Acceptor in FRET (if applicable)
7
Select the desired FRET result from the
FRET result field.
8
Click OK to create a correct FRET image
using the settings you entered.
OR
Click Cancel to exit the FRET dialog box
without creating a corrected image.
MetaFluor
131
Version 7.0
MetaFluor User’s Guide
Configuring Ratios
To configure ratios, use the following procedure:
Step
Action
1
From the Configure menu, choose Configure
Ratios/FRET. The Configure Ratios dialog box
will appear.
2
Select Ratio from the Image and data
calculations field.
3
From the Ratios to Configure list, select the
ratio you want to assign:
Ratio 1 will configure the Wavelength 1 /
Wavelength 2 ratio (this will be the only ratio
available if you are using an external video
monitor), and
Ratio 2 will configure the Wavelength 4 /
Wavelength 5 ratio.
4
If needed, type a new name for the ratio image
in the Ratio Name text box.
5
Repeat Steps 3 and 4 as necessary for the
second ratio image.
6
When you have finished, click OK.
MetaFluor
132
Version 7.0
MetaFluor User’s Guide
Configure Ratios/FRET - Dialog Box Options
Image and data calculations
Selects which calculation to perform — select either a ratio or FRET calculation.
Ratio to Configure
Selects the ratio (Ratio 1 or Ratio 2) to be configured.
Ratio Name
Assigns a name to the ratio image associated with the ratio selected from the Ratio to
Configure list. The default names are Ratio and Ratio 2.
Ratio Calculation
This status text displays the equation for the ratio selected from the Ratio to Configure
list, indicating which wavelength image will be the numerator and which will be the
denominator. This field is only available when Ratio is selected in the Image and data
calculation field.
FRET Method
Sensitized Emission
Uses a simplified formation of the fully specified bleed through correction method. It corrects for
bleed through from the donor and acceptor into the FRET channel.
Specified Bleed Through
Use this method if you calibrated your system for fully specified bleed through correction; that is,
you measured all possible contaminators into the FRET channel.
Donor Only
Enables you to select the Donor and Raw FRET source images or stacks. This option is
only available if Specified Bleed Through is selected in the Source field.
Donor and Acceptor
Enables you to select the Donor, Acceptor, and Raw FRET source images or
stacks. This option is only available if Specified Bleed Through is selected in the
Source field.
Donor
Selects the Donor image.
Acceptor
Selects the Acceptor image.
Raw FRET
Selects the raw FRET image.
Constant A
Enables you to select the value of Coefficient A. This option is only enabled when
Sensitized emission is selected in the FRET method field.
Constant B
Enables you to select the value of Coefficient B. This option is only enabled when
Sensitized emission is selected in the FRET method field.
MetaFluor
133
Version 7.0
MetaFluor User’s Guide
Donor in Acceptor
Selects the bleed through coefficient of the donor wavelength through the acceptor filter
set.
Acceptor in Donor
Selects the bleed through coefficient of the acceptor wavelength through the donor filter
set. This option is only enabled if Donor and Acceptor is selected in the FRET Method
field.
Donor in FRET
Selects the bleed through coefficient of the donor signal in the raw FRET image.
Acceptor in FRET
Selects the bleed through coefficient of the acceptor signal in the raw FRET image. This
option is only enabled if Donor and Acceptor is selected in the FRET Method field.
FRET result
Corrected FRET intensity
Resulting image contains the corrected FRET intensity.
Ratio of corrected FRET to Donor
Resulting image contains ratio of corrected FRET to donor.
OK
Applies the new ratio image configuration or FRET settings and closes the dialog box.
Cancel
Cancels the command and closes the dialog box.
MetaFluor
134
Version 7.0
MetaFluor User’s Guide
Z Position Control (Configure Menu)
Adjusts the Z position (focus) of the objective using the selected Z-motor and provides
access to the Z motor calibrations and speed setting.
Use this command to manually control the Z-motor to focus the microscope and to specify the Z-motor
settings needed to enable efficient auto focusing of the microscope. The Z Position Control enables you
to select the Z-motor that you want to use to focus, change the Z-motor position, set the Z origin, move
the objective to the Z origin, specify the step increment size, define a custom Z step increment, calibrate
the Z motor, and set the Z motor speed.
MetaFluor
135
Version 7.0
MetaFluor User’s Guide
Controlling Z Position
To set and/or control your Z position settings, complete the following procedure.
Step
Action
1
From the Configure menu, click Z Position
Control the Z Position Control dialog box
opens.
2
In the Z Motor MetaDevice box, select the Zmotor that you want to use.
3
Click Calibrate Motor. The Z-Axis
Calibration dialog box opens. Complete the
steps to calibrate your Z motor, then return
to this dialog box.
4
Click Set Motor Speed. The Set Motor
Speed dialog box opens. Move the slider
control to set the Z motor speed (if
applicable), then click Close to return to this
dialog box.
5
Open the Z Step Increment drop-down box,
select the Z step increment that you want to
use, or select Custom and type the
increment value in the adjacent box. The
increment value you specify appears on the
Z position control arrow buttons.
6
Click Poll Z Position to instruct MetaFluor to
obtain Z position information from the Zmotor controller.
7
Click Enable Z Move for each wavelength to
allow each wavelength to have a separate Z
position.
8
Click the Up or Down arrows to manually
move the Z position by the step increment
displayed on the arrow button. Changing the
Z Step Increment value changes the value
shown on these buttons.
9
Click Set Origin to set the Z origin to the
currently displayed Z position in the Z box.
After you click Set Origin, the Z box will
indicate zero.
10
Click Goto 0 to move the Z-motor to the
origin (zero) position.
11
Click Close to close the Z Position control
dialog box.
MetaFluor
136
Version 7.0
MetaFluor User’s Guide
Z Position Control - Dialog box options
Z Motor
Indicates the name of the selected Z motor and the user-assigned unit of measure in parentheses.
Z:
Indicates the current Z position in the user-specified unit of measure.
Set Origin
Sets the current Z position to the origin (zero) position.
Less<<
Minimizes the dialog box to show only the essential controls for manually controlling the Z position (focus),
setting the Z origin, and moving the Z position directly to the zero position.
More>>
Expands the dialog box to make available controls for selecting the Z-Motor, specifying the Z Step
Increment, requesting the command to Poll the Z Position, enabling Z movement for each wavelength,
calibrating the Z-motor, and setting the Z-motor speed.
(Up Arrow)
Moves the Z position up by one Z Step Increment for each button click.
Goto 0
Returns the Z-motor position to the zero (origin) position.
(Down Arrow)
Moves the Z position down by one Z Step Increment for each button click.
Close
Closes the Z Position Control dialog box.
Poll Z Position
Request the command to obtain the Z Position information from the Z motor.
Enable Z Move for each wavelength
Enables each wavelength to have a different Z position.
Z Motor MetaDevice
Specifies the Z-motor metadevice that you are using.
Z Step Increment
Specifies the size of the Z Step Increment. Select .1, .5, 1.0, 5.0, 10.0, or custom to specify a custom value
in the adjacent box.
Calibrate Motor
Opens the Calibrate Motor dialog box.
Set Motor Speed
Opens the Set Motor Speed dialog box if your Z motor provides variable speed settings. After the Set Motor
Speed dialog box opens, move the slider control to change the motor speed.
Note: If your Z motor is not variable speed, the Set Motor Speed button will be inactive.
MetaFluor
137
Version 7.0
MetaFluor User’s Guide
Z-Axis Calibration
Specifies the formula for converting device units to your choice for user-units and
calibrating the Z motor control to the selected user unit of measure.
Use this dialog box to specify the user unit of measure that you want to apply to the Z axis and the
calibration value that you want to apply to the Z motor. This dialog box indicates the device unit name
assigned to the Z motor device. You can specify your own unit name and designate an equivalency
value. In addition, you can specify an appropriate unit name that you want to display. For example, you
can designate microns as the unit name and specify that one micron equals four steps.
MetaFluor
138
Version 7.0
MetaFluor User’s Guide
Calibrating the Z-Axis
The following procedure assumes that you have established the origin (zero) position in the Z
position Control dialog box.
To calibrate the Z-axis position and specify the User Unit name and equivalency value, complete
the following procedure.
Step
Action
1
From the Z Position Control dialog box, click
Calibrate Motor. The Z-axis calibration
dialog box opens. The initial Z-axis position
and device units value should be set to zero.
2
Select the Step Count multiplier value that
you want to apply to the Z-axis position
value. The value will be displayed on both
the Z-axis control buttons.
3
Click the either the positive (F6) or negative
(F5) Z-Axis Control button to add the value
on the button to the Z-Axis position. The Zmotor will change position whenever the
Position value is changed.
4
Change the Step Count multiplier values to
obtain a new value to apply to the Position
value, then click the appropriate plus or
minus button to add the value displayed on
the button to the Position value.
5
When you have set the displayed Position
value to a value that you want to use for the
device unit value, click the Use button.
OR
Type the value that you want to use as the
Device Units value.
6
Type the Name that you want to use for the
user units name in the User Units Name box.
7
Type the User Units value that you want to
use in the User Units box.
8
Click Reset to reset the Z-axis position value
and the actual Z-motor position to zero.
9
Click OK to apply your settings and close the
dialog box
OR
Click Close to disregard the settings, and
close the dialog box.
MetaFluor
139
Version 7.0
MetaFluor User’s Guide
Z-Axis Calibration - Dialog Box Options
Units Conversion Equation
Enables you to specify the User Units and the User Unit name in conjunction with a specific Device Units
Name.
User Units
Specifies the user unit value to equate to the specified Device Unit value. This value can be a whole
number or a decimal.
User Units Name
Specifies the name of the unit of measure that you want to use. This value can be a whole number or a
decimal.
Device Units
Specifies the Device Unit value that is to be equated to the User Unit value.
Device Units Name
Indicates the Device Unit name as specified by the device driver.
Z Axis Control
Changes the Z-Axis (focus) position, and indicates the Z-axis position value for the current Z-axis position.
Reset
Resets the Position value to zero.
+<Value> (F6)
Adds the value displayed on the button to the position value. By changing the Step Count value and clicking
this button multiple times, you can obtain and set precise Z-axis position values.
Position
Indicates the current Z-axis position value.
<– Use
Applies the currently displayed position value as the Device Units value.
-<Value> (F5)
Subtracts the value displayed on the button from the position value. By changing the Step Count value and
clicking this button multiple times, you can obtain and set precise Z-axis position values.
Step Count
Select the decimal multiplier to apply to the Z-axis position value indicated as Position. When you select a
different multiplier, the value shown on the (F5) and (F6) buttons changes to reflect the selected value.
MetaFluor
140
Version 7.0
MetaFluor User’s Guide
Configure Dual View
Separates multiple wavelength images that have been acquired using an emission splitter
device and a single camera. Acquired images can be oriented either vertically or
horizontally, depending on the orientation of the image splitter, and are derived from two
separate wavelengths of the same sample projected onto a single camera chip.
Drop-in: DUALVIEW
Use this drop-in to separate and organize multiple wavelength images of a single sample
originally acquired as one image using a single camera. When the images are
separated, they can be overlaid and combined into a single image composed of each
individual wavelength assigned to a discrete representative color.
The advantage of using an image splitter is to enable you to simultaneously acquire two
or four images of the same sample at different wavelengths. Each image is identical to
the others and each can be acquired using a different emission filter. The images can
then have appropriate overlay colors assigned to make it easier to identify the separate
wavelengths.
Note: To use the Dual View command, you must first open the preferences dialog box on the
File menu, select the Dual View tab, and click A DualView Emission Splitter is installed. In the
Orientation box, you should also specify whether your emission splitter is oriented vertically or
horizontally.
MetaFluor
141
Version 7.0
MetaFluor User’s Guide
Configuring Dual View
To configure your dual view settings, complete the following procedure:
Step
Options
1
If you have not already done so, open the
preferences dialog box on the File menu,
select the Dual View tab, and click A
DualView Emission Splitter is installed. In
the Orientation box, you should also specify
whether your emission splitter is oriented
vertically or horizontally. This will enable
you to configure the Dual View command.
2
With a project open, choose Configure Dual
View from the Configure menu. The
Configure Dual View dialog box opens.
3
To change the size of the image acquisition
area for both wavelengths, click New Size.
The New Size dialog box opens.
4
In the New Size dialog box, type or select
the size of the image acquisition area that
you want to use. The size values that you
type will be applied to both wavelengths.
5
In the New Size dialog box, click OK to apply
the new size values and close the dialog
box. When the dialog box closes, the boxes
in the image windows that represent the
image acquisition areas will change to reflect
the changes that you made in the New Size
dialog box.
6
To change the locations of each acquisition
area for each wavelength, type or select the
appropriate X/Y coordinate values in the X
and Y boxes.
OR
You can interactively position the acquisition
areas using your mouse. Click and drag
each acquisition area until it is correctly
positioned.
7
Click the Locked check box to lock the
positions of both acquisition areas.
8
When you have finished making your
settings, click Closed.
MetaFluor
142
Version 7.0
MetaFluor User’s Guide
Configure Dual View - Dialog Box Options
Wavelength 1
Specifies the X/Y coordinates of the top and left edges of the frame for wavelength 1.
X
Specifies the X coordinate of the left edge of the frame for wavelength 1.
Y
Specifies the Y coordinate of the top edge of the frame for wavelength 1.
Wavelength 2
Specifies the X/Y coordinates of the top and left edges of the frame for wavelength 2.
X
Specifies the X coordinate of the left edge of the frame for wavelength 2.
Y
Specifies the Y coordinate of the top edge of the frame for wavelength 2.
(Image Windows)
Indicates the relative position of the acquisition areas for each wavelength within the defined area of the
camera chip. Click and drag each acquisition area box to interactively change the position of each box.
Image Size
Indicates the dimensions of the acquisition area for each wavelength. The acquisition area can be changed
using the New Size dialog box; however, this area will be the same size for both acquisition areas.
Camera Area
Indicates the dimensions of the total camera area. These values represent the total area of the camera
chip, and do not change when you change the size of the acquisition areas.
Locked
Locks or unlocks the acquisition area positions for both wavelengths.
New Size
Opens the New Size dialog box. Use the settings in this dialog box to specify the dimensions of the
acquisition area for each wavelength. Changing these values changes size of the acquisition area for both
wavelengths at the same time.
Close
Closes the Configure Dual View dialog box.
MetaFluor
143
Version 7.0
MetaFluor User’s Guide
Image Display Controls - Using the Computer's
Monitor (Configure Menu)
Sets the thresholds, display mode, digital contrast settings, ratio limits, and ratio
display for the experiment's images.
Use this command to set separate threshold levels and digital contrast settings for each
wavelength image. You can select either the Monochrome or Pseudocolor display mode
for the wavelength images. For the ratio images, you can select the minimum and maximum
ratio limits and the image display. You can use the Monochrome, Pseudocolor, or Intensity
Modulated Display (IMD) display mode for the ratio images.
CAUTION:
If you are acquiring 16-bit images and wish to adjust the contrast and brightness, you must
use the Scale 16-Bit Images command (Run Experiment menu) to do so. Because of the far
greater number of intensity levels in a 16-bit image, the effects of merely adjusting the contrast
settings from the Image Display Controls dialog box may have little visible effect on the image
display. In addition to adjusting image contrast and brightness, the Scale 16-Bit Images
command allows you to scale a selected range of 16-bit intensity levels to a 256-level intensity
display, thereby greatly increasing the effect of the contrast adjustments.
See Also:
Image Display Controls - Using an External Video Monitor
Scale 16-Bit Images
MetaFluor
144
Version 7.0
MetaFluor User’s Guide
Image Display Controls - Using an External Video
Monitor (Configure Menu)
Sets the thresholds, display mode, ratio limits, and ratio display for the
experiment's images.
Use this command to set separate threshold levels for each wavelength image. You can
select either the Monochrome or Pseudocolor display mode for the wavelength images.
For the ratio, you can select the minimum and maximum ratio limits and the display used for
the ratio. You can use the Monochrome, Pseudocolor, or Intensity Modulated Display (IMD)
mode for the ratio.
See Also:
Image Display Controls - Using the Computer's Monitor
MetaFluor
145
Version 7.0
MetaFluor User’s Guide
Setting the Image Display Controls for
Wavelength Images
To set the image display controls for wavelength images displayed on the computer's
monitor, use the following procedure. (Note: To adjust the contrast in the display of a 16bit image, you must use the Scale 16-Bit Images command.)
Step
Action
1
From the Configure menu, choose Image
Display Controls. The Image Display Controls
dialog box will appear.
2
From the Window list, select the wavelength
image for which you want to change the image
display settings.
3
Select the display mode you want to use for
this image from the Display list.
4
Adjust the Contrast slider to a value that
optimizes the appearance of the image.
The default value is 50 (unmodified contrast)
while maximum contrast is 100 (which
produces a binary image). Contrast can not be
decreased.
5
Adjust the Brightness slider to a value that is
suitable for the selected contrast.
The default value is 50. Minimum brightness is
0, while maximum brightness is 100.
Note: Adjust Brightness and Contrast together
until you have enhanced the image to suit your
viewing needs.
6
Use the Low Thresh and High Thresh sliders
to set a threshold range that excludes gray
levels containing areas/objects that are not of
interest. As you change the threshold levels,
MetaFluor will place a black overlay over the
areas that are excluded.
Note: If you can’t see the black overlay, click
the Threshold Tool in the image window
toolbar so that the black "T" changes to red.
This will enable thresholding.
7
Acquire a set of images using the Experiment
Control Panel. If the threshold or ratio settings
are not appropriate, repeat Steps 4 and 5.
8
Choose Close when you have finished setting
the image display controls, or see Setting the
Image Display Controls for Ratio Images to
adjust the display of ratio images.
MetaFluor
146
Version 7.0
MetaFluor User’s Guide
Setting the Image Display Controls for an External
Video Monitor
To set the image display controls for an external video monitor, use the following
procedure:
Step
Action
1
From the Configure menu, choose Image
Display Controls. The Image Display Controls
dialog box will appear.
2
Select either Monochrome or Pseudocolor
from the Image Display Mode list as the
display mode of the wavelength images.
3
Select the ratio limits appropriate for your
experiment using the Minimum and Maximum
spin boxes. The maximum ratio should be
slightly larger than the maximum value you
expect to observe during the experiment.
Note: The ratio settings will take effect when
the first pair of images is acquired after you
choose Apply.
4
Select the display for the ratio using the Ratio
Display drop-down list. You can select
Monochrome, Pseudocolor, or one of the IMD
displays.
Your choice for an IMD display will depend on
whether you expect the ratio image's values to
be evenly distributed throughout the ratio
range or clustered around one ratio value. If
most of the values are clustered, 4 Ratios with
64 Intensities will produce the best results.
5
If you selected one of the IMD display options
in Step 4, use IMD Intensity to select which
wavelength image is to be used to determine
the intensity component of the display. You
can select the intensity of either the numerator
wavelength image, the intensity of the
denominator image, or an average from the
two images.
Note: You should select the intensity from the
brighter image. If you are not sure, you can
select Average Num. and Denom. to use an
average from the two images.
6
To set the threshold levels for Wavelength 1,
select Wavelength 1 from the Image group.
Then set a threshold range using the slider or
the Low and High text boxes.
Note: The threshold settings will take effect
when the first pair of images is acquired after
you choose Apply.
7
Set the threshold levels for the other
wavelength images, as necessary, by
MetaFluor
147
Version 7.0
MetaFluor User’s Guide
repeating Step 6.
8
Choose Apply.
9
Acquire one set of images using the
Experiment Control Panel. If the threshold
settings are not appropriate, repeat Steps 6
and 7.
10
Choose Close.
MetaFluor
148
Version 7.0
MetaFluor User’s Guide
Setting the Image Display Controls for Ratio
Images
To set the image display controls for ratio images displayed on the computer's monitor,
use the following procedure:
Step
Action
1
If the Image Display Controls dialog box is not
already open, choose Image Display Controls
from the Configure menu.
2
From the Window list, select the ratio image
for which you want to change the image
display settings.
3
Select the display mode you want to use for
this image from the Display list. You can select
Monochrome, Pseudocolor, or IMD Display.
4
If you selected Monochrome or Pseudocolor in
Step 3, proceed to Step 5.
OR
If you selected IMD Display, skip to Step 8.
5
Adjust the Contrast slider to a value that
optimizes the appearance of the image.
The default value is 50 (unmodified contrast)
while maximum contrast is 100 (which
produces a binary image). Contrast can not be
decreased.
6
Adjust the Brightness slider to a value that is
suitable for the selected contrast.
The default value is 50. Minimum brightness is
0, while maximum brightness is 100.
Note: Adjust Brightness and Contrast together
until you have enhanced the image to suit your
viewing needs.
7
Use the Min. Ratio and Max. Ratio sliders to
select the ratio limits that are appropriate for
your experiment. The maximum ratio should
be slightly larger than the maximum ratio you
expect to observe during the experiment.
Now jump to Step 11.
8
If the display mode is IMD Display and you are
displaying ratio images as 8-bit images
(Preferences : General command, File menu),
the Brightness and Contrast sliders will have
changed to IMD Display and IMD Intensity
drop-down lists.
Select the desired IMD mode from the IMD
Display drop-down list:
4 Ratios with 64 Intensities,
8 Ratios with 32 Intensities,
MetaFluor
149
Version 7.0
MetaFluor User’s Guide
16 Ratios with 16 Intensities,
32 Ratios with 8 Intensities, or
64 Ratios with 4 Intensities.
9
If the display mode is IMD Display and you are
displaying ratio images as 24-bit images, the
Brightness and Contrast sliders will have
changed to IMD Intensity and IMD Overlay
drop-down lists.
Use the IMD Overlay drop-down list to select
the wavelength image that will be used to
determine the saturation of the color
component of the ratio image. If you select
None, maximum saturation will be used.
10
Use the IMD Intensity drop-down list to select
which wavelength is to be used to determine
the intensity component of the display. You
can select the intensity from either wavelength
or an average from the two wavelengths.
If you are using the 24-bit ratio image display,
you also have the option of selecting either the
mean intensity (Average of Wavelengths) or
the maximum intensity (Maximum of
Wavelengths) of all wavelength images as the
intensity component.
11
Acquire a set of images using the Experiment
Control Panel. If the settings are not
appropriate, repeat Steps 4 - 7 (Monochrome
or Pseudocolor) or Steps 8 - 10 (IMD Display),
as needed.
12
Choose Close when you have finished setting
the image display controls.
MetaFluor
150
Version 7.0
MetaFluor User’s Guide
Measure Spectra (Configure Menu)
Measures a dye's response using your microscope and illumination devices, so
that you can select the best excitation wavelength for your experiment.
This command is used as a diagnostic tool when setting up new illumination devices. For
example, you may find that your equipment works better with a slightly different wavelength
from one that has been published for a particular dye.
Note: You must install a continuous wavelength Illumination MetaDevice, such as a
monochromator, before using the Measure Spectra command.
Note: This command is unavailable in the MetaFluor Offline system.
See Also:
Configure Illumination
Define Regions for Measurement
MetaFluor
151
Version 7.0
MetaFluor User’s Guide
Measuring Spectra
To measure spectra, use the following procedure. Note: You must have at least one
region of interest defined in the image window.
Step
Action
1
From the Configure menu, choose Measure
Spectra. The Measure Spectra dialog box will
appear.
2
From the Configure Wavelengths drop-down
list, select the Illumination MetaDevice that
you want to use for the measurement
procedure.
Note: You must select a continuous
wavelength illumination device, such as a
monochromator.
3
Select the first wavelength to be measured
using Starting Wavelength. Then select the
last wavelength to be measured using Ending
Wavelength.
4
Select the increment to be skipped between
measured wavelengths using Step
Wavelengths By. Select 1 as the increment if
you want to measure every wavelength.
5
To use a particular set of wavelength image
acquisition settings, select the wavelength
image from the Use Acquisition Settings of
Wavelength drop-down list. Otherwise, just
select (Use Current).
6
If your camera requires a delay, enter the
delay value in the Delay (ms) to Wait After
Stepping Wavelength text box. If you are
leaving the shutter open, you will want to enter
your camera lag here.
7
If you want the shutter to be closed between
acquisitions, select the Open Shutter Before
Each Measurement, Then Close It check box.
OR
If you want the shutter to stay open during the
entire acquisition process, leave the check box
cleared.
8
If you want to use one of the defined regions
to provide an average intensity value that will
be subtracted as a background value from the
other acquisition regions, select the region
from the Bkgd Region drop-down list.
Otherwise select None.
9
From the Regions to Measure table, doubleclick the entries for the regions that you want
to measure. A check mark will appear next to
each selected entry.
10
When you are ready, choose Measure. The
MetaFluor
152
Version 7.0
MetaFluor User’s Guide
spectral measurement(s) will be displayed in
the Spectra graph.
11
If you want to save the results of the
measurement procedure (wavelength and
associated average intensity level), choose
Save Last Set of Measurements. The Export
dialog box will appear. Choose
Save Info to a Text File to save the data as a
.txt file,
Copy Info to the Clipboard to copy the data to
the Windows environment's Clipboard (you
can then paste the data into another Windowsbased program, such as a word processor), or
Print Info to send the data to the default
printer.
12
From the Measure Spectra dialog box, choose
Close when you have finished.
MetaFluor
153
Version 7.0
MetaFluor User’s Guide
Measure Spectra - Dialog Box Options
Configure Wavelengths
Specifies the Illumination MetaDevice used for this command from the Illumination
MetaDevices currently available. Note: You must select a continuous wavelength
illumination device, such as a monochromator.
Starting Wavelength
Specifies the first wavelength to be measured.
Ending Wavelength
Specifies the last wavelength to be measured.
Step Wavelengths By
Selects the increment to be skipped between measured wavelengths. Select 1 as the
increment if you want to measure every wavelength.
Use Acquisition Settings of Wavelength
Configures the spectral measurement acquisition to use the acquisition settings of the
selected wavelength image.
Delay (ms) to Wait After Stepping Wavelength
Specifies a camera delay between the changing of the wavelength and acquisition of the
measurement image.
Open Shutter Before Each Measurement, Then Close It
When selected, this check box configures the shutter to close between acquisitions.
When this check box is left cleared, the shutter will remain open during the entire
measurement procedure.
Bkgd Region
Selects a defined region of interest to use for background subtraction. The average
intensity value in this region will be subtracted from the average value of each spectral
measurement region.
Regions to Measure
Lists all defined regions of interest. Select the regions that you want to measure by
double-clicking the corresponding entries. A check mark will appear next to each selected
entry. To deselect an entry, double-click it again.
Measure
Starts the spectral measurement procedure, displaying the results in the Spectra graph.
Save Last Set of Measurements
Opens the Export dialog box. From this dialog box, you can save the measurement data
as a text (*.txt) file, copy it to the Clipboard, or send it to the default printer.
Spectra Graph
MetaFluor
154
Version 7.0
MetaFluor User’s Guide
Displays the spectral measurement(s). This graph can be configured by clicking the
Down Arrow button and choosing the appropriate command from the configuration menu
that appears.
Close
Closes the dialog box
MetaFluor
155
Version 7.0
MetaFluor User’s Guide
Configure Illumination (Configure Menu)
The Configure Illumination command enables you to create unique settings for the
hardware devices used to control illumination in MetaFluor.
Use the Configure Illumination command to create settings for multiple hardware devices that affect
illumination. Once created, the positions of these devices are saved as one illumination setting that can
be automatically applied in MetaFluor.
The following aspects can be modified and saved using the Configure Illumination command:
• Open and close shutters
• Set the wavelength and intensity of the illumination by controlling the appropriate window.
• Set the wavelength value for images.
Note: The number of device controls available will vary according to your hardware
configuration.
Before you use the Illumination command, you will need to install and configure the appropriate
hardware device driver(s) using the Meta Imaging Series Administrator.
WARNING:
Turn off all electronics, including computers, before powering up your arc lamp light source.
The electromagnetic pulse (EMP) generated by arc lamp (mercury or xenon) starters can
damage any electronics near the power supply, lamp house, or cables that connect the power
supply and lamp.
WARNING:
You must run all mechanical shutters at a cycle time greater than 25 ms. Uniblitz, Lambda 10,
Metaltek, Ludl, and cooled CCD shutters are driven by a high voltage which takes time to
dissipate. Running these shutters at a cycle length shorter than 25 ms will cause a build-up of
heat, leading to eventual jamming. Neither Molecular Devices nor any manufacturers of the
aforementioned shutters will honor warranties on equipment that has been damaged by
improper use. Operation of these shutters at a cycle length shorter than 25 ms will be
considered improper use.
MetaFluor
156
Version 7.0
MetaFluor User’s Guide
Creating Illumination Settings
The options that appear in the Configure Illumination dialog box vary based on your installed
hardware. To create a new illumination setting, use the following procedure:
Step
Action
1
With a project open, from the Configure
menu, click Illumination Control. The
Configure Illumination dialog box opens.
2
Type a name for the new setting in the Name
field.
3
To specify a wavelength value for images
acquired using this setting, type or select a
value from the Wavelength field. The color
box displays the LUT for the wavelength
value you enter.
4
To select the active filter for a filter wheel,
click the check box next to the filter wheel
name and select the filter with the slider.
5
If you have a monochromater, click the check
box next to the monochrometer name and
use the slider or edit box to select the
wavelength to be used during acquisitions.
6
To change the state of a shutter, click the
checkbox next to the shutter name and
select Always Closed or Active.
7
To manually check the shutter positions for a
setting, click the Open/Close Shutter icon.
8
To open the shutter when the setting is
active, click Open shutters when setting is
selected. This is done primarily when you are
using transmitted light and bleaching and
photo damage is not a concern. When this
option is selected the shutters will not open
or close for acquisitions because they will be
in their proper state as soon as a setting
becomes active.
9
Click Add/Replace when your setting is
complete. The new setting name is displayed
in the Defined Settings field and the setting is
saved.
10
Click Close.
MetaFluor
157
Version 7.0
MetaFluor User’s Guide
Deleting Illumination Settings
To delete an existing illumination setting, use the following procedure:
Step
Action
1
From the Devices menu, click Illumination.
The Configuring Illumination dialog box
opens.
2
Click the name of the setting you want to
delete in the Defined Settings field.
3
Click Remove.
4
Click Close.
MetaFluor
158
Version 7.0
MetaFluor User’s Guide
Configure Illumination - Dialog Box Options
Name
Specifies a new illumination setting name when you add a setting with Add/Replace.
Wavelength
Specifies wavelength value for the illumination setting. This value is stored in images created using this
illumination setting. The color box shows the LUT that corresponds with the wavelength. If you set the
wavelength outside the visible range (380-780), the color box turns white.
Defined Settings
Lists currently available defined illumination settings. Double click a setting to make it active. The settings in
the dialog box will change to reflect the new setting.
Open shutters when setting is selected
Determines if shutters set to open for each illumination setting do so when you select a setting. If not
selected, shutters will open only during acquisition. Leave this box unchecked to use the Open/Close
Shutter icon to verify your shutter settings.
Open/Close Shutter
Opens and closes shutters as defined by the active illumination setting. This command is useful if you want
to verify the correct shutters are responding for a setting.
Device Positions
Lists configurable settings:
Note: The type and number of settings will vary based on your hardware configuration.
Filter Wheel – Select the active filter for each filter wheel. If you have a monochromatic device you
can enter the number in the box.
Shutter – Select Closed or Open for each shutter. This is the state you want the shutter to be in during
acquisition. If the Open shutters when setting is selected box is checked, then this will be the state the
shutter will be in when the setting is selected.
Monochromater – Click the check box next to the Monochromater name and use the slider
or edit box to select the wavelength to be used during acquisitions.
Add/Replace
Adds new or edits existing defined settings.
Remove
Deletes the setting selected in the Defined Settings list.
Setting that defines shutter for command bar "Shutter" button
Designates the name of the defined setting that will appear on the shutter command bar button. Open the
drop-down list and choose the setting name that you want to use.
Backup
Opens the Backup all Illumination settings dialog box. Use this command to save your current Illumination
settings to a file. These settings are saved to a .ILS file. The settings can be restored and reused later.
Each time you change illumination settings, you can back them up. Then if you need to return to a previous
illumination configuration, you can restore the settings and reuse them without having to redo them.
Restore
Opens the Restore Illumination settings dialog box. Use this command to retrieve a previously backed-up
illumination settings file to restore a previously used and saved group of illumination settings.
MetaFluor
159
Version 7.0
MetaFluor User’s Guide
Close
Closes the dialog box.
MetaFluor
160
Version 7.0
MetaFluor User’s Guide
Run Experiment Menu
MetaFluor
161
Version 7.0
MetaFluor User’s Guide
Experiment Control Panel - Digital Camera (Run
Experiment Menu)
Contains the focusing and image and data acquisition commands needed to run a
new experiment using a digital camera.
The Experiment Control Panel is your "command center" for controlling new experiments.
Using it, you can focus the camera, set image acquisition settings, and enable image saving
and data logging. If your camera has gain and offset controls, you can adjust these while
focusing the camera.
You can use the Focus command button to obtain continuous images while focusing the
microscope prior to starting the experiment. As you focus the microscope, MetaFluor
continuously acquires and displays images which you can use to verify that your specimen is
visible and in focus. It is important to use the Focus command while you are focusing the
microscope, because what can be seen through the microscope's eyepiece is not always the
same as what the camera acquires.
If your camera supports it, you will have the option of using an external video display or an
image window on your computer screen to view the focusing image. You can configure your
choice by selecting a preference in the Digital Camera Preferences dialog box (Preferences
command, File menu). Digital cameras that currently support this flexibility of focusing
methods include the Princeton Instruments PentaMax and MicroMax. If you use an external
video monitor, the Focus command will summon the Focus Digital Camera dialog box, which
you can use to zoom and pan, set the excitation wavelength and exposure time, and specify
an intensity scaling and gray level offset for the focus image. If you use an image window, the
Focus command will summon the Focus Control dialog box, which specifies the pixel binning,
exposure time, and focusing region for the focusing image. In both cases, these focusing
options are different from those used for actual data image acquisition, which is configured
using the Configure Acquisition command.
The majority of the commands in the Experiment Control Panel are image and data acquisition
commands. Most are used prior to starting an experiment to define the acquisition. "LED"
indicators next to the Save Images and Save Ratios check boxes will indicate the saving
status of each Wavelength and Ratio image: gray indicates that saving is off, red indicates that
saving is on but that the particular Wavelength or Ratio image will not be saved, blue indicates
that saving is on and that the image will be saved, but not on every cycle, and green indicates
that the image will be saved on every cycle. When you have selected all of the necessary
options, the experiment can be run. You can enable Background subtraction and shading
correction using the Reference Images command.
Before you start acquisition, spend a minute to make sure that Image Display Controls and
Configure Experiment are set appropriately for your experiment. You may also want to check
the Data Logging Preferences options (Preferences command, File menu) if you are logging
data. If you plan to use event marks or move regions while running the experiment, you may
want to open and position those dialog boxes before starting acquisition.
Note: This version of the Experiment Control Panel is unavailable in the MetaFluor Offline
system. Please see the description of the Playback Mode version.
See Also:
MetaFluor
162
Version 7.0
MetaFluor User’s Guide
Experiment Control Panel:
For Video Camera with Computer's Monitor
For Playback
Reference Images
Image Display Controls - Using the Computer's Monitor
Preferences
Event Marks
MetaFluor
163
Version 7.0
MetaFluor User’s Guide
Focusing the Digital Camera Using a Computer
Image Window
To focus the image from a digital camera using an image window on the computer
screen, use the following procedure:
Step
Action
1
From the Experiment Control Panel, choose
Focus. The Focus dialog box will appear.
MetaFluor will temporarily close all other
dialog boxes that are open.
2
From the Wavelength table on the right side of
the dialog box, select the wavelength image
you want to use for focusing.
3
If your camera supports pixel binning, use the
Binning spin box to select a binning value.
This value will be used for binning in both the
vertical and horizontal directions.
4
From the Exposure Time spin box, select the
acquisition exposure time for the focusing
images.
AND
If your camera supports them, select a camera
gain from the Gain list, select a camera bitdepth from the Bits list, and select a transfer
speed from the Rate list. If your camera
supports on-chip integration, use the Frames
to Integrate option to select the number of
frames to be summed for each acquired focal
image.
5
If you changed the settings from those you
configured using the Configure Acquisition
command, you can direct MetaFluor to use the
new settings for acquiring the data images by
choosing Store for This Wave.
OR
If you want to use the same exposure settings
as you configured for the data images with the
Configure Acquisition command, choose Use
Wave Settings.
6
If you are using an external shutter, select
Open on Start Focus. Select Close After
Acquire if you want the shutter to close
immediately after the acquisition cycle has
finished.
7
When you are ready to start acquiring focus
images, choose the Start Focusing button. If
you are using a shutter, choose Toggle
Shutter to open the shutter. Choose it again to
close the shutter. The colored box to the right
of the button will indicate when the shutter is
open or closed. After you choose Start
Focusing, a new Interactive option group will
MetaFluor
164
Version 7.0
MetaFluor User’s Guide
appear below the Acquisition Region option
group (see Step 8, middle option).
You can pause acquisition at any time by
choosing F2: Pause Focus or by pressing the
[F2] function key. Resume focusing by
choosing F4: Resume Focus or by pressing
the [F4] function key.
8
If you want to use a subregion of the image for
focusing, use the box-in-box display or the
Left, Top, Width, and Height spin boxes to
specify the size and location of the focusing
subregion. Choose CTR to place the center of
the region in the center of the image.
Alternatively, choose Full Chip to use the
entire image. If you want to use this newly
configured region for acquisition as well,
choose Store as Acq Rgn.
OR
Choose the Select button in the new
Interactive option group that appears in the
upper left area of the Focus dialog box. This
will display a green region of interest on the
Focus image window. Resize and reposition
the region as needed with your cursor and
choose OK to fill the entire Focus image
window with the selected region.
OR
If you want to use the same acquisition region
settings as you configured for the data image
itself with the Configure Acquisition command,
choose Use Acq. Region.
9
While monitoring the focusing image, adjust
the microscope to provide the optimum focus.
10
If you want to view a graphical display of the
intensity values in the image while adjusting
the contrast, select the Update check box,
select either Histogram or Scanline from the
drop-down list, and choose the image's bitdepth from the Depth list.
The histogram or line graph can be configured
as needed from the Down Arrow configuration
menu.
11
If you are acquiring 16-bit images and want to
adjust the scaling to increase contrast in the
displayed images, use the Low and High text
boxes or the scaling slider to select the lower
and upper grayscale values, respectively, in
the displayed image. Alternatively, you can
drag the left (yellow) and right (cyan) calipers
to define the scaling range.
OR
Select the Autoscale check box if you want
MetaFluor to select the scaling range
automatically.
12
When you have finished, toggle the shutter
closed (if necessary) and choose Stop
MetaFluor
165
Version 7.0
MetaFluor User’s Guide
Focusing.
13
Choose Close to return to the Experiment
Control Panel.
MetaFluor
166
Version 7.0
MetaFluor User’s Guide
Focusing the Digital Camera Using an External
Video Monitor
To focus the image from a digital camera using an external monitor, use the following
procedure:
Step
Action
1
From the Run Experiment menu, choose
Experiment Control Panel. The Experiment
Control Panel will appear.
2
Choose Focus. The Focus dialog box will
appear.
3
With the Exposure (ms) spin box, select an
exposure time for the focusing image.
4
If necessary, use the Intensity Scaling dropdown list box to select a scaling range for 16bit focusing images.
5
If necessary, use the Offset spin box to specify
a gray level offset for the focusing image.
6
If you are using a filter wheel or
monochromator, use the Wavelength list to
select the wavelength image corresponding to
the illumination settings you want to use during
image focusing.
7
When you are ready, select the Open Shutter
check box (if you are using an external
shutter), so that a check mark appears in it.
AND
Choose Start Focusing. Images will be
acquired continuously and displayed on the
external video monitor, and the progress meter
will indicate the stage in the acquisition cycle.
8
Focus your microscope. As you do so, you can
switch between filters using the selections in
the Wavelength list, open or close the shutter
by selecting or clearing the Open Shutter
check box, change magnification with Zoom,
and change the focus region with Pan.
When you want to stop focusing, choose Stop
Focusing.
9
When you have finished, choose Close to
return to the Experiment Control Panel.
MetaFluor
167
Version 7.0
MetaFluor User’s Guide
Preparing for Image Acquisition
To prepare for image acquisition, use the following procedure:
Step
Action
1
From the Run Experiment menu, choose
Experiment Control Panel. The Experiment
Control Panel dialog box will appear.
2
Focus the microscope using the Focus
command.
3
If you want to use background subtraction
and/or shading correction, acquire the
appropriate reference images and save them
using the Reference Images command.
4
Configure the desired wavelength, intensity,
MetaDevice, and shutter setting using the
Configure Acquisition command.
5
If you want to save wavelength images, ratio
images, or measured data, open the
appropriate file using the Open Save Images
File, Open Save Ratios File, or Open
Measurements File commands.
Note: The appropriate command will be
opened automatically if you select Save
Images, Save Ratios, or Log Data from the
Experiment Control Panel, but a file has not
yet been opened.
6
If you plan to log data, you may want to enable
Log Data in the Experiment Control Panel now
so that the location, size, and area of the
regions are logged at the start of the log file.
Do not select Save Images or Save Ratios in
the Experiment Control Panel yet.
7
Use the Define Regions for Measurement
command to define the desired regions of
interest (necessary for measurements).
8
From the Experiment Control Panel, choose
Set Timelapse. The Set Timelapse dialog box
will appear.
Select the timelapse interval and the
measurement units using Timelapse Interval.
Select 0 for no timelapse.
Select the number of acquisitions to acquire
using Number of Acquisitions. Select 0 if you
want the acquisition to continue until you
choose Pause Acquisition.
Choose Close to return to the Experiment
Control Panel.
MetaFluor
168
Version 7.0
MetaFluor User’s Guide
Running the Experiment
To acquire images and/or data, use the following procedure:
Step
Action
1
From the Run Experiment menu, choose
Experiment Control Panel. The Experiment
Control Panel will appear.
2
Choose F4: Acquire or press the [F4] function
key. MetaFluor will start image acquisition.
3
Whenever you want to save wavelength or
ratio images, select Save Images or Save
Ratios to enable saving. Clear the Save
Images or Save Ratios check boxes when you
want to stop saving wavelength or ratio
images.
EXAMPLE:
You can enable and disable Save Images so
that images are saved from cycles 3 - 10 but
not save images from cycles 1, 2, and 11.
4
You can enable or disable Log Data at any
point during acquisition.
5
Mark events or move regions as necessary
during the experiment.
6
The status line will report "Acquiring
Wavelength X," "Transmitting Wavelength X,"
"Ratioing images," or "Next acquire in XX ms."
If the acquisition time selected is shorter than
the time required to complete acquisition
tasks, the next acquisition will start after the
previous one was finished.
7
Press the [F2] key on the keyboard or choose
F2: Pause to stop the acquisition at any time.
MetaFluor
169
Version 7.0
MetaFluor User’s Guide
Experiment Control Panel - Dialog Box Options
(Digital Camera)
Status
Reports the length of time to the next acquisition, as set by Set Timelapse and the shutter
delay time in the Illumination Control dialog box (the Delay option). The message
"Running" occurs when an image is acquired or when the requested acquisition interval is
shorter than the time required to complete the acquisition cycle.
Log Data
Enables or disables data logging to an open, DDE-linked spreadsheet file and/or text file.
The status line next to Log Data will indicate if a file is open for saving data. If a data file
has not been opened prior to selecting Log Data, the Open Measurements File command
will be activated automatically so that you can open a file.
Save Images
Enables or disables wavelength image saving. The status line next to Save Images will
indicate if an .inf file is open. If an .inf file has not been opened prior to selecting Save
Images, the Open Save Images File command will be activated automatically so that you
can open an .inf file. "LED" indicators next to the Save Images check box will indicate the
saving status of each Wavelength image: gray indicates that saving is off, red indicates
that saving is on but that the particular Wavelength image will not be saved, blue
indicates that saving is on and that the image will be saved, but not on every cycle, and
green indicates that the image will be saved on every cycle.
Save Ratios
Enables or disables ratio image saving. The status line next to Save Ratios will indicate
when you can save ratio images. "LED" indicators next to the Save Ratios check box will
indicate the saving status of each Ratio image: gray indicates that saving is off, red
indicates that saving is on but that the particular Ratio image will not be saved, blue
indicates that saving is on and that the image will be saved, but not on every cycle, and
green indicates that the image will be saved on every cycle. The Open Ratios File
command will be activated automatically when you select Save Ratios.
F4: Acquire
Acquires wavelength image and ratios them according the display and acquisition
options. When you choose this command, its label will change to "F2: Pause."
Set Timelapse
Sets the time between acquisitions and the number of acquisition to be completed. Select
0 for the Timelapse Interval if you do not want to use timelapsing. Select 0 for the
Number of Acquisitions if you want acquisition to continue until you choose F2: Pause.
F2: Pause
Pauses acquisition at the end of the present cycle. You can also press the [F2] key on
the keyboard to stop acquisition.
Zero Clock
Same as the Zero Clock command in the Run Experiment menu.
MetaFluor
170
Version 7.0
MetaFluor User’s Guide
Focus
Opens the Focus Control dialog box if you are using an image window on a computer
monitor, or the Focus Digital Camera dialog box if you are using an external video
monitor.
Cycle and CPS
One cycle is the total time required to acquire both wavelength images (with background
subtraction and/or shading correction), display them, ratio them, display the ratio image,
draw regions (if selected), make measurements, plot measurements on graphs, log data,
and save images. The CPS calculation is updated every 10 uninterrupted cycles.
Close
Closes the dialog box.
MetaFluor
171
Version 7.0
MetaFluor User’s Guide
Focus - Dialog Box Options (Digital Camera with
Computer Monitor)
Binning
Configures pixel binning for acquisition of focusing images.
Left
Defines and displays the leftmost point of the region.
Top
Defines and displays the topmost point of the region.
Width
Defines and displays the width of the region.
Height
Defines and displays the height of the region.
Use Acq Region
Directs MetaFluor to use the acquisition region settings from the Configure Acquisition
dialog box for the focusing image.
Store as Acg Rgn
Directs MetaFluor to use the current focusing acquisition regions for acquisition of the
data images. These settings will be stored in the Configure Acquisition dialog box.
Select (Interactive)
Displays a green region of interest on the Focus image window. After you reposition and
resize the region around the area in the image that is of greatest importance, choosing
OK will zoom that area to fill the entire Focus image window. A green "LED" will flash
beneath the OK and Cancel buttons while the Select function is active. The Interactive
option group (Select, OK, and Cancel) appears when you choose Start Focusing.
OK (Interactive)
Accepts the green region of interest drawn in the Focus image window when you choose
the Select button, and zooms the selected area of the image to fill the entire Focus image
window. The Interactive option group (Select, OK, and Cancel) appears when you
choose Start Focusing.
Cancel (Interactive)
Cancels the selection of the image area selected by the green region of interest, and
removes the region from the Focus image window.
<<
Decreases the size of the focusing image's acquisition subregion by half.
CTR
Centers the focusing image acquisition subregion.
MetaFluor
172
Version 7.0
MetaFluor User’s Guide
>>
Doubles the size of the focusing image's acquisition subregion.
Full Chip
Specifies that the entire camera chip be used as the focusing image's acquisition
subregion.
Box-in-Box Display
Allows you to define a region of interest for focusing. Drag the outline of the smaller box
to resize and position it, just as you would for a data acquisition subregion. The focusing
region will be defined proprotionally such that, if you change the size of the overall image
(for example by changing binning) or the acquisition region, the focusing region will
remain the same relative size and in the same relative location on the image.
Exposure Time
Selects an acquisition exposure time for the focusing images.
Gain
Specifies the camera gain to be used for the focusing image.
Bits
Specifies the camera bit-depth to be used for the focusing image.
Rate
Specifies the camera transfer speed of data.
Frames to Integrate
Specifies the number of frames to be summed together for each focal image. This option
will appear only if your camera supports on-chip integration.
Use Wave Settings (exposure time)
Directs MetaFluor to use the camera settings from the Configure Acquisition dialog box
for the focusing image.
Store for This Wave (exposure time)
Directs MetaFluor to use the current exposure time settings for acquisition of the data
images. These settings will be stored in the Configure Acquisition dialog box.
Update
Enables continuous updating of the intensity values in the histogram or line graph while
you configure contrast.
Histogram/Scanline Selection List
Selects a display mode for the continously updating intensity graph: Histogram or
Scanline. If you select Histogram, the gray values in the entire image (or focus region)
will be numerically represented in the histogram bins. If you select Scanline, you can
select the location of the red scanline in the image by dragging it up or down in the image
window, and the gray values under the line will be represented in a line graph.
Depth
MetaFluor
173
Version 7.0
MetaFluor User’s Guide
Selects a range of intensity values for display in the intensity graph. The value should
reflect the bit-depth of the camera. Select 8-Bit for a range of 0 - 256, 10-Bit for a range
of 0 - 1024, or 12-Bit for a range of 0 - 4096.
Intensity Graph
Displays the continuously updated intensity values in the focusing image in either a
histogram or line graph.
Down Arrow Configuration Menu
Allows you to configure the intensity graph. You can also print the graph or copy it to the
Clipboard. (For more information, see Graphs).
Wavelength
Selects a wavelength image for display of the focusing image.
Toggle Shutter
Toggles the shutter open and closed. The colored box to the right of the button will
indicate when the shutter is open or closed.
Open on Start Focus
Directs MetaFluor to open the shutter at the start of the focus image's acquisition cycle.
Close After Acquire
Directs MetaFluor to close the shutter at the end of the focus image's acquisition cycle.
Leave this check box cleared to perform continuous acquisition.
Low
Selects the lowest gray value to be displayed in the scaled 16-bit focusing images.
High
Selects the highest gray value to be displayed in the scaled 16-bit focusing images.
Autoscale
Directs MetaFluor to select the scaling range automatically for the 16-bit focusing images.
Use Wave Settings (scaling)
Directs MetaFluor to use the scaling settings from the Scale 16-Bit Images dialog box for
the focusing image.
Store for This Wave (scaling)
Directs MetaFluor to use the current scaling settings for acquisition of the data images.
These settings will be stored in the Scale 16-Bit Images dialog box.
Start Focusing / Stop Focusing
Starts and stops the acquisition of images for focusing.
F2: Pause Focus
Pauses acquisition of the focusing images.
F4: Resume Focus
MetaFluor
174
Version 7.0
MetaFluor User’s Guide
Resumes acquisition of the focusing images.
Z Position
Contains settings to adjust the Z position associated with a specific wavelength and to
store a newly defined Z position for the wavelength.
(Up Arrow)
Moves the Z position upward by the step size defined in the Z Position Control dialog
box. The current step size is indicated on the arrow button.
(Down Arrow)
Moves the Z position downward by the step size defined in the Z Position Control dialog
box. . The current step size is indicated on the arrow button.
Goto 0
Moves the Z position to the zero or origin position as defined in the Z Position Control
dialog box.
Use Wave Z
Applies the Z Position settings as specified in the Z Position Control dialog box.
Store for this Wave
Stores the currently set Z Position value as the new Z position value for the currently
selected wavelength, replacing any previously set Z position value for this wavelength.
Close
Closes the dialog box.
MetaFluor
175
Version 7.0
MetaFluor User’s Guide
Focus Digital Camera - Dialog Box Options
(Digital Camera with External Monitor)
Zoom
Selects a magnification level for the focusing image: 1x (no zoom), 2x, or 4x.
Pan
If you selected a higher magnification with the Zoom option, this button group selects a
quadrant subregion of the original image for display at the zoomed magnification.
Exposure (ms)
Specifies an exposure time, in milliseconds, for the focusing images.
Intensity Scaling
Specifies an intensity scaling range for 16-bit images. For example, if most of your image
intensity data is at the lower end of the intensity grayscale, you will want to use 4 - 1024.
Offset
Specifies a grayscale offset for the focusing image.
Wavelength
Selects the wavelength image series corresponding to the illumination settings
(MetaDevice, illumination wavelength, illumination intensity, shutter usage) that you want
to use for acquiring the focusing images.
Open Shutter
Toggles the external shutter open and shut. When you select this check box, the shutter
will be opened.
Start Focusing/Stop Focusing
Starts and stops the acquisition of images for focusing.
Close
Closes the dialog box
MetaFluor
176
Version 7.0
MetaFluor User’s Guide
Experiment Control Panel - Playback Mode (Run
Experiment Menu)
Contains the playback and the image and data storage commands needed to
playback a stored experiment.
When you open an experiment stored on disk using the Open Experiment command, the
commands in the Experiment Control Panel change to those needed for playback, rather than
for live acquisition. Using the Experiment Control Panel, you can play back the images, and, if
you wish, you can log data and save wavelength and ratio images. This allows you to log data
or save ratio images if you were not able to do so during the experiment. Saving images is
useful if you want to selectively save a smaller set of images to another .inf file.
As during acquisition, "LED" indicators next to the Save Images and Save Ratios check boxes
will indicate the saving status of each Wavelength and Ratio image: gray indicates that saving
is off, red indicates that saving is on but that the particular Wavelength or Ratio image will not
be saved, blue indicates that saving is on and that the image will be saved, but not on every
cycle, and green indicates that the image will be saved on every cycle.
See Also:
Experiment Control Panel:
For Digital Camera
For Video Camera with Computer's Monitor
For Video Camera with Other Video Board and External Monitor
MetaFluor
177
Version 7.0
MetaFluor User’s Guide
Playing Back a Stored Experiment
To play back an experiment, use the following procedure:
Step
Action
1
Open the desired experiment using the Open
Experiment command.
2
From the Run Experiment menu, choose
Experiment Control Panel. The Experiment
Control Panel will appear.
3
To view selected image frames, use the
Frame slider, or the F4: Forward or F3:
Reverse buttons. The button you click will
become the F2: Pause button. (A second click
will convert the button back to its original state
as a "forward" or "reverse" button.)
The Frame slider advances or reverses to a
selected frame. The text box next to this slider
displays the current frame. It can also be used
to go to a particular frame by typing a frame
number and pressing the [TAB] key.
F4: Forward and F3: Reverse quickly advance
the frames in the selected direction until you
choose F2: Pause or the last frame is reached.
4
If you plan to log data, you should look for
areas that would be ideal regions of interest.
(If you made event marks while collecting
images, MetaFluor will display an "Event"
message box while playing back the images.
After you have read the text, close the
message box by pressing Enter.)
5
If you want to log data, or save wavelength or
ratio images, use the Frame slider to return to
Frame 1 (so that images or data are saved in
the proper chronological order).
Then select Log Data to enable data logging,
select Save Images to enable wavelength
image saving, or select Save Ratios to enable
ratio image saving.
You can deselect any of these three options at
any time to disable the image saving or data
logging.
6
If you plan to log data or view data using the
graphs, you should define regions of interest
using the Define Regions for Measurement
command.
7
Play through images again using F4: Forward
to log data or save wavelength or ratio images.
8
Choose Close when you have finished.
MetaFluor
178
Version 7.0
MetaFluor User’s Guide
Experiment Control Panel - Dialog Box Options
(Playback Mode)
Status
Indicates the name of the image that is currently loaded.
Log Data
Enables or disables data logging to an open, DDE-linked spreadsheet file and/or text file.
The status line next to Log Data will indicate when a file is open for saving data. If a data
file has not been opened prior to selecting Log Data, the Open Measurements File
command will be activated automatically so that you can open a file.
Save Images
Enables or disables wavelength image saving. The status line next to Save Images will
indicate when an .inf file is open. If an .inf file has not been opened prior to selecting
Save Images, the Open Save Images File command will be activated automatically so
that you can open an .inf file.
Save Ratios
Enables or disables ratio image saving. The status line next to Save Ratios will indicate
when you can save ratio images. "LED" indicators next to the Save Ratios check box will
indicate the saving status of each Ratio image: gray indicates that saving is off, red
indicates that saving is on but that the particular Ratio image will not be saved, blue
indicates that saving is on and that the image will be saved, but not on every cycle, and
green indicates that the image will be saved on every cycle. The Open Ratios File
command will be activated automatically when you select Save Ratios.
Frame
Advances or reverses to the selected frame.
Image Time
Displays the image time for the current image. You can use the drop-down list to specify
the units of time used to display the time.
F3: Reverse
Reverses the frames quickly until either F2: Pause is chosen or the first frame has been
reached. When you first click this button, it will become the F2: Pause button. A second
click will convert it back to the F3: Reverse button.
F4: Forward
Advances the frames quickly until either you choose F2: Pause or the last frame has
been reached. When you first click this button, it will become the F2: Pause button. A
second click will convert it back to the F4: Forward button.
F2: Pause
Pauses playback.
Close
Closes the dialog box.
MetaFluor
179
Version 7.0
MetaFluor User’s Guide
Stop Acquisition (Run Experiment Menu)
Stops image acquisition during an experiment.
Use this command to stop image acquisition after the present acquisition cycle is completed.
You can stop image acquisition by any of the following methods:
(1) Choosing Stop Acquisition from the Run Experiment menu,
(2) Pressing the [F2] function key (the keyboard shortcut for the Stop Acquisition
command), or
(3) Choosing Pause from the Experiment Control Panel.
If you keep the Experiment Control Panel open and accessible during a new experiment,
choosing Pause Acquisition is faster than selecting Stop Acquisition from the Run Experiment
menu. Pause Acquisition will change to Resume Acquisition so that you can pause and restart
image acquisition with the click of a mouse button. (Note: Because of the way the computer
communicates with its peripheral input devices, pressing the [F2] key is faster still.)
Shortcut: [F2]
See Also:
Experiment Control Panel:
For Digital Camera
For Video Camera with Computer's Monitor
For Video Camera with External Video Monitor
MetaFluor
180
Version 7.0
MetaFluor User’s Guide
Stopping Image Acquisition
To stop image acquisition, use the following procedure:
Step
Action
1
Select the Run Experiment menu.
2
Choose Stop Acquisition. MetaFluor will stop
image acquisition at the end of the current
acquisition cycle.
Note: You can use the [F2] key, the keyboard
equivalent for the Stop Acquisition command,
at any point during acquisition.
MetaFluor
181
Version 7.0
MetaFluor User’s Guide
One Acquisition (Run Experiment Menu)
Acquires one set of images and then stops acquisition.
Use this command to acquire one complete acquisition cycle of images. This command
provides a quick way for you to acquire one set of images for use while defining regions,
selecting a save region, or setting image display controls in preparation for the experiment. If
you are playing back an experiment, this command will not be available.
The One Acquisition command has a keyboard shortcut, the [F3] function key, which you can
use rather than selecting the command from the menu. For example, you can use the shortcut
while determining the threshold settings for a new experiment in the Image Display Controls
dialog box. If you press the [F3] key after choosing Apply from the Image Display Controls
dialog box, the images on your monitor will be updated with the new settings without leaving
that dialog box.
There is an Acquire Images command button in the Select Source Image for Editing Regions
dialog box (Define Regions for Measurement command, Graphs menu). You will not be able
to use the [F3] keyboard shortcut when this dialog box for selecting source images is open.
Shortcut: [F3]
MetaFluor
182
Version 7.0
MetaFluor User’s Guide
Acquiring One Acquisition
To acquire one set of images, use the following procedure:
Step
Action
1
Select the Run Experiment menu.
2
Choose One Acquisition. MetaFluor will
acquire one set of images.
MetaFluor
183
Version 7.0
MetaFluor User’s Guide
Zero Clock (Run Experiment Menu)
Resets the clock used for graphing and logging data and clears any data in the
graphs.
Use this command to reset the clock used to graph and log data for a new experiment to its
original starting point. Any data graphed in the measurements graphs will be cleared when
you use the Zero Clock command. If data logging has been enabled, the message "Clock
reset to 0.0" will appear in the log file. This command is ideal for synchronizing all of your
data-gathering equipment.
Because the clock restarts immediately, you should arrange everything for image acquisition
before using Zero Clock. (When you start a new experiment, the clock will not start until the
first image is acquired.)
Understanding the Clock
MetaFluor uses real-time units (seconds) to present acquired data in data logs and graphs.
When you start image acquisition for a new experiment, the clock starts at 0.0. If you started
image acquisition at 3:30 PM, the "0.0 seconds" at the start of the graphs and at the first entry
in the log file would refer to 3:30 PM. If a point of data was plotted at 1372 seconds on the
graph, that would reflect that something happened to the experiment at 3:52:52 PM. This clock
is ideal for representing relative times; you can quickly see the amount of time between
events. For example, you could see that, at 12 seconds after adding an agonist solution, a
two-fold increase of cytoplasmic calcium was detectable. It is often not necessary or desirable
to relate these events to the actual time of day.
Converting the Clock's Time
If you need to know the actual time of day that an event occurred, you can convert the clock's
seconds. For example, if you zeroed the clock at 3:30 PM, and a data point registered on the
graph at 1372 seconds, you could divide 1372 by 60 seconds / minute to see that 1372 is 22
minutes and 52 seconds. Then simply add this to your start time of 3:30:00 PM to find that the
event actually occurred at 3:52:52 PM.
Shortcut: CTRL + Z
See Also:
Clear Graphs
MetaFluor
184
Version 7.0
MetaFluor User’s Guide
Zeroing the Clock
To zero the clock, use the following procedure:
Step
Action
1
Select the Run Experiment menu.
2
Choose Zero Clock. The clock for data logging
and graphing will be reset to 0.0.
Note: You can use CTRL + Z, the keyboard
shortcut for the Zero Clock command, to reset
the clock at any point in the experiment.
MetaFluor
185
Version 7.0
MetaFluor User’s Guide
Set Timelapse
Sets the timelapse interval for acquiring images for a defined number of acquisitions.
Use this option to acquire images at equally-spaced intervals, limited by the number of
acquisitions that you specified. If you specify Zero as the number of acquisitions, Metafluor
will acquire images indefinitely. You can specify the unit of measure for the time interval as
milliseconds, seconds, minutes, or hours.
Setting Timelapse Intervals
To set timelapse, complete the following procedure.
Step
Action
1
From the Experiment Control Panel, click
Set Timelapse The Set Timelapse dialog box
opens.
2
Type or select the interval length and select
the interval unit of measure. (milliseconds,
seconds, minutes, or hours).
3
Type or select the number of acquisitions.
Set this value to zero to acquire images
indefinitely.
4
Click closed to close the dialog box.
Set Timelapse - Dialog Box Options
Timelapse Interval
The amount of time between acquisitions in milliseconds, seconds, minutes, or hours.
Number of Acquisitions
The total number of images that you want to acquire for your experiment. To acquire images indefinitely, set
this value to Zero (0).
Close
Closes the Set Timelapse dialog box.
MetaFluor
186
Version 7.0
MetaFluor User’s Guide
Save Last Acquired Images (Run Experiment
Menu)
Saves the last set of acquired images to disk.
Use this command to save acquired images to disk. If you have an .inf file already open, the
last set of acquired images will be saved using the next sequence number (002, etc.) and the
.inf file will be updated.
Shortcut: [F7]
MetaFluor
187
Version 7.0
MetaFluor User’s Guide
Saving the Last Acquired Images
To save the last acquired images, use the following procedure:
Step
Action
1
Open an .inf file for saving wavelength images.
(This can be done by selecting Save Images in
the Experiment Control Panel.)
2
Acquire at least one set of images using the
Experiment Control Panel.
3
From the Run Experiment menu, choose Save
Last Acquired Images. The last set of
wavelength images will be saved.
Note: If you want to save the last set of
images during acquisition, you can use the
keyboard shortcut by pressing the [F7] key at
any time, rather than following Step 3.
MetaFluor
188
Version 7.0
MetaFluor User’s Guide
Log Now (F9) (Run Experiment Menu)
Logs the current region data to an open measurements file.
Use this command to log region data (as defined by the current regions and the status of
Configure Experiment) to an open measurements file. A typical use would be when you want
to log the quantitative data from particular frames in a stored experiment that you are playing
back. You do not need to select Log Data in the Experiment Control Panel, but you do need
to open a measurements file before you use this command.
Shortcut: [F9]
See Also:
Open Measurements File
Configure Experiment
Experiment Control Panel - Playback Mode
MetaFluor
189
Version 7.0
MetaFluor User’s Guide
Using Log Now
To log region data from an image to a measurements file, use the following procedure:
Step
Action
1
Open a measurements file using the Open
Measurements File command.
2
Where appropriate, use the Configure
Experiment command to select the data to be
logged.
3
From the Run Experiment menu, choose Log
Now.
OR
Press [F9] to log the data using the keyboard
shortcut.
4
The measured data will be logged.
MetaFluor
190
Version 7.0
MetaFluor User’s Guide
Scale 16-Bit Images (Run Experiment Menu)
Scales the gray level display for 16-bit images to an 8-bit (256-level) range of gray
levels of your choice, thereby increasing the image contrast without affecting the
data.
This command allows you to scale 16-bit images to a selected range of 256 gray levels.
(MetaFluor considers any image that has more than 8 bits per pixel to be a 16-bit image, even
if the image is actually only 10 or 12 bits.) Due to experimental conditions, much of the
important image data may reside within a narrow range of gray levels, and displaying the full
16-bit range may make it difficult or impossible to see intensity differences. Scaling a selected
range will allow you to see those differences. The scaling process expands the range of gray
levels in the 16-bit image to an 8-bit display.
Scaling a 16-Bit Image
Note: This command does not affect pixel intensity values; its only purpose is to give you the
option of selecting a range of gray levels to display.
The scaling process requires a minimum and a maximum gray level (either determined during
autoscaling or specified by you). When scaling, MetaFluor takes the range of gray levels in the
16-bit image that fall between the minimum and the maximum gray level, and divides them by
256. Each of these resulting bins is displayed at the same gray level on the monitor. If your
image contains outlying "hot" pixels (either oversaturated or undersaturated), you can exclude
a selected percentage of the pixels in the image (not the gray levels in its histogram!) at the
lower and upper end of the image's grayscale range by adjusting the settings of the Lo% and
Hi% spin boxes, respectively. For example, you could exclude the bright nucleus of a cell in a
fluorescence image by setting the low spin box to 1% and the high spin box to 10%. (You can
specify a fractional value, such as 0.1%, if necessary. Click here for a depiction of a sample
histogram with the lowest and highest 0.1% of pixels selected for exclusion.) Scaling will then
be based on the lowest and highest remaining grayscale values.
You can
(1) Autoscale all wavelengths,
(2) Set the same fixed scaling for all wavelengths,
(3) Set a different fixed scaling for each of the wavelengths, or
MetaFluor
191
Version 7.0
MetaFluor User’s Guide
(4) Use any combination of autoscaled and fixed scalings for each of the wavelengths.
In addition, you can specify that the scaling for Wavelength 1 and 2, or that for Wavelength 4
and 5, are to be the same. This will simplify pairing of images for ratiometric measurement.
Note: If you set the grayscale histogram scaling and axis range for an image with its
Histogram Tool, this will update the settings for the selected wavelength in the Scale 16-Bit
Images dialog box (as long as autoscaling has been disabled).
MetaFluor
192
Version 7.0
MetaFluor User’s Guide
Scaling 16-Bit Images
To scale 16-bit images, use the following procedure:
Step
Action
1
From the Run Experiment menu, choose
Scale 16-Bit Images. The Scale 16-Bit Images
dialog box will appear.
2
If you want MetaFluor to scale all images
automatically based on their lowest and
highest grayscale values, choose Autoscale
All. Then skip to Step 6.
3
Select Wavelength 1 from the Select a
Wavelength to Adjust Its Scaling table.
4
If you want MetaFluor to scale the image
automatically based on its lowest and highest
grayscale values, select the Autoscale check
box. If desired, specify a percentage of pixels
(not gray values) to be excluded from the
lower and upper ends of the scaling ranges
with the Lo% and Hi% spin boxes,
respectively.
OR
Clear the Autoscale check box. Then select
the lowest and highest grayscale values to be
represented in the image using the Low and
High spin boxes, respectively, or drag the
lower and upper indicators to the desired
positions along the scale slider.
5
To use the same scaling for Wavelength 2 that
you just selected for Wavelength 1, choose
Set W2 = W1.
OR
If you want all of the remaining wavelength
images to use the same scaling as the one
you selected in Step 4, choose Set All Equal.
OR
If you want to have a different scaling for the
remaining wavelength images, repeat Steps 3
and 4 for the other images. Where
appropriate, you can use the same scaling for
Wavelength 5 that you select for Wavelength
4, by choosing Set W5 = W4.
6
When you have finished, choose Close.
MetaFluor
193
Version 7.0
MetaFluor User’s Guide
Scale 16-Bit Images - Dialog Box Options
Select a Wavelength to Adjust Its Scaling
Selects the image that you want to configure.
Low
Specifies the darkest gray level for the image(s). When you select the Autoscale check
box, this option becomes the Lo% spin box.
High
Specifies the brightest gray level for the image(s). When you select the Autoscale check
box, this option becomes the Hi% spin box.
Autoscale
Configures the selected image to be autoscaled.
Lo%
Excludes a selected percentage of pixels in the image (not the percentage of gray levels
in the histogram) from the low (darker) end of the range of values being autoscaled. This
option is available only when the Autoscale check box has been selected.
Hi%
Excludes a selected percentage of pixels in the image (not the percentage of gray levels
in the histogram) from the high (brighter) end of the range of values being autoscaled.
This option is available only when the Autoscale check box has been selected.
Scale Slider
Selects a lower and upper gray value for the scaling range. Drag the indicators to the
desired positions along the slider to select the grayscale values.
Set W2 = W1
Configures Wavelengths 1 and 2 to use the same fixed scaling. If, for example,
Wavelength 1 is currently selected in the Select a Wavelength… table, this option will set
the scaling for Wavelength 2 to that currently selected for Wavelength 1. If you select
Wavelength 2 from the Select a Wavelength… table, the label on this command button
will change to "Set W1 = W2," and choosing the button will configure Wavelength 1 to
use the setting for Wavelength 2.
Set W5 = W4
Configures Wavelengths 4 and 5 to use the same fixed scaling. If, for example,
Wavelength 4 is currently selected in the Select a Wavelength… table, this option will set
the scaling for Wavelength 5 to that currently selected for Wavelength 4. If you select
Wavelength 5 from the Select a Wavelength… table, the label on this command button
will change to "Set W4 = W5," and choosing the button will configure Wavelength 4 to
use the setting for Wavelength 5.
Set All Equal
Configures all images to use the same fixed scaling. If you select the Autoscale check
box, and then choose Set All Wavelengths to the Same Scaling, this will have the same
effect as choosing Autoscale All Wavelengths.
MetaFluor
194
Version 7.0
MetaFluor User’s Guide
Autoscale All
Configures all images to be autoscaled.
Close
Closes the dialog box.
MetaFluor
195
Version 7.0
MetaFluor User’s Guide
Selecting a Video Device
MetaFluor
196
Version 7.0
MetaFluor User’s Guide
Selecting a Video Device
To select a video device, use the following procedure:
Step
Action
1
From the File menu, choose Select
Video/Camera for Acquisition. The Select
Video/Camera for Acquisition dialog box will
appear.
2
From the Video Driver drop-down list, select
the video device you want to use.
3
From the Video Channel drop-down list, select
the video channel to be used. The options you
see will depend on your hardware
configuration.
4
Choose OK.
MetaFluor
197
Version 7.0
MetaFluor User’s Guide
Select Video/Camera for Acquisition - Dialog Box
Options
Video Driver
Allows you to temporarily select a different video device from among those you currently
have installed in the Video Driver Manager.
Video Channel
Selects the video channel to be used. The options you see will depend on your hardware
configuration.
OK
Changes to the selected video device.
Cancel
Cancels the command.
MetaFluor
198
Version 7.0
MetaFluor User’s Guide
Video Cameras
MetaFluor
199
Version 7.0
MetaFluor User’s Guide
Experiment Control Panel (Run Experiment
Menu) - Video Camera and External Monitor
Contains the live video, reference image, and image and data acquisition
commands needed to run a new experiment using an analog video camera, a video
acquisition board.
The Experiment Control Panel dialog box is your "command center" for controlling new
experiments. Using it, you can adjust the camera's analog contrast and focus the microscope,
acquire reference images, specify image acquisition settings, and enable image saving and
data logging.
You can use the Focus command button to obtain continuous images while focusing the
microscope prior to starting the experiment. The Focus Video Using External Monitor dialog
box also contains controls for adjusting the analog contrast (white and black levels) while
monitoring for under- and oversaturation. As you focus the microscope, MetaFluor
continuously acquires and displays images which you can use to verify that your specimen is
visible and in focus. It is important to use the Focus command while you are focusing the
microscope, because what can be seen through the microscope's eyepiece is not always the
same as what the camera acquires.
Most of the options in the Experiment Control Panel are image and data acquisition controls.
These are used to enable image and data saving prior to starting your experiment. "LED"
indicators next to the Save Images and Save Ratios check boxes will indicate the saving
status of each Wavelength and Ratio image: gray indicates that saving is off, red indicates that
saving is on but that the particular Wavelength or Ratio image will not be saved, blue indicates
that saving is on and that the image will be saved, but not on every cycle, and green indicates
that the image will be saved on every cycle. When you have selected all of the necessary
options, the experiment can be run. You can enable background subtraction and shading
correction using the Reference Images command.
Before you start acquisition, spend a minute to make sure that Image Display Controls and
Configure Experiment are set appropriately for your experiment. You may also want to check
the Data Logging Preferences options (Preferences command, File menu) if you are logging
data. If you plan to use event marks or move regions while running the experiment, you may
want to open and position those dialog boxes before starting acquisition.
Note: This version of the Experiment Control Panel is unavailable in the MetaFluor Offline
system. Please see the description of the Playback Mode version.
See Also:
Experiment Control Panel:
For Video Camera with Computer's Monitor
For Playback
Image Display Controls - Using an External Video Monitor
Configure Experiment
MetaFluor
200
Version 7.0
MetaFluor User’s Guide
Preferences
Reference Images
MetaFluor
201
Version 7.0
MetaFluor User’s Guide
Adjusting the Image Using a Video Camera with
an External Video Monitor
To adjust the image while displaying live video on the external monitor, use the following
procedure.
Note: You can make separate analog adjustments for each video channel.
Step
Action
1
From the Run Experiment menu, choose
Experiment Control Panel. The Experiment
Control Panel will appear. The Status line will
indicate that you are using Live Video.
2
Choose Focus. The Focus Video Using
External Monitor dialog box will appear.
3
If an open shutter is needed, select the Open
Shutter check box, located on the left below
the Wavelength table.
4
Select Wavelength 1 from the Wavelength list.
This will display live video for Wavelength 1 on
the external video monitor. You should use
this image to focus the microscope.
5
Select Use Saturation Warning Markers to
display warning markers on the video monitor
to indicate areas of undersaturation (too dark-will be clipped to 0) and oversaturation (too
bright--will be clipped to maximum possible
value [255 for 8-bit images]). MetaFluor uses
the following colors for markers:
Dark Blue
Cyan
Yellow
Red
Undersaturated--too dark
Approaching undersaturation
Approaching oversaturation
Oversaturated--too bright.
6
The Scan Line Plot graphs the grayscale
values under a red horizontal scan line placed
over the live video image. To move the scan
line so that it displays the desired areas of
undersaturation or oversaturation, move the
vertical slider located to the left of the Scan
Line Plot.
7
Use the White Level and Black Level sliders at
the top of the dialog box to adjust the contrast
so that the scan line covers most of the
available grayscale values (displayed on the
graph's X-axis), without introducing the
Saturation Warning Markers on the video
monitor.
8
If you opened a shutter in Step 3, close it now
by clearing the Open Shutter check box.
9
If you want all wavelengths to use the same
settings, select the All Wavelengths Use Same
Analog Settings check box. Then skip to Step
MetaFluor
202
Version 7.0
MetaFluor User’s Guide
11.
OR
If you want to adjust the settings separately for
each wavelength, continue to Step 10.
10
After you have adjusted the White Level and
Black Level so that they are suitable for
Wavelength 1, select Wavelength 2 from the
Wavelength table. Then repeat Steps 3 - 8 for
Wavelength 2. You will probably need to
toggle between the two wavelengths to make
sure the analog adjustments are appropriate
for both. Repeat as necessary for the
remaining wavelength images.
11
Choose Close to return to the Experiment
Control Panel.
MetaFluor
203
Version 7.0
MetaFluor User’s Guide
Experiment Control Panel (Run Experiment
Menu) - Video Camera with Computer's Monitor
Contains the focusing and image and data acquisition commands needed to run a
new experiment using a video camera while displaying your data images in image
windows on your computer screen.
The Experiment Control Panel is your "command center" for controlling new experiments.
Using it, you can focus the camera, set image acquisition settings, and enable image saving
and data logging. If your camera has gain and offset controls, you can adjust these while
focusing the camera.
You can use the Focus command button to obtain continuous images while focusing the
microscope prior to starting the experiment. As you focus the microscope, MetaFluor
continuously acquires and displays images which you can use to verify that your specimen is
visible and in focus. It is important to use the Focus command while you are focusing the
microscope, because what can be seen through the microscope's eyepiece is not always the
same as what the camera acquires. The Focus command will summon the Focus dialog box,
which you can use to select a wavelength image to use for focusing. You can also adjust the
analog contrast of the image from this dialog box. Although you are displaying your acquired
data images in image windows on the computer monitor, you can display your focusing image
in either an image window on the computer monitor or you can display it on an external
monitor. This will be determined by whether or not you select the Check If an External Monitor
Is Attached… check box in the Video Camera Preferences dialog box (Preferences command,
File menu). The Focus dialog box that you see will depend on whether you are using an
external video monitor to view the focusing image.
The majority of the commands in the Experiment Control Panel are image and data acquisition
commands. Most are used prior to starting an experiment to define the acquisition. When you
have selected all of the necessary options, the experiment can be run. "LED" indicators next
to the Save Images and Save Ratios check boxes will indicate the saving status of each
Wavelength and Ratio image: gray indicates that saving is off, red indicates that saving is on
but that the particular Wavelength or Ratio image will not be saved, blue indicates that saving
is on and that the image will be saved, but not on every cycle, and green indicates that the
image will be saved on every cycle. You can enable background subtraction and shading
correction using the Reference Images command.
Before you start acquisition, spend a minute to make sure that Image Display Controls and
Configure Experiment are set appropriately for your experiment. You may also want to check
the Data Logging Preferences options (Preferences command, File menu) if you are logging
data. If you plan to use event marks or move regions while running the experiment, you may
want to open and position those dialog boxes before starting acquisition.
Note: This version of the Experiment Control Panel is unavailable in the MetaFluor Offline
system. Please see the description of the Playback Mode version.
See Also:
Experiment Control Panel:
For Video Camera and External Monitor
MetaFluor
204
Version 7.0
MetaFluor User’s Guide
For Video Camera with Other Video Board and External Monitor
For Playback
Reference Images
Image Display Controls - Using the Computer's Monitor
Preferences
Event Marks
MetaFluor
205
Version 7.0
MetaFluor User’s Guide
Experiment Control Panel - Dialog Box Options
(Video Camera with Computer's Monitor)
Status
Reports the length of time to the next acquisition, as set by Set Timelapse and the shutter
delay time in the Illumination Control dialog box (the Delay option). The message
"Running" occurs when an image is acquired or when the requested acquisition interval is
shorter than the time required to complete the acquisition cycle.
Log Data
Enables or disables data logging to an open, DDE-linked spreadsheet file and/or text file.
The status line next to Log Data will indicate if a file is open for saving data. If a data file
has not been opened prior to selecting Log Data, the Open Measurements File command
will be activated automatically so that you can open a file.
Save Images
Enables or disables wavelength image saving. The status line next to Save Images will
indicate if an .inf file is open. If an .inf file has not been opened prior to selecting Save
Images, the Open Save Images File command will be activated automatically so that you
can open an .inf file. "LED" indicators next to the Save Images check box will indicate the
saving status of each Wavelength image: gray indicates that saving is off, red indicates
that saving is on but that the particular Ratio image will not be saved, blue indicates that
saving is on and that the image will be saved, but not on every cycle, and green indicates
that the image will be saved on every cycle.
Save Ratios
Enables or disables ratio image saving. The status line next to Save Ratios will indicate
when you can save ratio images. "LED" indicators next to the Save Ratios check box will
indicate the saving status of each Ratio image: gray indicates that saving is off, red
indicates that saving is on but that the particular Ratio image will not be saved, blue
indicates that saving is on and that the image will be saved, but not on every cycle, and
green indicates that the image will be saved on every cycle. The Open Ratios File
command will be activated automatically when you select Save Ratios.
F4: Acquire
Acquires image pairs and ratios them according the display and acquisition options.
When this command is chosen, the text on its button will change to "F2: Pause."
F2: Pause
Pauses acquisition at the end of the present cycle. You can also press the [F2] key on
the keyboard to stop acquisition.
Set Timelapse
Sets the time between acquisitions and the number of acquisition to be completed. Select
0 for the Timelapse Interval if you do not want to use timelapsing. Select 0 for the
Number of Acquisitions if you want acquisition to continue until you choose Pause
Acquisition.
Zero Clock
Same as the Zero Clock command in the Run Experiment menu.
MetaFluor
206
Version 7.0
MetaFluor User’s Guide
Focus
Opens the Focus dialog box. The dialog box that you see will depend on whether you are
using an external video monitor to view the focusing image. This will in turn be
determined by whether or not you select the Check If an External Monitor Is Attached…
check box in the Video Camera Preferences dialog box (Preferences command, File
menu).
Cycle and CPS
One cycle is the total time required to acquire both wavelength images (with background
subtraction and/or shading correction), display them, ratio them, display the ratio image,
draw regions (if selected), make measurements, plot measurements on graphs, log data,
and save images. The CPS calculation is updated every 10 uninterrupted cycles.
Close
Closes the dialog box.
MetaFluor
207
Version 7.0
MetaFluor User’s Guide
Focusing the Video Camera Using the Computer
Monitor
To focus the image when you are using the computer monitor to display both the focusing
and data images, use the following procedure:
Step
Action
1
From the Experiment Control Panel, choose
Focus. The Focus dialog box will appear.
MetaFluor will temporarily close all other
dialog boxes that are open.
2
From the Wavelength table on the right side of
the dialog box, select the wavelength image
you want to use for focusing.
3
From the Frames to Average spin box, select
the number of frames to average together in
the focusing image. Select 1 for no averaging.
(If you change the settings from those you
configured using the Configure Acquisition
command, you can direct MetaFluor to use the
new settings for acquiring the data images by
choosing Store for Acquisition.)
OR
If you want to use the same settings for
averaging as you configured for the data
images with the Configure Acquisition
command, choose Use Wave Settings.
4
If you are using an external shutter, select
Open on Start Focus. Select Close After
Acquire if you want the shutter to close
immediately after acquiring a focusing image.
5
When you are ready to start acquiring focus
images, choose the Start Focusing button. If
you are using a shutter, choose Toggle
Shutter to open the shutter. Choose it again to
close the shutter. The colored box to the right
of the button will indicate when the shutter is
open or closed. After you choose Start
Focusing, a new Interactive option group will
appear below the Acquisition Region option
group (see Step 6, middle option).
You can pause acquisition at any time by
choosing F2: Pause Focus or by pressing the
[F2] function key. Resume focusing by
choosing F4: Resume Focus or by pressing
the [F4] function key.
6
If you want to use a subregion of the image for
focusing, use the box-in-box display or the
Left, Top, Width, and Height spin boxes to
specify the size and location of the focusing
subregion. Choose CTR to place the center of
the region in the center of the image.
Alternatively, choose Full Chip to use the
MetaFluor
208
Version 7.0
MetaFluor User’s Guide
entire image. If you want to use this newly
configured region for acquisition as well,
choose Store as Acq Rgn.
OR
Choose the Select button in the new
Interactive option group that appears in the
upper left area of the Focus dialog box. This
will display a green region of interest on the
Focus image window. Resize and reposition
the region as needed with your cursor and
choose OK to fill the entire Focus image
window with the selected region.
OR
If you want to use the same acquisition region
settings as you configured for the data image
itself with the Configure Acquisition command,
choose Use Acq. Region.
7
While monitoring the focusing image, adjust
the microscope to provide the optimum focus.
8
If you want to adjust the contrast in the image,
use the White Level and Black Level sliders to
adjust the camera's white level and black level
settings.
Select Use Saturation Warning Markers to
display warning markers on the focusing
image to indicate areas of undersaturation (too
dark--will be clipped to 0) and oversaturation
(too bright--will be clipped to maximum
possible value [255 for 8-bit images]).
MetaFluor uses the following colors for
markers:
Dark Blue
Cyan
Yellow
Red
9
Undersaturated--too dark
Approaching undersaturation
Approaching oversaturation
Oversaturated--too bright.
If you want to view a graphical display of the
intensity values in the image while adjusting
the contrast, select the Update check box,
select either Histogram or Scanline from the
drop-down list, and choose the image's bitdepth from the Depth list.
The histogram or line graph can be configured
as needed from the Down Arrow configuration
menu.
10
If you want all wavelengths to use the same
contrast settings, select the All Wavelengths
Use Same Analog Settings check box. Then
skip to Step 12.
OR
If you want to adjust the settings separately for
each wavelength, continue to Step 11.
11
After you have adjusted the White Level and
Black Level so that they are suitable for
Wavelength 1, select Wavelength 2 from the
Wavelength table. Then repeat Steps 3 - 9 for
Wavelength 2. You will probably need to
MetaFluor
209
Version 7.0
MetaFluor User’s Guide
toggle between the two wavelengths to make
sure the analog adjustments are appropriate
for both. Repeat as necessary for the
remaining wavelength images.
12
When you have finished, toggle the shutter
closed (if necessary) and choose Stop
Focusing.
13
Choose Close to return to the Experiment
Control Panel.
MetaFluor
210
Version 7.0
MetaFluor User’s Guide
Focus - Dialog Box Options (Computer Monitor
Display of Focus Image from Video Camera with
No External Monitor)
Binning
Configures pixel binning for acquisition of focusing images from a digital camera. This
option will be unavailable.
Left
Defines and displays the leftmost point of the region.
Top
Defines and displays the topmost point of the region.
Width
Defines and displays the width of the region.
Height
Defines and displays the height of the region.
Use Acq Region
Directs MetaFluor to use the acquisition region settings from the Configure Acquisition
dialog box for the focusing image.
Store as Acq Rgn
Directs MetaFluor to use the current Focus dialog box focusing acquisition region for
acquisition of the data images. These settings will be stored in the Configure Acquisition
dialog box.
Select (Interactive)
Displays a green region of interest on the Focus image window. After you reposition and
resize the region around the area in the image that is of greatest importance, choosing
OK will zoom that area to fill the entire Focus image window. A green "LED" will flash
beneath the OK and Cancel buttons while the Select function is active. The Interactive
option group (Select, OK, and Cancel) appears when you choose Start Focusing.
OK (Interactive)
Accepts the green region of interest drawn in the Focus image window when you choose
the Select button, and zooms the selected area of the image to fill the entire Focus image
window. The Interactive option group (Select, OK, and Cancel) appears when you
choose Start Focusing.
Cancel (Interactive)
Cancels the selection of the image area selected by the green region of interest, and
removes the region from the Focus image window.
<<
Decreases the size of the focusing image's acquisition subregion by half.
MetaFluor
211
Version 7.0
MetaFluor User’s Guide
CTR
Centers the focusing image acquisition subregion.
>>
Doubles the size of the focusing image's acquisition subregion.
Full Chip
Specifies that the entire camera chip be used as the focusing image's acquisition
subregion.
Box-in-Box Display
Allows you to define a region of interest for focusing. Drag the outline of the smaller box
to resize and position it, just as you would for a data acquisition subregion.
Frames to Average
Selects the number of frames to be averaged for each focusing image.
Use Wave Settings
Directs MetaFluor to use the frame averaging settings from the Configure Acquisition
dialog box for the focusing image.
Store for Acquisition
Directs MetaFluor to use the current Focus dialog box camera settings for acquisition of
the data images. These settings will be stored in the Configure Acquisition dialog box.
Update
Enables continuous updating of the intensity values in the histogram or line graph while
you configure contrast.
Histogram/Scanline Selection List
Selects a display mode for the continously updating intensity graph: Histogram or
Scanline. If you select Histogram, the gray values in the entire image (or focus region)
will be numerically represented in the histogram bins. If you select Scanline, you can
select the location of the red scanline in the image by dragging it up or down in the image
window, and the gray values under the line will be represented in a line graph.
Depth
Selects a range of intensity values for display in the intensity graph. The value should
reflect the bit-depth of the camera. Select 8-Bit for a range of 0 - 256, 10-Bit for a range
of 0 - 1024, or 12-Bit for a range of 0 - 4096.
Intensity Graph
Displays the continuously updated intensity values in the focusing image in either a
histogram or line graph.
Down Arrow Configuration Menu
Allows you to configure the intensity graph. You can also print the graph or copy it to the
Clipboard. (For more information, see Graphs).
Wavelength
MetaFluor
212
Version 7.0
MetaFluor User’s Guide
Selects a wavelength image for display of the focusing image.
Toggle Shutter
Toggles the shutter open and closed. The colored box to the right of the button will
indicate when the shutter is open or closed.
Open on Start Focus
Directs MetaFluor to open the shutter at the start of the focus image's acquisition cycle.
Close After Acquire
Directs MetaFluor to close the shutter at the end of the focus image's acquisition cycle.
Leave this check box cleared to perform continuous acquisition.
White Level
Adjusts the white level (signal voltage representing the brightest gray level in the image)
of the focusing image.
Black Level
Adjusts the black level (signal voltage representing the darkest gray level in the image) of
the focusing image.
Use Saturation Markers
Displays saturation markers on the video monitor and the video image, indicating areas
of undersaturation (dark blue--too dark, will be clipped to zero) and oversaturation (red-too bright, will be clipped to 255).
All Wavelengths Use Same Analog Settings
When selected, this check box directs MetaFluor to use the same white level and black
level settings for all wavelengths. If you clear this check box, you can configure the
settings separately for each wavelength that you select from the Wavelength table. The
default state for the check box is to be selected.
Start Focusing / Stop Focusing
Starts and stops the acquisition of images for focusing.
F2: Pause Focus
Pauses acquisition of the focusing images.
F4: Resume Focus
Resumes acquisition of the focusing images.
Close
Closes the dialog box.
MetaFluor
213
Version 7.0
MetaFluor User’s Guide
Experiment Control Panel - Dialog Box Options
(Video Camera with External Monitor)
Status
Reports the length of time to the next acquisition, as set by Set Timelapse and the shutter
delay time in the Illumination Control dialog box (the Delay option). The message
"Running" occurs when an image is acquired or when the requested acquisition interval is
shorter than the time required to complete the acquisition cycle.
Log Data
Enables or disables data logging to an open, DDE-linked spreadsheet file and/or text file.
The status line next to Log Data will indicate if a file is open for saving data. If a data file
has not been opened prior to selecting Log Data, the Open Measurements File command
will be activated automatically so that you can open a file.
Save Images
Enables or disables wavelength image saving. The status line next to Save Images will
indicate if an .inf file is open. If an .inf file has not been opened prior to selecting Save
Images, the Open Save Images File command will be activated automatically so that you
can open an .inf file. "LED" indicators next to the Save Images check box will indicate the
saving status of each Wavelength image: gray indicates that saving is off, red indicates
that saving is on but that the particular Wavelength image will not be saved, blue
indicates that saving is on and that the image will be saved, but not on every cycle, and
green indicates that the image will be saved on every cycle.
Save Ratios
Enables or disables ratio image saving. The status line next to Save Ratios will indicate
when you can save ratio images. "LED" indicators next to the Save Ratios check box will
indicate the saving status of each Ratio image: gray indicates that saving is off, red
indicates that saving is on but that the particular Ratio image will not be saved, blue
indicates that saving is on and that the image will be saved, but not on every cycle, and
green indicates that the image will be saved on every cycle. The Open Ratios File
command will be activated automatically when you select Save Ratios.
F4: Acquire
Acquires wavelength image and ratios them according the display and acquisition
options. When you choose this command, its label will change to "F2: Pause."
Set Timelapse
Sets the time between acquisitions and the number of acquisition to be completed. Select
0 for the Timelapse Interval if you do not want to use timelapsing. Select 0 for the
Number of Acquisitions if you want acquisition to continue until you choose F2: Pause.
F2: Pause
Pauses acquisition at the end of the present cycle. You can also press the [F2] key on
the keyboard to stop acquisition.
Zero Clock
Same as the Zero Clock command in the Run Experiment menu.
MetaFluor
214
Version 7.0
MetaFluor User’s Guide
Focus
Opens the Focus Video Using External Monitor dialog box, which you can use to
adjust the white and black levels and to control acquisition while you focus the
microscope.
Cycle and CPS
One cycle is the total time required to acquire both wavelength images (with background
subtraction and/or shading correction), display them, ratio them, display the ratio image,
draw regions (if selected), make measurements, plot measurements on graphs, log data,
and save images. The CPS calculation is updated every 10 uninterrupted cycles.
Close
Closes the dialog box.
MetaFluor
215
Version 7.0
MetaFluor User’s Guide
Analog Contrast - Dialog Box Options
White Level
Adjusts the white level (signal voltage representing the brightest gray level in the image)
of the incoming image on the video monitor.
Black Level
Adjusts the black level (signal voltage representing the darkest gray level in the image) of
the incoming image on the video monitor.
Use Saturation Markers
Displays saturation markers on the video monitor and the video image, indicating areas
of undersaturation (dark blue--too dark, will be clipped to zero) and oversaturation (red-too bright, will be clipped to 255).
More >>
Expands the dialog box to display the scan line plot.
Less <<
Condenses the dialog box.
Scan Line Plot
Graphs the grayscale values under the horizontal scan line that is placed over the video
image window. The vertical slider located to the left of the scan line plot determines the
areas of undersaturation or oversaturation that have been plotted.
Show Scan Line
Selecting this check box displays the scan line directly on the external video monitor.
Note: Doing so may slow down your video display.
Down Arrow Configuration Menu
Allows you to configure the scan line plot graph. You can also print the graph or copy it to
the Clipboard. (For more information, see Graphs).
Close
Closes the dialog box.
MetaFluor
216
Version 7.0
MetaFluor User’s Guide
Focusing the Video Camera Using an External
Video Monitor
To focus the image using an external video monitor when you are displaying your data
images on the computer monitor, use the following procedure:
Step
Action
1
From the Experiment Control Panel, choose
Focus. The Focus dialog box will appear.
MetaFluor will temporarily close all other
dialog boxes that are open.
2
From the Switch To radio button group, select
which wavelength image you want to use for
focusing.
3
When you are ready to begin focusing, select
the Open Shutter check box if you have an
external shutter attached to the camera.
4
Focus your microscope.
5
If you want to adjust the contrast in the image,
continue to Step 6.
OR
If you do not need to adjust the image
contrast, skip to Step 11.
6
Choose Adjust Analog. The Analog Contrast
dialog box will appear.
7
Select Use Saturation Warning Markers to
display warning markers on the video monitor
to indicate areas of undersaturation (too dark-will be clipped to 0) and oversaturation (too
bright--will be clipped to maximum possible
value [255 for 8-bit images]). MetaFluor uses
the following colors for markers:
Dark Blue
Cyan
Yellow
Red
8
Undersaturated--too dark
Approaching undersaturation
Approaching oversaturation
Oversaturated--too bright.
The Scan Line Plot graphs the grayscale
values under a red horizontal scan line placed
over the live video image. To display the scan
line on your video monitor, select the Show
Scan Bar check box so that a check mark
appears in the box.
AND
To move the scan line so that it displays the
desired areas of undersaturation or
oversaturation, move the vertical slider located
to the left of the Scan Line Plot.
9
Use the White Level and Black Level sliders at
the top of the dialog box to adjust the contrast
so that the scan line covers most of the
available grayscale values (displayed on the
MetaFluor
217
Version 7.0
MetaFluor User’s Guide
graph's X-axis), without introducing the
Saturation Warning Markers on the video
monitor.
10
After you have adjusted the White Level and
Black Level so that they are suitable for the
selected wavelength image, select a different
wavelength image from the Experiment
Control Panel's Switch To group. Then repeat
Steps 6 - 9 for that image. You will probably
need to toggle between the two wavelengths
to make sure the analog adjustments are
appropriate for both.
Repeat as necessary for any other
wavelengths, selecting them from the Switch
To group and repeating Steps 6 - 9.
11
When you have finished, clear the Open
Shutter check box. Then choose Close to
return to the Experiment Control Panel.
MetaFluor
218
Version 7.0
MetaFluor User’s Guide
Focus Video Using External Monitor - Dialog Box
Options
Wavelength
Selects a wavelength image, so that you can adjust the analog contrast for each
wavelength and focus the microscope while in Live Video mode.
Open Shutter
Opens the shutter. If you have the acquisition wavelengths configured to use different
MetaDevices, you will be able to use separate Open Shutter settings for each
wavelength. This allows you to operate two shutters, one from each MetaDevice.
All Wavelengths Use Same Analog Settings
When selected, this check box directs MetaFluor to use the same white level and black
level settings for all wavelengths. If you clear this check box, you can configure the
settings separately for each wavelength that you select from the Wavelength table. The
default state for the check box is to be selected.
White Level
Adjusts the white level (signal voltage representing the brightest gray level in the image)
of the incoming image on the video monitor.
Black Level
Adjusts the black level (signal voltage representing the darkest gray level in the image) of
the incoming image on the video monitor.
Use Saturation Markers
Displays saturation markers on the video monitor and the video image, indicating areas
of undersaturation (dark blue--too dark, will be clipped to zero) and oversaturation (red-too bright, will be clipped to 255).
Show Graph >>
Expands the dialog box to display the scan line plot.
Hide Graph <<
Condenses the dialog box.
Scan Line Plot
Graphs the grayscale values under the horizontal scan line that is placed over the video
image window. The vertical slider located to the left of the scan line plot determines the
areas of undersaturation or oversaturation that have been plotted.
Down Arrow Configuration Menu
Allows you to configure the scan line plot graph. You can also print the graph or copy it to
the Clipboard. (For more information, see Graphs).
Close
Closes the dialog box.
MetaFluor
219
Version 7.0
MetaFluor User’s Guide
Focus - Dialog Box Options (Computer Monitor
Display of Focus Image from Video Camera with
External Monitor Present)
Switch To
Selects a wavelength image for focusing or adjusting contrast.
Open Shutter
Toggles the shutter open and closed.
Adjust Analog
Opens the Analog Contrast dialog box.
Close
Closes the dialog box.
MetaFluor
220
Version 7.0
MetaFluor User’s Guide
Image Display Controls - Dialog Box Options
(Using an External Video Monitor)
Image
Selects the wavelength image that you want to threshold. This option affects only the
threshold settings.
Low
Use this text box or the left handle of the slider to specify the lowest gray value in the
selected image.
High
Use this text box or the right handle of the slider to specify the highest gray value in the
selected image.
Image Display Mode
Specifies the display mode for the wavelength images as either Monochrome Images or
Pseudocolor Images.
Minimum
Selects the minimum ratio value for the ratio image.
Maximum
Selects the maximum ratio value for the ratio image.
Ratio Display
Selects the desired IMD display for the ratio image. The IMD display will use a custom
look-up table that consists of hues corresponding to the selected number of ratios, each
having the specified number of intensities. For example, a ratio image that was built using
8 Ratios with 32 Intensities will have 8 distinct hues, each with 32 intensities, visible in its
contrast/threshold slider (as opposed to the continuous range of values visible for a
pseudocolor image).
IMD Intensity
Selects the source for the intensity values. Select the brighter wavelength image. If you
don't know which image will be brighter, select Average Num. and Denom. instead.
Apply
Applies the image display control settings. The settings will take effect the next time you
acquire images.
Close
Closes the dialog box.
MetaFluor
221
Version 7.0
MetaFluor User’s Guide
Image Display Controls - Dialog Box Options
(Using the Computer's Monitor)
Window
Selects the wavelength or ratio image for which you want to change the image display
settings.
Display
Specifies the display mode for the wavelength images as either Monochrome or
Pseudocolor. Specifies the display mode for the ratio image as Monochrome,
Pseudocolor, or IMD Display, and displays the appropriate options for other image
display settings based on this selection.
Brightness
Allows you to adjust the overall brightness of an image. The default value is 50. Minimum
brightness is 0; maximum brightness is 100.
Contrast
Allows you to expand the range of grayscale levels displayed for an image. The default
value is 50. Increasing the value raises the contrast. Maximum contrast (100) produces a
binary image. Contrast can not be decreased.
Low Thresh
Defines the lowest gray value in the selected wavelength image.
High Thresh
Defines highest lowest gray value in the selected wavelength image.
IMD Display
If you have selected IMD Display as the Display and are displaying ratio images as 8-bit
images (Preferences : General command, File menu), use this option to select the
desired IMD display for the ratio image using this option. The IMD display will use a
custom look-up table that consists of hues that correspond to the selected number of
ratios, each having the specified number of intensities. For example, a ratio image that
was built using 8 Ratios with 32 Intensities will have eight distinct hues, each with 32
intensities, visible in its contrast/threshold slider (as opposed to the continuous range of
values visible for a pseudocolor image).
IMD Intensity
Selects the source for the intensity values in the ratio image. Select the brighter
wavelength image. If you don't know which image will be brighter and you have selected
an 8-bit ratio display (Preferences : General command, File menu), select Average Num.
and Denom. instead. If you have selected a 24-bit ratio display (Preferences: General
command, File menu), you will also have the option of selecting either the mean intensity
(Average of Wavelengths) or the maximum intensity (Maximum of Wavelengths) of all
wavelength images as the intensity component. The IMD Intensity option will appear only
when you select IMD Display from the Display drop-down list.
IMD Overlay
MetaFluor
222
Version 7.0
MetaFluor User’s Guide
Selects the source for the saturation component of 24-bit ratio images. You can select
any of the wavelength images. If you select None, the maximum saturation will be used.
The IMD Overlay option will appear only when you select IMD Display from the Display
drop-down list and configure MetaFluor to use a 24-bit ratio image display (Preferences :
General command, File menu).
Min. Ratio
Selects the minimum ratio value for the ratio image.
Max. Ratio
Selects the maximum ratio value for the ratio image.
Close
Accepts the current settings and closes the dialog box.
MetaFluor
223
Version 7.0
MetaFluor User’s Guide
Reference Images
MetaFluor
224
Version 7.0
MetaFluor User’s Guide
Reference Images - External Monitor Display (Run
Experiment Menu)
Saves or loads background reference images and white (shading) reference
images for correction of images being acquired or played back and displayed on
an external video monitor. Can also create artificial background images using
specified gray levels.
Use this command to save background and/or white (shading) reference images that you have
acquired using the Experiment Control Panel. After you have saved these images, you can
use the Reference Images command to load them later for background subtraction and
shading correction. You can also use this command to create artificial background images,
each with their own specified grayscale value. You may want to do so to subtract an offset
from each wavelength.
Note: You will need to use a different Reference Images dialog box when displaying images
in image windows on the computer desktop.
See Also:
Experiment Control Panel
Reference Images - Window Display
MetaFluor
225
Version 7.0
MetaFluor User’s Guide
Saving Reference Images (External Monitor
Display)
To save a set of reference images, use the following procedure:
Step
Action
1
Acquire the desired reference images using
either Acq. Background or Acquire Shading in
the Experiment Control Panel.
2
From the Run Experiment menu, choose
Reference Images. The Reference Images
dialog box will appear.
3
If you want to save a background image,
choose the Save to Disk button below the
Background References label. The Save
Backgrounds dialog box will appear.
OR
Choose Save to Disk below the White
References label. The Save White Reference
dialog box will appear.
4
Type a new file name in the File Name text
box for the first of the images (or select an
icon for an existing file to overwrite it).
MetaFluor will append the number (1, 2, etc.)
to the end of the file name to indicate the
wavelength.
If the desired folder name is not listed at the
top of the dialog box, use the Save In list or Up
One Level button to locate the correct drive
and folder.
Choose Save to close the dialog box.
5
If you chose an existing file name, a dialog box
will inform you that the file already exists.
Select No if you want to select another file
name. Otherwise, Select Yes.
MetaFluor
226
Version 7.0
MetaFluor User’s Guide
Loading Reference Images (External Monitor
Display)
To load a set of reference images, use the following procedure:
Step
Action
1
From the Run Experiment menu, choose
Reference Images. The Reference Images
dialog box will appear.
2
To load a background image or pair of images,
choose Load from Disk below the Background
References text label. The Load Background
dialog box will appear.
3
Choose Select File. A file selection dialog box,
also entitled Load Background, will appear.
4
Select the desired image file. If the appropriate
folder name is not listed at the top of the dialog
box, use the Look In list of Up One Level
button to change to the correct location.
AND
Choose Open. The file selection dialog box will
close.
5
From the Load Background dialog box, choose
OK. The Reference Images dialog box will
reappear.
6
To load a shading correction (white reference)
image or pair of images, choose Load from
Disk below the Shading References text label.
The Load Shading dialog box will appear.
7
Choose Select File. A file selection dialog box,
also entitled Load Shading, will appear.
8
Select the desired image file. If the appropriate
folder name is not listed at the top of the dialog
box, use the Look In list of Up One Level
button to change to the correct location.
AND
Choose Open. The file selection dialog box will
close.
9
From the Load Shading dialog box, choose
OK. The Reference Images dialog box will
reappear.
10
Choose Close.
MetaFluor
227
Version 7.0
MetaFluor User’s Guide
Reference Images - Dialog Box Options (External
Monitor Display)
Subtract Backgrounds (playback mode only)
Enables background subtraction for the images being played back.
Load from Disk (Background, acquisition or playback mode)
Loads previously saved background reference images from disk.
Save to Disk (Background, acquisition mode only)
Saves the current set of background reference images acquired using the Experiment
Control Panel command to disk.
Create Backgrounds
Creates artificial background images that consist of specified gray levels. You can select
separate gray levels to use for each wavelength. This option is useful for subtracting an
offset from each image. When you use this command, it replaces the last pair of
background reference images acquired using the Experiment Control Panel with the new
artificial background images.
Correct Shading (playback mode only)
Enables shading correction for the images being played back.
Load from Disk (Shading, acquisition or playback mode)
Loads previously saved white (shading) reference images from disk.
Save to Disk (Shading, acquisition mode only)
Saves to disk the current set of white (shading) reference images acquired using the
Experiment Control Panel.
View Backgrounds and References (playback mode only)
Saves to disk the current sets of backgrounds and white (shading) reference images
acquired using the Experiment Control Panel.
Close
Closes the dialog box.
MetaFluor
228
Version 7.0
MetaFluor User’s Guide
Reference Images - Computer Window Display
(Run Experiment Menu)
Creates, loads, displays, saves, or discards background and shading reference
images for correction of images being acquired or played back and displayed in
image windows on the computer desktop. Enables background subtraction and
shading correction. Creates artificial background images using specified gray
levels.
Use this command to enable background subtraction and shading correction. You can
acquire, load, display, save, or discard background reference images or white (shading)
reference images. You can also use this command to create artificial background images,
each with their own specified gray level value. You may want to do so when you need to
subtract a different offset from each wavelength. You can disable background subtraction
and/or shading correction by clearing the Subtract Backgrounds or Correct Shading check
boxes.
The Acquire button in the Background References group of command buttons acquires a
background reference image for all wavelength images for which you have selected Image
from the Background drop-down lists. Similarly, the Acquire button in the Shading References
group of command buttons acquires a shading correction image (also called a "white
reference" image) for each wavelength image for which you have selected Image from the
corresponding Shading drop-down list. The View buttons display the pertinent acquired
images in image windows. When you choose a View button, it will switch to a Hide button. The
image windows can be hidden using the Hide buttons.
Note: If you acquire reference images and then change the size of the acquisition region
(Configure Acquisition command, Configure menu), MetaFluor will detect mismatches
between the sizes of the reference and data images. Any mismatched reference images will
be discarded, and a message box will be displayed that informs you of this.
Note: If you are acquiring images with a digital camera and have already acquired reference
(background subtraction or shading correction) images, and you then change the binning
setting in the Configure Acquisition dialog box, MetaFluor will check for mismatches
between the binning setting of the reference and data images. If a mismatch is detected, any
mismatched reference images will be discarded, and a message box will be displayed that
informs you of this.
WARNING:
The Discard buttons delete the reference images from the temporary memory buffer that
MetaFluor uses to store the reference images while you are working on them. If you simply
don't want to see the reference images on your computer monitor, choose the Hide buttons
instead.
Note: You will need to use a different Reference Images dialog box when displaying images
on an external video monitor.
See Also:
Experiment Control Panel
MetaFluor
229
Version 7.0
MetaFluor User’s Guide
Reference Images - External Monitor Display
MetaFluor
230
Version 7.0
MetaFluor User’s Guide
Configuring Background and Shading Correction
(Computer Window Display)
To configure background subtraction and shading correction, use the following
procedure:
Step
Action
1
From the Run Experiment menu, choose
Reference Images. The Reference Images
dialog box will appear.
2
If you are configuring background subtraction
for the image series, select the Subtract
Backgrounds check box.
OR
If you only want to correct shading, skip to
Step 4.
3
For each wavelength image, select the method
of background subtraction you want to use
from its corresponding Background drop-down
list. Select
Image if you want to use an image that you
already have on disk or one that you are about
to acquire.
Constant if you want to simply reduce the
entire image by a specific number of gray
levels. When you select this option, a spin box
will appear in the Parameter column, from
which you can select the gray value.
Region if you want to subtract the average
gray value in a region of interest that you have
defined on the image. When you select this
option, a spin box will appear in the Parameter
column, from which you can select the number
corresponding to the region. (You must first
define the regions.)
4
If you are configuring shading correction for
the image series, select the Correct Shading
check box.
OR
If you do not want to configure shading
correction, skip to Step 7.
5
For each wavelength image, select the method
of shading correction you want to use from its
corresponding Shading drop-down list. Select
Image if you want to use an image that you
already have on disk or one that you are about
to acquire, or
None for wavelength images for which you do
not want to perform shading correction.
6
If you selected Image for background
subtraction (Step 3) or for shading correction
MetaFluor
231
Version 7.0
MetaFluor User’s Guide
(Step 5), follow the procedure for acquiring
and saving new reference images or for
loading previously stored reference
images.
7
When you have finished, choose Close.
MetaFluor
232
Version 7.0
MetaFluor User’s Guide
Acquiring and Saving New Reference Images
(Computer Window Display)
To acquire reference images for background subtraction or shading correction, use the
following procedure.
Step
1
Action
If you are acquiring background subtraction
images, set up your equipment to acquire the
background reference images. Now continue
to Step 2.
OR
If you are acquiring only shading correction
images, skip immediately to Step 4.
2
Choose Acquire from the Background
References command button group. MetaFluor
will acquire background images for each
wavelength image for which you have selected
Image from the corresponding Background
drop-down list.
Note: You can choose the View button to
display the background images in image
windows on the computer monitor. The View
button will change to a Hide button, which you
can use to close the image.
3
To save the new background images, choose
Save from the Background Subtraction option
group. The Save Background dialog box will
appear. Choose Load File.
A file selection dialog box, also entitled Save
Background, will appear. Type a name for the
new image in the File Name text box and
choose Save. The file selection dialog box will
close.
Now choose OK from the Load Background
dialog box to return to the Reference Images
dialog box will reappear.
4
If you are acquiring shading images, set up
your equipment to acquire the shading
reference images.
5
Choose Acquire from the Shading References
command button group. MetaFluor will acquire
background images for each wavelength
image for which you have selected Image from
the corresponding Background drop-down list.
Note: You can choose the View button to
display the shading images in image windows
on the computer monitor. The View button will
change to a Hide button, which you can use to
close the image.
6
To save the new shading images, choose
Save from the Shading Correction option
MetaFluor
233
Version 7.0
MetaFluor User’s Guide
group. The Save Shading dialog box will
appear. Choose Load File.
A file selection dialog box, also entitled Save
Shading, will appear. Type a name for the new
image in the File Name text box and choose
Save. The file selection dialog box will close.
Now choose OK from the Save Shading dialog
box to return to the Reference Images dialog
box will reappear.
MetaFluor
234
Version 7.0
MetaFluor User’s Guide
Loading Previously Stored Reference Images
(Computer Window Display)
To load reference images for background subtraction and shading correction, use the
following procedure:
Step
Action
1
If you are loading a set of background
subtraction images, choose Load from the
Background References command button
group. The Load Background dialog box will
appear.
2
Choose Load File. A file selection dialog box,
also entitled Load Background, will appear.
3
Select the desired background reference
image set. If necessary, use the Look In list or
Up One Level button to change the current
directory location to the correct folder.
AND
Choose Open. The background reference
image set will be loaded and the file selection
dialog box will close.
4
From the Load Background dialog box, choose
OK. The Reference Images dialog box will
reappear.
5
To load a shading correction (white reference)
image set, choose Load from the Shading
References command button group. The Load
Shading dialog box will appear.
6
Choose Load File. A file selection dialog box,
also entitled Load Shading, will appear.
7
Select the desired shading reference image
set. If necessary, use the Look In list or Up
One Level button to change the current
directory location to the correct folder.
AND
Choose Open. The shading reference image
set will be loaded and the file selection dialog
box will close.
8
From the Load Shading dialog box, choose
OK. The Reference Images dialog box will
reappear.
MetaFluor
235
Version 7.0
MetaFluor User’s Guide
Reference Images - Dialog Box Options
(Computer Window Display)
Subtract Backgrounds
Enables background subtraction. Clear this check box to disable background subtraction.
Correct Shading
Enables shading correction. Clear this check box to disable shading correction.
Wavelength
This column indicates the wavelength image for which you are configuring background
subtraction and/or shading correction.
Background
Selects the method of background subtraction you want to use:
Image uses an image that you already have on disk or one that you are about to acquire.
Constant will subtract the number of gray levels specified by the Parameter spin box from
each pixel in the wavelength intensity image.
Region subtracts the average gray value in the region specified by the Parameter spin box
from each pixel in the wavelength intensity image.
None disables background subtraction for just the corresponding wavelength image.
Parameter (Backgrounds group)
The items that appear in this field will depend on the Background selection for the
corresponding wavelength:
If you selected Image, static text will be displayed, indicating either (In memory) if an image
has been loaded, or (No image) if the image has not yet been loaded.
If you selected Constant, a spin box will be displayed, from which you can select a gray value
to be subtracted from each pixel in the wavelength intensity image.
If you selected Region, a spin box will be displayed, from which you can select the number
corresponding to the region of interest whose average gray value will be subtracted from each
pixel in the wavelength intensity image.
If you selected None, static text indicating "n/a" will be displayed.
Shading
Selects the method of shading correction you want to use:
Image uses an image that you already have on disk or one that you are about to acquire.
None disables shading correction for just the corresponding wavelength image.
Parameter (Shading group)
The items that appear in this field will depend on the Shading selection for the
corresponding wavelength:
MetaFluor
236
Version 7.0
MetaFluor User’s Guide
If you selected Image, static text will be displayed, indicating either (In memory) if an image
has been loaded, or (No image) if the image has not yet been loaded.
If you selected None, static text indicating "n/a" will be displayed.
Acquire (Background References)
Acquires a background reference image for each wavelength image for which you
selected Image from the corresponding Background drop-down list.
Load (Background References)
Loads a set of previously saved background reference images.
View (Background References)
Displays the acquired or loaded background images in separate desktop image windows.
When you choose this button, its label will change to "Hide."
Hide (Background References)
Hides the background images from view. This is useful when you want to minimize the
number of image windows open on your workspace but do not want to discard the
background images.
Save (Background References)
Saves the newly acquired background images to disk.
Discard (Background References)
Deletes the background images from the temporary memory buffer that MetaFluor uses
to store reference images while you are working on them. If you simply do not want to
see the reference image on your workspace, you should choose Hide.
Acquire (Shading References)
Acquires a shading reference image for each wavelength image for which you selected
Image from the corresponding Shading drop-down list.
Load (Shading References)
Loads a set of previously saved shading reference images.
View (Shading References)
Displays the acquired or loaded shading images in separate desktop image windows.
When you choose this button, its label will change to "Hide."
Hide (Shading References)
Hides the shading images from view. This is useful when you want to minimize the
number of image windows open on your workspace but do not want to discard the
shading images.
Save (Shading References)
Saves the newly acquired shading images to disk.
Discard (Shading References)
MetaFluor
237
Version 7.0
MetaFluor User’s Guide
Deletes the shading images from the temporary memory buffer that MetaFluor uses to
store reference images while you are working on them. If you simply do not want to see
the reference image on your workspace, you should choose Hide.
Close
Closes the dialog box.
MetaFluor
238
Version 7.0
MetaFluor User’s Guide
Select Save Region (Run Experiment Menu)
Defines the image area that you want to save when images are acquired.
Use this command when you only need to save a small subregion of the images or when you
have limited storage space. Saving a selected part of acquired images is faster than saving
entire images.
Before defining the Save Region, you will be asked to select the source image that you want
to use for defining the region. The other images will be closed temporarily while you define the
Save Region. You should acquire one set of images before you define the region, so that you
will know where to place the boundaries of the region. You can define the region using the
Rectangular Region, Ellipse Region, Trace Region, or Auto-Trace Region Tool in the Region
Toolbar.
If you want to save the entire image, rather than a previously selected Save Region, you can
do so by using this command without drawing a region. A message will appear, stating that,
since you did not define a region, the entire image will be used.
MetaFluor
239
Version 7.0
MetaFluor User’s Guide
Selecting a Save Region
To select a save region for image acquisition, use the following procedure:
Step
Action
1
From the Run Experiment menu, choose
Select Save Region. The Select Source Image
for Defining Region dialog box will appear.
2
Choose Acquire Images to acquire one set of
images.
It is important to acquire a set of images now,
so that you will know where to define the
region of interest; otherwise, the image display
will be the last image in the video board's
memory--which could be its test pattern image.
3
Select the image that you think is best suited
for defining the save region from the Source
Image group. Depending on the dye and other
experimental conditions, one image may be
better than the others.
4
Choose OK to continue.
OR
Choose Cancel to cancel the Select Save
Region command.
5
MetaFluor will close all image windows and
dialog boxes temporarily, except for that of the
image selected in Step 3. It will open the
Region Toolbar and the Define Save Region
dialog box.
6
Using the Rectangular Region Tool, define the
region of the image you want to save. Do not
define more than one region.
You can move and resize the region using the
Locator Tool. You can choose Clear Region
from Image to remove the defined region from
the image.
OR
Choose Load Region from Disk if you want to
use a region that you have saved to disk.
Select the icon for the desired file from the
Load Region File dialog box and choose
Open.
7
If you want to save the defined region for later
use, choose Save Region to Disk. Type a file
name for the region file in the File Name text
box and choose Save.
8
After you have finished editing or defining the
region, choose Done Defining Save Region.
MetaFluor will close the Region Toolbar and
the Define Save Region dialog box and restore
MetaFluor
240
Version 7.0
MetaFluor User’s Guide
the image windows and dialog boxes that were
open prior to editing the regions.
MetaFluor
241
Version 7.0
MetaFluor User’s Guide
Select Source Image for Defining Regions - Dialog
Box Options
Image
Selects the image to be used for defining the regions of interest that are to be used for
defining regions of interest for graphing data to the measurements graphs. Depending on
the dye and other conditions, one image may be better than the others.
Acquire Images
Acquires one set of images. If you are about to acquire images and want to perform
measurements during your experiment, you should use this command before defining the
regions, so that you will know where to place the regions. Otherwise, the image displayed
will be the last image in the video board's memory--which could be its test pattern image.
OK
Closes all image windows and dialog boxes except for the selected image and opens the
Edit Regions dialog box so that you can define the regions.
Cancel
Cancels the Define Regions for Measurement command.
MetaFluor
242
Version 7.0
MetaFluor User’s Guide
Define Save Region - Dialog Box Options
Load Region from Disk
Loads a region file that has been saved to disk (using Save Regions to Disk). This option
opens the Load Region File dialog box. Select the icon for the desired file. If necessary,
use the Look In drop-down list box or the Up One Level icon button to select the
appropriate drive and folder. Choose Open. The saved region will appear on the image.
Save Region from Disk
Saves the region that is currently defined on the image to disk. This option opens the
Save Region File dialog box. Select the destination drive and folder for the log file using
the Save In drop-down list or Up One Level icon button. Then type the desired file name
in the File Name text box. Choose Save to save the region.
Clear Region from Image
Clears the current region from the image. Use this option if you want to use the entire
image.
Print with Region Outlines
Prints the image with the region of interest outline superimposed on the image. If there is
no region of interest defined on the image, this command simply prints the image. Select
the color to be used for printing the outline using Stamp Color. Type the desired title for
the printed image in the Image Title text box. Choose Print, and the standard Print dialog
box will appear. Select the desired printing options and choose OK.
Done Defining Save Region
Use this command when you are done defining the Save Region. MetaFluor will close the
Region Toolbar and the Define Save Region dialog box. It will also restore the image
windows and dialog boxes that were open prior to editing regions.
MetaFluor
243
Version 7.0
MetaFluor User’s Guide
Event Marks (Run Experiment Menu)
Marks the time at which a significant event occurred.
Use this command when you want to record a significant event during the experiment in a log
file. For example, you may want to record the time that you added a receptor agonist to your
perfusion medium. You can use the Event Marks command to annotate your data log with the
desired text. Each text line will have the current graph time associated with it. If you are saving
images to play back later, MetaFluor will also record the event in the .inf file associated with
the images so that it can display the event text at the appropriate time as you play back the
images.
The Event Marks dialog box can be expanded and condensed using the More >> and Less <<
command buttons. When the dialog box is in its expanded form, you can compose text for the
event mark in the Event Text box. Additional options will be available for configuring the use of
the experimental timer. Use the Mark New Event Now command button to log newly created
events immediately. Events can be added to the Stored Events List using the Add New Event
to List command button. After events have been added to the Stored Events List, you can log
stored events from the dialog box in its condensed form, either by double-clicking the entry in
the Stored Events List, by choosing the F5: Mark command button, or by pressing the [F5]
function key on your keyboard.
Adding predetermined events to the Stored Events List before starting is usually the best
approach to use for a new experiment with fast acquisition intervals. You can then log the
event marks as needed during the experiment. If you choose this approach, you will be able to
condense the dialog box using Less << after you have added your events to the list; all the
commands you need to log stored events will still be available in the condensed dialog box.
Note: If you find that logging events is a little tricky, it may be that the Timelapse interval you
selected using Timed Acquisition (Experiment Control Panel) is too short. A very short interval,
combined with a large number of Frames to Average (Experiment Control Panel), may not
allow MetaFluor enough time to handle image acquisition and other tasks, such as logging
events.
See Also:
Experiment Control Panel:
For Video Camera with External Monitor
For Video Camera with Computer's Monitor
For Digital Camera
For Playback
MetaFluor
244
Version 7.0
MetaFluor User’s Guide
Logging One Event
If you have just one event to log and a long acquisition interval, use the following method
to log the event:
Step
Action
1
Enable data logging in the Experiment Control
Panel dialog box by selecting Log Data.
2
From the Run Experiment menu, choose
Event Marks. The Event Marks dialog box will
appear. If the dialog box is not expanded,
choose More >> so that you can see all of the
options.
3
If you want to insert a delay between the time
you trigger the event mark and when it is
actually marked, select Enable Timer and then
enter a delay time in the Count-Down Timer
spin box.
4
If you want to have audible feedback that your
event mark was logged or marked, select
Beep on Event.
5
Type the desired text in the Event Text box.
6
If you want to run a journal when the event is
marked, choose the Journal to Be Executed
When Event Is Marked command button
(labeled "Select"). The Select a Journal to Run
dialog box will appear.
AND
Select the file for the journal you want to run
and choose Open.
7
When you want to mark this particular event
during the experiment, choose Mark New
Event Now. MetaFluor will note that the event
has been logged by displaying "Logged" next
to the Event Text static text or "Marked" to
indicate that it received the event but there
was no log file open and enabled.
If you associate a timed delay with the event
mark, the clock will count down from the
moment you choose Mark Now until the time is
reached, and then will start counting upwards
from that time (indicated by a "+").
WARNING:
Image acquisition tasks have priority over
confirmation of event marks (particularly when
using short acquisition intervals), so you may
not immediately see "Logged" next to Event
Text. Choosing Mark Now successively will
cause multiple events to be logged in the log
file.
8
If you want to add the event text to the list of
stored events, choose Add New Event to List.
MetaFluor
245
Version 7.0
MetaFluor User’s Guide
MetaFluor
246
Version 7.0
MetaFluor User’s Guide
Creating a Stored Events List
To create stored events for the Stored Events List, use the following procedure:
Step
Action
1
Enable data logging in the Experiment Control
Panel by selecting Log Data.
2
From the Run Experiment menu, choose
Event Marks. The Event Marks dialog box will
appear. If the dialog box is not expanded,
choose More >> so that you can see all of the
options.
3
If there are events from a previous work
session that you do not want to use, choose
Clear to clear all entries from the Stored
Events List.
OR
Delete any unwanted events by selecting them
from the Stored Events List and choosing
Delete.
4
In the Event Text box, type the desired text for
the first event you want to use during the
experiment.
5
If you want to insert a delay between the time
you trigger the event mark and when it is
actually marked, select Enable Timer and then
enter a delay time in the Count-Down Timer
spin box.
6
If you want to have audible feedback that your
event mark was logged or marked, select
Beep on Event.
7
If you want to run a journal when the event is
marked, choose the Journal to Be Executed
When Event Is Marked command button
(labeled "Select"). The Select a Journal to Run
dialog box will appear.
AND
Select the file for the journal you want to run
and choose Open.
8
Choose Add New Event to List. The event text
will appear in the Stored Events List.
9
Repeat Steps 4 - 8 for each new event you
want to use during the experiment.
If you need to change the order in which the
event marks appear in the list, highlight the
event you want to move and choose the
appropriate Move button.
If you want to condense the dialog box to
conserve space, choose Less << after you
have finished adding to the list.
MetaFluor
247
Version 7.0
MetaFluor User’s Guide
MetaFluor
248
Version 7.0
MetaFluor User’s Guide
Using the Stored Events List
To use the stored events list during an experiment to log events, use the following
procedure:
Step
Action
1
Create a Stored Events List.
2
Select the first event in the Stored Events List
that you are likely to use during the
experiment. Keep the Event Marks dialog box
open and visible on your computer screen.
3
Using the Experiment Control Panel, enable
logging by selecting Log Data, and start the
experiment when you are ready by choosing
Acquire.
4
When you want to log the selected event
mark, choose F5: Mark, press the [F5] key, or
double-click the entry in the Stored Events
List. MetaFluor will note that the event has
been logged by displaying "Logged" next to
the Status text or "Marked" to indicate that it
received the event but there was no log file
open and enabled.
If you associate a timed delay with the event
mark, the clock will count down from the
moment you choose Mark Now until the time is
reached, and then will start counting upwards
from that time (indicated by a "+").
WARNING:
Image acquisition tasks have priority over
confirmation of event marks (particularly when
using short acquisition intervals), so you may
not immediately see "Logged" next to the
Status text. Choosing F5: Mark successively
will cause multiple events to be logged in the
log file.
5
Repeat Step 4 as needed throughout the
experiment.
MetaFluor
249
Version 7.0
MetaFluor User’s Guide
Event Marks - Dialog Box Options
Stored Events List
Lists event names for event text that you have already composed so that you can quickly
select and log desired events at any time during the experiment. If a journal has been
associated with the event, the entry will list the name of the journal in parentheses.
Similarly, if the event has a delay associated with it the time, in seconds, will be listed in
parentheses.
F5: Mark
Logs the selected event in the Stored Events List to the open log file and indicates that it
was successful by displaying "Logged" next to the Status text. If there is no log file open,
"Marked" will be displayed instead. Double-clicking the desired event in this list will cause
the event to be selected and logged simultaneously. If you associate a timed delay with
the event mark, the clock will count down from the moment you choose Mark Now until
the time is reached, and then will start counting upwards from that time (indicated by a
"+"). If you mark an event that does not have a timer associated with it while the timer for
another event is still running, the act of marking the untimed event will clear the timer.
F6: Next
Selects the next entry in the Stored Events List. If the last entry is currently highlighted,
the first entry in the list will be selected.
Delete
Deletes the selected event from the Stored Events List.
Move
Moves the highlighted event mark entry up or down in the list.
Clear
Clears all events from the Stored Events List.
Load
Loads a set of event marks that has been previously stored on disk in an .evt file.
Save
Saves the current set of event marks as an .evt file.
More >>
Expands the dialog box.
Less <<
Condenses the dialog box.
Status
Indicates the status of the last event mark to be marked or logged.
Reset
Resets the timer and clears the timer display.
MetaFluor
250
Version 7.0
MetaFluor User’s Guide
Beep on Event
Issues the computer's beep sound when an event is logged.
Enable Timer
Enables and disables the use of the experimental timer for the event mark being
configured.
Event Text
Use this text box to compose the text for the event.
Count-Down Timer
When you add an event to the Stored Event List, you can associate it with a timer. To do
so, type the text in the Event Text box and enter the timer value (in seconds) in the
Count-Down Timer spin box; then choose Add New Event to List. In the Stored Events
List, you will see the event with the time next to it. For example, if the event is "Test" and
the time is "10" you will see "Test (10)." After you click the event, the timer will start
counting (this happens regardless).
Journal to Be Executed When Event Is Marked ("Select")
Opens the Select a Journal to Run dialog box, from which you can select a journal that
will run when the associated event is marked.
Mark New Event Now
Immediately logs the event text displayed in the Event Text box. Use this logging
command when you want to log a single event without adding and logging an event from
the Stored Events List.
Add New Event to List
Adds the event displayed in the Event Text box to the Stored Events List.
Close
Closes the dialog box.
MetaFluor
251
Version 7.0
MetaFluor User’s Guide
Event Mark Hotkeys (Run Experiment Menu)
Provides shortcut keys to generate the event marks defined in the Event Marks
dialog box.
Use this command when you want to use a shortcut key to generate an event mark already
defined in the Event Marks dialog box.
The Event Mark Hotkeys command opens a secondary menu consisting of two commands
and keyboard shortcuts for the first ten events in the Stored Events list in the Event Marks
dialog box.
The Mark Current Event command generates an event mark that is equivalent to the one
currently selected in the Stored Events list.
The Move to Next Event command selects the next event in the Stored Events list as the
current event. However, it does not generate an event mark.
The remaining ten menu items in the secondary menu associate the keyboard shortcut keys
[SHIFT] + [F1] through [SHIFT] + [F10] with the first ten events in the Stored Events list.
Pressing the appropriate keyboard shortcut keys generates the corresponding event mark and
selects that event mark as the current event. Menu items that have been assigned to an event
mark will appear in the menu with the name of the event mark; unassigned items will be
named "Mark Event #n," where n indicates the number of the item in the list.
You do not need to have the Event Marks dialog box open to use these shortcut keys.
However, you may want to keep the dialog box open so that you can see which event mark is
the currently selected one.
Shortcuts:
Mark Current Event = [F5]
Move to Next Event = [F6]
First ten events = [SHIFT] + [F1] through [SHIFT] + [F10]
See Also:
Event Marks
MetaFluor
252
Version 7.0
MetaFluor User’s Guide
Using Event Mark Hotkeys
To use the Event Mark Hotkeys, use the following procedure:
Step
Action
1
From the Run Experiment menu, choose
Event Mark Hotkeys. A secondary menu will
appear. The menu lists the event numbers and
the keyboard shortcut assigned to each event.
2
To mark a particular event, choose it from the
secondary menu.
OR
Use the keyboard shortcut listed next to the
journal: press and hold the [SHIFT] key. Then
press the assigned function key.
3
If you do not want to use the individual
shortcuts listed, you can use the Move to Next
Event command (F6) to move to the next
event in the list. Then use the Mark Current
Event command (F5) to mark the newly
selected event.
Note: The Move to Next Event command does
not "wrap" to the top of the list. Thus, you will
need to select the first event from the Event
Marks dialog box or use its shortcut if you
want to repeat the sequence of events.
MetaFluor
253
Version 7.0
MetaFluor User’s Guide
Show Event List (Run Experiment Menu)
Displays a list of the time and text of all stored events during playback of the
current experiment.
Use this command to see an experiment's stored events during playback. You can also use
this command to load the set of images associated with an event by clicking that event in the
Event List dialog box.
Note: You can select whether or not to have the dialog box appear every time an event mark
occurs during playback by enabling or disabling Display Dialog When an Event Mark Occurs
During Playback from the Playback Preferences dialog box (Preferences command, File
menu).
This command is available only during playback of a previously stored experiment.
See Also:
Event Marks
Preferences
MetaFluor
254
Version 7.0
MetaFluor User’s Guide
Showing the Event List
To display the Event List, use the following procedure:
Step
Action
1
From the Run Experiment menu, choose
Show Event List. The Event List dialog box will
appear.
2
As you play the experiment forward or in
reverse using the controls in the Experiment
Control Panel, MetaFluor will highlight the
current event in the Event List.
To go to a particular event, select the event
name from the Event List dialog box so that it
is highlighted, and choose Go to Event. (Or
you can double-click the event name to go to
the event.)
3
Choose Close when you have finished.
MetaFluor
255
Version 7.0
MetaFluor User’s Guide
Event List - Dialog Box Options
Events from This Experiment
Lists the time and text of all stored events for the experiment. The units of time displayed
in the Event List are the same as those set in the Experiment Control Panel.
Go to Event
Displays the images associated with the event currently selected in the Events from This
Experiment list. You can use this option to display an event and its associated images
rather than playing through the experiment using the Experiment Control Panel.
Close
Closes the dialog box.
MetaFluor
256
Version 7.0
MetaFluor User’s Guide
Stream Setup (Run Experiment Menu)
Configures the acquisition settings used for the Acquire Stream command.
Use this command before you use the Acquire Stream command to specify the acquisition
wavelengths, number of frames to acquire, and the camera settings. After you define the
Stream Setup and Configure Acquisition settings, you can use the Stream Acquisition
command to acquire the specified number of frames as fast as possible into computer
memory. When all of the frames have been acquired, MetaFluor will transfer the image data
into the experiment, performing the wavelength or ratio image saving, and data logging tasks
(which are specified in the Experiment Control Panel - Digital Camera before you carry out
the Stream Acquisition command). If you have a Physik piezo focuser and the appropriate
acquisition hardware (see Hardware, below), you can also use the Stream commands to
perform Z-streaming.
You can configure your stream setup to run a journal before and after acquisition. This is
particularly useful in situations where you want to initiate acquisition when the system receives
a TTL pulse signal. In this example, the "before" journal can be a trigger journal, and the
"after" journal can be one that resets the TTL trigger after acquisition has finished.
Note: This command is unavailable in the MetaFluor Offline system.
Hardware
The fast acquisition mode used by the Acquire Stream command is currently supported by the
following video hardware:
All Photometrics cameras,
All Princeton Instruments cameras,
All video cameras connected to the Flashbus video acquisition board, and
All cameras (video and digital) connected to the MuTech video acquisition board.
Two-wavelength streaming is currently supported only by the Princeton Instruments PentaMax
or MicroMAX camera, or by the MuTech board in combination with a monochrome camera-and then only if you are using a Sutter Lambda 10, Lambda 10-2, or DG4 filter wheel, or a
Polychrome monochromator as your illumination device.
WARNING: If you attempt to use a streaming exposure time that is shorter than the fastest
readout time your camera can handle, your actual exposure time will be limited by the readout
time. If this occurs, MetaFluor will display a warning message.
See Also:
Acquire Stream
Experiment Control Panel - Digital Camera
Configure Acquisition
MetaFluor
257
Version 7.0
MetaFluor User’s Guide
Trigger Journals
MetaFluor
258
Version 7.0
MetaFluor User’s Guide
Configuring Stream Setup
To configure the Stream Setup command, use the following procedure:
Step
Action
1
From the Run Experiment menu, choose
Stream Setup. The Stream Setup dialog box
will appear.
2
From Number of Frames to Acquire, select the
number of image frames you want to acquire.
MetaFluor will display the amount of memory
the stream will use (based on the size and
number of images that you want to acquire). It
will also display the amount of memory
available. This information will help you
determine how many frames you can acquire
in one stream.
3
From the Number of Wavelengths option
button group, select the number of
wavelengths that you want to acquire in
stream mode.
Note: To perform dual-wavelength stream
acquisition, you must have a Sutter Lambda
10, Lambda 10-2, or DG4 filter wheel or a
Polychrome monochromator, and either a
monochrome camera connected to a MuTech
video acquisition board or a Princeton
Instruments PentaMax camera.
4
Select the desired wavelength image for
acquisition of the first stream from the First
Wavelength list. If you are conducting singlewavelength stream acquisition, this will be the
only wavelength acquired.
AND
If you are conducting a dual-wavelength
stream acquisition, select the desired
wavelength image for acquisition of the
second stream from the Second Wavelength
list.
5
If you are using a "video rate" camera, skip to
Step 9.
OR
If you are using a digital camera, continue to
Step 6.
6
Select the desired state for the camera from
the Camera State list. The options available
will vary depending on the camera used. The
suggested setting for the PVCam camera is
HALT, CLEAR.
7
If you are using an external shutter, select a
shutter state from the Shutter Mode list: Open
for Expose, Always Closed, or Always Open.
MetaFluor
259
Version 7.0
MetaFluor User’s Guide
8
Select the desired clear mode for the camera
from the Clear Mode list.
The options available will vary depending on
the camera used. The suggested setting for a
frame transfer camera operating in the FT
mode is CLEAR PRE EXPOSURE.
9
If your system includes a DVP board, the
Destination radio button group will be enabled.
To take advantage of the high-speed, real-time
streaming of acquired frames to hard disk,
select Stream to Real-Time Hard Disk.
OR
To use the default method of acquiring the
entire stream to RAM and processing the
images to disk afterwards, select Stream to
RAM.
10
If you want to run a journal (e.g., a trigger
journal) before and after stream acquisition,
choose the Before Streaming command button
and select the journal to run before acquisition
from the Select a Journal dialog box. Then
choose Open to return to the Stream Setup
dialog box.
AND
Choose After Streaming and select the journal
to run after acquisition from the Select a
Journal dialog box. Then choose Open to
return to the Stream Setup dialog box.
11
When you have finished configuring the
stream setup, choose OK.
MetaFluor
260
Version 7.0
MetaFluor User’s Guide
Stream Setup - Dialog Box Options
Number of Frames to Acquire
Specifies the number of frames to acquire. As you change this value, the value displayed
by the Amount of Memory Stream Will Use will be updated.
Your Current Acquisition Region Is
Displays the size of the acquisition region. (The acquisition region is defined in the
Configure Acquisition dialog box.)
Your Current Exposure Time Is
Displays the current exposure time (digital) or number of frames (video) for the selected
wavelength image.
Amount of Memory Available
Displays the amount of memory available for use by the stream during acquisition.
Amount of Memory Stream Will Use
Displays the amount of memory needed to complete the stream acquisition. If the amount
of memory used by the stream exceeds the total amount of free memory, acquisition will
not be possible. When this situation occurs, a message will be displayed on the Status
line.
Estimated Total Exposure Time
Displays what the total exposure time (digital) or total number of acquired frames (video)
will be for the stream acquisition, based on the selected Number of Frames to Acquire
and the exposure time setting.
Camera State
Specifies the camera state used during acquisition. The options available will vary
depending on the camera used. The suggested setting for the PVCam camera is HALT,
CLEAR. This option will be available only for acquisition with a digital camera.
Shutter Mode
Specifies the shutter mode to use during acquisition: Open for Expose, Always Closed, or
Always Open. This option will be available only for acquisition with a digital camera.
Clear Mode
Specifies the mode used to clear the camera chip. The options available will vary
depending on the camera used. The suggested setting for a frame transfer camera
operating in the FT mode is CLEAR PRE SEQUENCE. This setting clears the chip prior
to starting the first exposure. If you do not have a frame transfer camera, you should set
this option to CLEAR PRE EXPOSURE. This setting clears the chip before each frame is
exposed. This option will be available only for acquisition with a digital camera.
Number of Wavelengths
Specifies the number of wavelengths (One or Two) to acquire in the stream. To perform
two-wavelength stream acquisition, you must have a Sutter Lambda 10, Lambda 10-2, or
DG4 filter wheel or a Polychrome monochromator, and either a monochrome camera
MetaFluor
261
Version 7.0
MetaFluor User’s Guide
connected to a MuTech video acquisition board or a Princeton Instruments PentaMax
camera.
First Wavelength
Specifies the wavelength image to be used for the stream acquisition.
Second Wavelength
Specifies the wavelength image to be used for acquisition of the second stream of a dualwavelength protocol.
Destination
If you have a DVP board, this option allows you to select between (1) the default method
of acquiring frames rapidly to RAM and then processing the images afterwards on disk
(Stream to RAM), and (2) acquiring the image frames directly to disk by high-speed
streaming (Stream to Real-Time Hard Disk).
Before Streaming
Opens the Select a Journal dialog box, from which you can pick a journal that will run
before the actual stream acquisition. For example, you may want to run a Trigger Journal
that puts the system into a standby mode until a TTL trigger is received, at which point
the stream acquisition will proceed.
After Streaming
Opens the Select a Journal dialog box, from which you can pick a journal that will run
after the stream acquisition has completed. For example, you may want to run a journal
that resets the TTL trigger.
Status
Displays a message regarding the status of the stream acquisition and alerts you to any
problems that may occur.
OK
Configures the stream acquisition.
Cancel
Cancels the command.
MetaFluor
262
Version 7.0
MetaFluor User’s Guide
Acquire Stream (Run Experiment Menu)
Acquires images from one or two wavelengths as rapidly as possible into
computer RAM memory.
Use this command to perform high-speed acquisition of images. The number of wavelengths
and images to be acquired is defined by the Stream Setup command. If you have a Physik
piezo focuser and the appropriate acquisition hardware (see Hardware, below), you can also
use the Stream commands to perform Z-streaming. After the images have been acquired into
RAM, MetaFluor will transfer the image data to disk.
Before using this command, you must use the Stream Setup command to specify the
wavelength, number of frames to acquire, the camera state, the shutter mode, and the clear
mode. You must also use the Configure Acquisition command to define other acquisition
settings.
Note: This command is unavailable in the MetaFluor Offline system.
Hardware
The fast acquisition mode used by the Acquire Stream command is currently supported by the
following video hardware:
All Photometrics cameras,
All Princeton Instruments cameras,
All video cameras connected to the Flashbus video acquisition board, and
All cameras (video and digital) connected to the MuTech video acquisition board.
Two-wavelength streaming is currently supported only by the Princeton Instruments PentaMax
or MicroMAX camera, or by the MuTech board in combination with a monochrome camera-and then only if you are using a Sutter Lambda 10, Lambda 10-2, or DG4 filter wheel, or a
Polychrome monochromator as your illumination device.
WARNING: If you attempt to use a streaming exposure time that is shorter than the fastest
readout time your camera can handle, your actual exposure time will be limited by the readout
time. If this occurs, MetaFluor will display a warning message.
See Also:
Stream Setup
Experiment Control Panel - Digital Camera
Configure Acquisition
MetaFluor
263
Version 7.0
MetaFluor User’s Guide
Using Stream Acquisition
To acquire a high-speed stream of images, use the following procedure:
Step
Action
1
Configure the stream acquisition using the
Stream Setup command.
2
Select the Run Experiment menu.
3
Choose Acquire Stream and wait while the
camera acquires the images.
When all of the images have been acquired
and stored in memory, MetaFluor will perform
the image saving and data logging tasks as
configured in the Experiment Control Panel Digital Camera dialog box.
MetaFluor
264
Version 7.0
MetaFluor User’s Guide
Move All Regions (Run Experiment Menu)
Moves all regions of interest up, down, left, or right in increments of 1 or 10 pixels.
Use this command to move regions at any time (including during image acquisition) while
completing an experiment. Move All Regions is ideal for situations in which all of the objects
that you are measuring have moved simultaneously and in the same direction. For example, if
you add a solution to a dish, the influx of solution may shift the field of view by a number of
pixels. Move All Regions allows you to shift all of the regions of interest to follow the objects
you were measuring.
MetaFluor does not record region moves in log files. If you need to know when you moved
regions, you should create an event mark and log that whenever you move regions.
Alternatively, you can assign a journal to a journal toolbar button that runs the Write to Log
File journal function, and enter text that indicates the change that was made.
WARNING:
If you move or remove a region while graphing the data, all data in the graphs will be erased.
See Also:
Event Marks
MetaFluor
265
Version 7.0
MetaFluor User’s Guide
Moving All Regions
To move all regions, use the following procedure:
Step
Action
1
From the Run Experiment menu, choose Move
All Regions. The Move All Regions dialog box
will appear.
2
To move the regions in increments of one
pixel, use the buttons surrounding the +/- 1
text to move the regions in the desired
direction. Repeat the commands as
necessary.
3
To move the regions in increments of ten
pixels, use the buttons surrounding the +/- 10
text to move the regions in the desired
direction. Repeat the commands as
necessary.
4
Choose OK when you have finished.
MetaFluor
266
Version 7.0
MetaFluor User’s Guide
Move All Regions - Dialog Box Options
Up
Moves all regions up in increments of either one pixel or ten pixels.
Down
Moves all regions down in increments of either one pixel or ten pixels.
>>
Moves all regions right in increments of either one pixel or ten pixels.
<<
Moves all regions left in increments of either one pixel or ten pixels.
Region Display Box
Displays the overall location of the entire collection of regions on the images. The box
represents the perimeter of all the regions, not just of one region. You can drag the box
inside this display to move the regions, rather than using the other dialog box options.
OK
Closes the Move All Regions dialog box.
MetaFluor
267
Version 7.0
MetaFluor User’s Guide
Align Wavelengths (Run Experiment Menu)
Aligns the images of one to five wavelengths along the X and/or Y image axis to
compensate for refractive differences.
Use this command to correct for variations in image alignment caused by the differences in light
transmission and refraction at different wavelengths. When using two or more wavelengths to visualize
and analyze a ratio or to create an image stack, because of the different refractive properties of the
wavelengths, the images might not align correctly, producing false data in the analysis. To compensate
for the refractive differences, you can determine the amount of image offset correction that needs to be
applied to each wavelength, and have MetaFluor apply that correction to each image of the associated
wavelength either immediately following image acquisition, or during image playback. The Align
Wavelengths dialog box enables you to apply separate correction values to each wavelength for a
maximum of five wavelengths. You can either type the X and Y values into the X and Y boxes, or use
the position control arrows in the Adjust box to change the image position along the X and/or Y axis.
You can also choose whether to apply the alignment correction values immediately after acquisition or
during playback.
MetaFluor
268
Version 7.0
MetaFluor User’s Guide
Aligning Wavelengths
To align two to five wavelengths, complete the following procedure.
Step
Action
1
Before starting the wavelength alignment
steps, open the experiment images that you
want to use to make your alignment settings
or begin to acquire experiment images. You
need an experiment that contains images
from at least two different wavelengths. Use
the ratio image of the two wavelengths to
view and determine the alignment of the
wavelengths.
2
From the Run Experiment menu, click Align
Wavelengths, the Align Wavelengths dialog
box opens.
3
In the Wave box, select the wavelength to
which you want to apply the alignment
settings. If you are acquiring only two
wavelengths, you need to apply alignment
settings to only one wavelength.
4
If you are applying the alignment settings to
your wavelengths immediately after
acquisition, click Align after Acquisition; or, if
you are applying alignment settings during
image playback, click Align during Playback.
5
In the Adjust box, click the left or right arrows
to move the selected wavelength’s image left
or right. Click the up or down arrows to
move the image up or down. The values in
the X and Y boxes will change accordingly.
OR
If you know the values to apply to X and Y,
type them into the X and Y boxes.
6
Repeat steps 3 through 5 until all
wavelengths are aligned.
7
After all settings for each wavelength are
complete, click Close.
MetaFluor
269
Version 7.0
MetaFluor User’s Guide
Align Wavelengths - Dialog Box Options
Wave
Selects the wavelength to which you want to apply the adjustment.
Adjust
Adjusts the position of the image along the X and/or Y axis. Also, resets both the X and Y axis values to
zero using the center button. Use the arrow buttons to change X and/or Y values. The left and right arrows
change X; the up and down arrows change Y. The center button marked "0" resets both X and Y to zero.
The selected values are displayed in the X and Y boxes.
X
Specifies the X axis offset value that you want to apply to images of the selected wavelength. Type the
value into the box or click the left and/or right arrows in the Adjust box. This can be either a negative or
positive value. A negative value moves the image to the left; a positive values moves the image to the right.
Y
Specifies the Y axis offset value that you want to apply to images of the selected wavelength. Type the
value into the box or click the up and/or down arrows in the Adjust box. This can be either a negative or
positive value. A negative value moves the image down; a positive values moves the image up.
Align after acquisition
Applies the wavelength alignment settings immediately after acquisition of the image. The applied value is
stored with the image, preventing the image from being aligned a second time during playback.
Align during playback
Applies the wavelength alignment settings to images from the specified wavelengths during playback.
Close
Closes the Align Wavelengths dialog box.
MetaFluor
270
Version 7.0
MetaFluor User’s Guide
Edit Conditions (Run Experiment Menu)
Defines up to five experimental conditions which can be used to "tag" the
experimental data at appropriate times.
Drop-in: COND
Use this command to define experimental conditions (e.g., "staurosporine present") which can
be used to characterize the state of the preparation during data acquisition or playback. These
conditions will appear in the dialog box for the Conditions command, which contains a button
that you can toggle on and off for each condition. This allows you to apply a numeric "tag" to
the data as they are acquired. When you log the data, the state of each condition will appear
in a separate column in the measurements file. If, for example, you use the default values for
the ON and OFF states, a "0" will signify the OFF condition and a "1" will signify ON. You can
specify a different tag for the ON and OFF conditions if you wish. With the Edit Conditions
command, you will select both a descriptive name (e.g., "Stimulus applied") and a short name
that will be used in the log file (e.g., "stim").
See Also:
Installing Drop-ins Using the Meta Imaging Series Administrator
Conditions
MetaFluor
271
Version 7.0
MetaFluor User’s Guide
Editing Experimental Conditions
To define a set of experimental conditions, use the following procedure:
Step
Action
1
From the Run Experiment menu, choose Edit
Conditions. The Edit Conditions dialog box will
appear.
2
With the Number of Conditions spin box,
select the number of different conditions that
you want to use to "tag" the experimental data.
You may select up to five conditions.
3
Type a descriptive name for the first condition
in the Condition Name text box in the first row.
This name will appear on a corresponding
toggle button in the Conditions dialog box.
4
In the Log Name text box, type a
corresponding short name that will be used as
a column heading in the measurements file.
5
The default tags for the ON and OFF states
are "1" and "0", respectively. If you want to use
different values, type the values you prefer in
the ON Value and OFF Value text boxes.
6
If you want to specify a numeric format for the
tags, type the format string in the Log Format
text box. For example, "##.#" will specify a
format for numbers between 0 and 99, with
one place after the decimal point.
7
Repeat Step 3 - 6, as necessary for each
subsequent condition, using the text boxes in
the pertinent rows.
8
When you have finished, choose OK.
MetaFluor
272
Version 7.0
MetaFluor User’s Guide
Edit Conditions - Dialog Box Options
Number of Conditions
Selects the number of separate conditions that you want to define. A row of text boxes
(Condition Name and Log Name) will become available for each condition.
Condition Name
Specifies a descriptive name (e.g., "Staurosporine added") for the condition. This name
will appear on a corresponding toggle button in the Conditions dialog box.
Log Name
Specifies a short name (e.g., "staur") for the condition. This name will be used as a
column heading in the measurements file when you log experimental data.
ON Value
Specifies a numeric tag for the ON state of the condition. The default value is 1.
OFF Value
Specifies a numeric tag for the OFF state of the condition. The default value is 0.
Log Format
Specifies a numeric format for the ON and OFF tags. For example, "##.#" will specify a
format for numbers between 0 and 99, with one place after the decimal point.
OK
Accepts the current set of conditions and closes the dialog box.
Cancel
Rejects any newly defined conditions and closes the dialog box.
MetaFluor
273
Version 7.0
MetaFluor User’s Guide
Conditions (Run Experiment Menu)
"Tags" experimental data, as they are acquired or played back, with up to five sets
of experimental conditions.
Drop-in: COND
Use this command to "tag" your experimental data with a description of the state of the
preparation during acquisition (e.g., "staurosporine present"). You will first need to define
these conditions with the Edit Conditions command (Run Experiment menu). When you log
the data, the state of each condition will appear in a separate column in the measurements
file. If you used the default values in the Edit Conditions dialog box for the ON and OFF states,
a "0" will signify the OFF condition and a "1" will signify ON.
This command offers a convenient way of rapidly labeling your data with up to five separate
"flags" that describe the prevailing conditions of your preparation. This is somewhat similar to
the use of the Event Marks command. However, the Conditions command will apply the
condition "tag" continuously until you change its state (ON to OFF, or vice versa). Also, the
Conditions dialog box will occupy far less space in the application window than the Event
Marks dialog box.
See Also:
Installing Drop-ins Using the Meta Imaging Series Administrator
Edit Conditions
Event Marks
MetaFluor
274
Version 7.0
MetaFluor User’s Guide
Tagging Data with an Experimental "Conditions"
State
To tag your experimental data with a conditional state during acquisition or playback, use
the following procedure:
Step
1
Action
From the Run Experiment menu, choose
Conditions. The Conditions dialog box will
appear, with a toggle button for each condition
you have defined with the Edit Conditions
command (Run Experiment menu).
Leave this dialog box open in your application
workspace while you run the experiment.
2
At the appropriate times during data
acquisition or playback, click the pertinent
toggle button to "tag" all subsequent data. The
color indicator next to the button will change in
accordance with the state, light green for ON
or dark yellow for OFF.
3
When you have finished acquiring or playing
back your data, choose Close.
MetaFluor
275
Version 7.0
MetaFluor User’s Guide
Conditions - Dialog Box Options
Condition Toggle Button
Tags data being acquired or played back with a "flag" that indicates the experimental
condition. When you log the data, the state of each condition will appear in a separate
column in the measurements file, with a "0" signifying OFF and a "1" signifying ON.
Condition Indicator
This colored box indicates the current state of the corresponding condition: light green for
ON or dark yellow for OFF.
Close
Closes the dialog box.
MetaFluor
276
Version 7.0
MetaFluor User’s Guide
Graphs Menu
MetaFluor
277
Version 7.0
MetaFluor User’s Guide
Define Regions for Measurement (Graphs Menu)
Defines the regions of interest from which image data are to be measured, graphed
in the time-based measurements graphs, logged to measurement files, or averaged
for use in background subtraction. Opens the measurements graphs after regions
of interest have been defined. Images can also be printed from this dialog box.
Use this command to define the regions of interest used for logging or graphing measurement
data. You can also define a region from which an average grayscale value will be derived and
used for background subtraction (selected in the Reference Images dialog box). Each
measurement that is graphed or logged is an average of all of the pixels in its region of
interest, after taking thresholding into account. If a region is used for background subtraction,
its values will be set to 0, causing the trace to "disappear" off of the measurement graphs.
This is done so that, if you change which region is to be used for background subtraction, the
data in the measurements file will not become jumbled. Measurements cannot be computed
by MetaFluor unless at least one region of interest has been defined using Define Regions for
Measurement. You can also load and save regions to disk or clear regions from the image
using this command.
Regions are defined using one of the Region Tools (Rectangular, Ellipse, Trace, or AutoTrace Region Tool) in the Region Toolbar. The status line on the Region Toolbar displays the
coordinates and size of the region that you are creating or editing. The coordinates for
rectangular regions are expressed for the upper left corner. For elliptical regions, the
coordinates of the centroid are given. For irregularly shaped regions, a bounding rectangle is
placed over the region, and the coordinates of its upper left corner are given.
Note: Regions drawn with a two-dimensional Region Tool (Rectangular, Ellipse, Trace, or
Auto-Trace) must be at least 2x2 in size to be valid in MetaFluor.
Before you define your regions of interest, you will be asked to select the source image
(wavelength or ratio) that you want to use for defining the regions. If you are about to acquire
images and want to perform measurements during your experiment, you will be able to
acquire a single set of images now for use in defining your regions. If you are playing back
stored images, you should select the image that you think is best suited for defining regions.
Depending on the dye and other conditions, one image may be better than the others. The
other images will be closed temporarily while you edit the regions. You should acquire one set
of images prior to defining the regions so that you will know where to place regions.
As you define your regions, they will be numbered in the order you create them. The number
will appear next to the region if you have selected the Draw Labels Next to Region Outlines
check box in the General Preferences dialog box (Preferences command, File menu). If you
remove a region (by right-clicking and selecting Delete Region from the pop-up context menu
that appears), the numbering will be updated. After you have defined or edited your regions of
interest using the Define Regions for Measurement command, MetaFluor will open the
measurements graphs automatically.
Note: The pop-up context menu that appears when you right-click a region also contains
commands that allow you to change the color of the region outline, shrink the region outline to
fit a thresholded object, or copy the region outline to the Clipboard (and paste it into another
image window).
MetaFluor
278
Version 7.0
MetaFluor User’s Guide
WARNING:
If you move or remove a region while graphing the data, all data in the graphs will be erased.
Exception: If you have selected the Do Not Clear Graph When Regions Change check box in
the General Preferences dialog box (Preferences command, File menu), the graphs will not be
cleared if you add or remove regions. Instead, the traces corresponding to those regions will
disappear or be added to the graphs.
Note: If you move or redefine regions with the Define Regions for Measurement command
while saving data to a measurements file, and want to log the new region information
automatically (new coordinates, size, and thresholded area), you can do so by selecting the
Log Header After Editing Regions check box in the Data Logging Preferences dialog box
(Preferences command, File menu). This will not be the case when regions are moved with
the Move All Regions command, however, because a large number of meaningless log entries
would be generated during the movement and resizing procedures.
Define Regions for Measurement will save your measurement regions automatically to a file
called "Last.rgn," that will be stored in your default regions directory. In this way, you will be
able to use the most recent set of regions if you quit MetaFluor and then realize that you want
to use those same regions when you restart the program.
TIP: To bring otherwise obscured graph windows to the "top" of your workspace display, use
the Bring Graphs to Front command (Windows menu), or use its keyboard shortcut, [CTRL] +
[G].
See Also:
Preferences
Configure Graphs
Clear Graphs
Move All Regions
Reference Images
MetaFluor
279
Version 7.0
MetaFluor User’s Guide
Defining Regions for Measurement
To define or edit regions, use the procedure presented in the following table.
Note: Regions drawn with a two-dimensional Region Tool (Rectangular, Ellipse, Trace,
or Auto-Trace) must be at least 2x2 in size to be valid in MetaFluor.
Step
Action
1
From the Graphs menu, choose Define
Regions for Measurement. The Select Image
for Defining Regions dialog box will appear.
2
If you are about to acquire images and want to
perform measurements during your
experiment, choose Acquire Images to acquire
one set of images.
It is important to acquire a pair of images now,
so that you will know where to define regions
of interest; otherwise the image display will be
the last image in the video board's memory-which could be its test pattern image.
3
From the Image list, select the image that you
think is best suited for defining regions.
Depending on the dye and other conditions,
one image may be better than the others.
4
Choose OK to continue.
OR
Choose Cancel to cancel the Define Regions
for Measurement command.
5
MetaFluor will temporarily close all image
windows and dialog boxes except the image
selected in Step 3. It will open the Region
Toolbar and the Edit Regions dialog box.
6
Define the regions you want to measure using
the Rectangular Region, Ellipse Region, Trace
Region, or Auto-Trace Region Tool. You can
move and resize the regions using the Locator
Tool by holding down the [CTRL] key while
you drag the region or its borders. You can
move all regions simultaneously by holding
down the [SHIFT] key while dragging any
region. If necessary, you can choose Clear
Regions to remove all of the defined regions
from the image.
OR
Choose Load if you want to use regions that
you have saved to disk. The Load Region File
dialog box will appear. Select the desired *.rgn
file. If necessary use the Look In list or Up One
Level button to select the appropriate drive
and folder. Then choose Open.
7
If you want to save the defined regions for
later use, choose Save. The Save Region File
dialog box will appear. Type a file name for the
MetaFluor
280
Version 7.0
MetaFluor User’s Guide
region file in the File Name text box and
choose Save.
Note: Define Regions for Measurement also
automatically saves your last set of
measurement regions to a file called
"Last.rgn," that will be stored in your default
regions directory.
8
If you want to print the image, complete with
the region outlines (and region labels, if you
selected the Draw Labels Next to Region
Outlines check box in the General Preferences
dialog box), choose Print, and follow the
procedure for configuring and printing the
image.
9
After you have finished editing or defining
regions, choose Done.
MetaFluor will close the Region Toolbar and
the Edit Regions dialog box, and restore the
image windows and dialog boxes that were
open prior to editing the regions. The
measurements graphs will also be opened.
MetaFluor
281
Version 7.0
MetaFluor User’s Guide
Printing an Image While Defining Regions
To print the image, use the procedure presented in the following table:
Step
Action
1
From the Edit Regions dialog box, choose
Print. The Print with Region Outlines dialog
box will appear.
2
In the Image Title text box, type a title for the
image. This title will be printed at the top of the
image.
3
Select a stamp color for the region outlines
and labels (Black or White) from the Stamp
Color option button group.
4
When you are ready, choose Print. The
standard Windows Print dialog box will appear.
Proceed as you would for printing any
document in Windows.
MetaFluor
282
Version 7.0
MetaFluor User’s Guide
Select Source Image for Defining Region - Dialog
Box Options
Source Image
Selects the image to be used when defining the region of interest. Depending on the dye
and other conditions, one image may be better than the others.
Acquire Images
Acquires one pair of images. You should use this command before defining the region, so
that you will know where to place the region. Otherwise, the image displayed will be the
last image in the video board's memory--which could be its test pattern image.
OK
Closes all image windows and dialog boxes except for the selected image and opens the
Define Save Region dialog box so that you can define the region of interest.
Cancel
Cancels the Select Save Region command.
MetaFluor
283
Version 7.0
MetaFluor User’s Guide
Edit Regions - Dialog Box Options
Load
Loads a region (*.rgn) file from disk. This option opens the Load Region File dialog box.
Select the desired file. If necessary use the Look In list to select the appropriate drive and
folder.
Save
Saves regions, currently defined on the image, to disk. This option opens the Save
Region File dialog box. Type the desired file name for the .rgn file in the File Name text
box. If necessary use the Save In list to select the location where you want to save the
file.
Clear All
Clears all regions from the image.
Reset Colors
Resets the use of colors for region outlines back to the top of the order (i.e., to red) in the
color menu. This is the same menu as is seen when you right-click a region and choose
Change Color from the pop-up shortcut menu that appears.
Create Regions Around Objects
Automatically turns on thresholding for bright objects and creates regions around objects limited by your
selections for Min Size, Max Size, and the Max # of regions.
Min Size
The total area of the smallest size object to threshold, measured in number of pixels.
Max Size
The total area of the largest size object to threshold, measured in number of pixels.
Max # of regions
The maximum number of regions to create in the image. The maximum value that you can enter
for the Max # of regions is 255.
Create
Creates regions in the image according to the values that you specified for Min Size, Max Size, and
the Max # of regions.
Print
Opens the Print with Region Outlines dialog box, from which you can configure and print
the image with region outlines (and labels, if you selected the Draw Labels Next to
Region Outlines check box in the General Preferences dialog box), superimposed on the
image. If there are no regions of interest defined on the image, this command simply
prints the image. Select the color to be used for printing the outlines using Stamp Color.
Type the desired title for the printed image in the Image Title text box.
Regions Defined
Indicates the total number of defined regions in the active image window.
Active Region
Displays the number of the currently active region.
MetaFluor
284
Version 7.0
MetaFluor User’s Guide
Average Intensity
Gives the average grayscale value for the currently active region.
Shortcuts!
Displays a message box explaining the [SHIFT] and [CTRL] key shortcuts for
manipulating regions.
Done
Use this command button when you have finished editing regions. MetaFluor will close
the Region Toolbar and the Edit Regions dialog box. It will also restore the image
windows and dialog boxes that were open prior to editing regions. The measurements
graphs will opened (you may need to choose the Show or Hide Graphs command from
the Windows menu to make them visible).
MetaFluor
285
Version 7.0
MetaFluor User’s Guide
Configure Graphs (Graphs Menu)
Specifies the region intensity and ratio data to be plotted, and configures the title,
X and Y axis range, tick marks, labels, and line types, for up to five measurements
graphs.
Use this command to configure the available options separately for each measurements
graph. For each graph, you can configure the minimum and maximum grayscale or ratio
values to be plotted on the Y-axis and the length of time on the X-axis. You can specify
logarithmic scaling of the Y-axis, and you can specify that the Y-axis be inverted.
WARNING:
Because the Y-axis ranges for intensity and ratio data can differ so greatly, we strongly
recommend that you configure separate graphs for intensity and ratio data.
This command does not open the graphs; they will be opened automatically after you have
defined your measurement regions using the Define Regions for Measurement command.
(You may still need to use the Show or Hide Graphs command in the Windows menu to make
them visible.)
Note: At least one region must be defined on an image for data to be displayed in its
corresponding measurements graph.
WARNING:
If you change the graph assignment (Appears on Graph) or line appearance (Line Type) for
any data, all of the graphs will be erased.
See Also:
Define Regions for Measurement
Show or Hide Graphs
MetaFluor
286
Version 7.0
MetaFluor User’s Guide
Configuring Region Data Measurements Graphs
To configure the measurements graphs, use the procedure presented in the following
table:
Step
Action
1
From the Graphs menu, choose Configure
Graphs. The Configure Graphs dialog box will
appear.
2
For each data type in the Measured Value
column (Wavelength 1 Average Intensity, etc.),
select the graph to display it in, using the
associated Appears on Graph drop-down list.
(To omit a data type from graphing, select
None from the Appears on Graph list.)
AND
Select the appearance of its data curve (Solid,
Wide, Dotted, or Dashed) from the Line Type
drop-down list.
WARNING:
Because the Y-axis ranges for intensity and
ratio data can differ so greatly, we strongly
recommend that you configure separate
graphs for intensity and ratio data.
3
From the Graph drop-down list, select a graph
for which you have assigned data in Step 2.
4
Select the Show Graph check box if you want
to enable display the selected graph
(depending on the state of the Show or Hide
Graphs command in the Windows menu). If
you want to configure the graph, continue to
Step 5. Otherwise skip to Step 9.
OR
If you do not want to display the selected
graph, clear the Show Graph check box. All
options below the check box will become
unavailable. Now skip to Step 9.
5
If necessary, type a more descriptive title for
the selected graph in the Title text box under
the Graph drop-down list.
6
Configure the Y Axis options by
Typing an axis title in the Title text box of the Y
Axis option group,
Selecting the minimum and maximum
grayscale or ratio values you want to plot,
using the Range spin boxes, and
Selecting the number of tick marks to display
on the Y-axis, using the Ticks spin box. The
Tick Marks Every status line will update to
reflect the values selected in the Range and
Ticks spin boxes.
MetaFluor
287
Version 7.0
MetaFluor User’s Guide
7
If you want to use an inverted scale, such that
a grayscale or ratio value of zero is at the top
of the graph, select the Invert Axis check box.
AND
If you want to use a logarithmic scale, select
the Log Scaling check box.
8
Configure the X Axis options by
Selecting a time unit (Seconds, Minutes, or
Hours) from the Time drop-down list,
Selecting a range for the X-axis from the
Range spin box (if you selected Seconds or
Minutes as the Time unit, the Range value
should be divisible by six), and
Selecting the number of tick marks to display
on the X-axis, using the Ticks spin box. The
Tick Marks Every status line will update to
reflect the values selected in the Range and
Ticks spin boxes.
Note: If you are using other graphs and want
to use the same X-axis configuration, choose
Set All X Axes This Way.
9
Repeat Steps 3 - 8 for any other graphs for
which you have assigned data in Step 2.
10
When you are satisfied with your
configurations, choose OK.
MetaFluor
288
Version 7.0
MetaFluor User’s Guide
Configure Graphs - Dialog Box Options
Measured Value
Indicates which data will be assigned to the graph selected from the corresponding
Appears on Graph drop-down list.
Appears on Graph
Selects a graph to which the associated data (Wavelength 1 Average Intensity, etc.) will
be assigned. To omit a particular set of data from graphing, select None.
Line Type
Assigns a type of line (Solid, Wide, Dotted, or Dashed) to the data curve for the
associated data (Wavelength 1 Average Intensity, etc.).
Graph
Selects a measurements graph to be configured. You can select from a total of 5 graphs
and configure them as needed.
Title (Configure Graph Display options)
Assigns a title to the selected graph. The default title is Graph 1.
Show Graph
Enables display of the selected graph. (Whether the graph is actually displayed is also
depends on the state of the Show or Hide Graphs command in the Windows menu).
Title (Y Axis options)
Assigns a title to the Y-axis of the selected graph. For example, you might use "Calcium"
for a ratio graph from a fura-2 experiment.
Range… to… (Y Axis options)
Selects a minimum and maximum value for display on the Y-axis of the selected graph.
Ticks (Y Axis options)
Selects the number of tick marks to be displayed on the Y-axis of the selected graph.
Tick Marks Every (Y Axis options)
This status line will display the number of Y-axis units between each tick mark. This will
update to reflect the values selected in the Range and Ticks spin boxes.
Invert Axis
Graphs the data with the higher values for intensity, ratio, or calibrated value (for
example, pH or calcium concentration) indicated on the Y-axis towards the origin.
Log Scaling
Graphs the data using a logarithmic scale.
Time
Selects a time unit for the X-axis: Seconds, Minutes, or Hours.
MetaFluor
289
Version 7.0
MetaFluor User’s Guide
Range (X Axis options)
Selects a range of time to be displayed along the X-axis. The minimum and maximum
values will update automatically. For example, if you select a Range of 60 seconds, the
graph will update to show an X-axis range of 60 to 120 seconds when the 61st second is
reached in the experiment.
Ticks (X Axis options)
Selects the number of tick marks to be displayed on the X-axis of the selected graph.
Tick Marks Every (X Axis options)
This status line will display the number of time units between each tick mark. This will
update to reflect the values selected in the Range and Ticks spin boxes.
Set All X Axes This Way
Configures all graphs to use the current set of X Axis option settings.
OK
Accepts the current configuration of the measurements graphs and closes the dialog box.
Cancel
Cancels any changes made to the configuration of the measurements graphs and closes
the dialog box..
MetaFluor
290
Version 7.0
MetaFluor User’s Guide
Clear Graphs (Graphs Menu)
Removes all graphed data from the measurements graphs.
Use this command to clear data from the graphs so that you can start new graphs.
The Clock is not reset when the Clear Graphs command is used. To clear the graphs and
reset the Clock, use the Zero Clock command instead.
Shortcut: CTRL + C
See Also:
Zero Clock
MetaFluor
291
Version 7.0
MetaFluor User’s Guide
Clearing MetaFluor Graphs
To clear the measurements graphs, use the following procedure:
Step
Action
1
Select the Run Experiment menu.
2
Choose Clear Graph. MetaFluor will clear both
graphs.
Note: You can use CTRL + C, the keyboard
equivalent for the Clear Graph command at
any point to clear the graphs.
MetaFluor
292
Version 7.0
MetaFluor User’s Guide
Clear Measurement Regions and Graphs (Graphs
Menu)
Clears measurement regions defined by the Define Regions for Measurement
command, clears the measurement data from the graphs, and then closes the
graphs.
Use this command when you have finished measuring data and want to clear and close
the measurements graphs. Although the graphs are windows, you must use the Clear
Measurement Regions and Graphs command to close them.
If you decide to reopen the graphs, you will need to use the Define Regions for
Measurement command again. After you have defined new measurement regions, the
measurements graphs will open again.
If you want simply to remove the graphs temporarily from the desktop, but do not want to
have to use the Define Regions for Measurement command all over again, you should
use the Show or Hide Graphs command (Windows menu), or use its keyboard shortcut,
the [F8] function key.
If you want to clear the data from the measurements graphs without closing them, you
should use the Clear Graphs command.
See Also:
Define Regions for Measurement
Show or Hide Graphs
Clear Graphs
MetaFluor
293
Version 7.0
MetaFluor User’s Guide
Clearing Measurement Regions and Graphs
To clear measurement regions and close the measurements graphs, use the following
procedure:
Step
Action
1
From the Run Experiment menu, choose Clear
Measurement Regions and Graphs.
2
A message will appear, asking if you want to
clear the measurement regions from the
graphs and then close the graphs.
3
Choose Yes.
MetaFluor
294
Version 7.0
MetaFluor User’s Guide
Utilities Menu
MetaFluor
295
Version 7.0
MetaFluor User’s Guide
Play Movie from Disk (Utilities Menu)
This wizard builds an on-screen movie of a set of selected set of intensity
(wavelength) or ratio images that have been stored on disk. If you wish, you can
save the movie as a single .avi file.
Drop-in: MOVIE
The Play Movie from Disk wizard builds a movie using images that have been stored on disk.
The movie can be played forward, backward, frame-by-frame, or in a loop.
Note: Before using this command, you must first install the Movie Drop-in using the Configure
Drop-ins/Toolbars dialog box in the Meta Imaging Series Administrator.
(Click each movie control in this illustration to learn more. Press [CTRL] + [TAB] to see
the "hotspots.")
When you build a movie, you need to have enough memory to hold two sets of images: the
original stack of ratio images and those used for the movie. A "small" movie requires less
memory than a "large" movie (approximately 20 images is ideal for a movie). But that doesn't
necessarily mean you must use fewer images when building a movie. There is another way to
fit more images into memory with the use of the Zoom Tool: zoom the ratio stack to 50%
before building the movie. The movie's size will be one-fourth the size of the original, and will
require one-fourth the memory of a full-sized movie.
Note: This will affect only the amount of RAM used to play the movie. The amount of disk
space used by a movie saved as an .avi file will be the same as that for a movie whose
window size was not decreased.)
Shortcuts for Movie Controls:
[B]
Play movie backward.
<-
Play movie one frame backward.
[SPACE
BAR]
Stop the movie.
->
Play movie one frame forward.
[F]
Play movie forward.
[S]
Maximize the movie.
[ESC]
Return the movie to standard
MetaFluor
296
Version 7.0
MetaFluor User’s Guide
movie size.
Digital video information can consume large amounts of memory, particularly if the video
frames are in 24-bit color. Because of this, you may want to use one of the compression
formats if you save your movie as an .avi file. The .avi format has several standard
compression formats:
Radius Inc. Cinepak: A 32-bit video codec (compression-decompression engine) that
works best for compressing 24-bit color video images. This format provides greater
compression, higher resolution, and faster playback than the Microsoft Video codec. You
can specify your desired tradeoff between image quality and compression.
Intel Indeo Video Release 3.2: Another 32-bit video codec that works best for
compressing 24-bit color video images. As with the Cinepak codec, you can specify your
desired tradeoff between image quality and compression.
Microsoft Video 1: A 32-bit lossy compressor that works best with 8-bit and 16-bit images.
You can specify separate settings for your desired tradeoffs between (1) compression and
image quality, and (2) compression and temporal resolution.
Microsoft RLE: A 16-bit compressor that uses run-length encoding. Best for binary or 8-bit
high-contrast images.
In addition to these codecs, two uncompressed formats are also available:
Intel Indeo Video Raw (16), and
Full Frames (Uncompressed).
Note: If you are saving the movie as an .avi file and want to play it back on a Macintosh or
using the Apple QuickTime (TM) player, you must use the Cinepak codec so that the
appropriate look-up table values are saved along with the .avi information.
For more information, click the following icons to view Microsoft's Web page on
Installing and Removing Codecs in Windows, or
Troubleshooting Video Codecs in Windows 95.
(Note: Be sure to enable use of "cookies.")
See Also:
Installing Drop-ins Using the Meta Imaging Series Administrator
MetaFluor
297
Version 7.0
MetaFluor User’s Guide
Creating a Movie from a Set of Images
To build a movie from a set of intensity (wavelength) or ratio images, follow the directions
described in the wizard's dialog box, as described in the following table:
Step
Action
1
From the Utilities menu, choose Play Movie
from Disk. The Play Movie from Disk--Select
Images dialog box will appear.
2
Follow the directions described in this first
dialog box for selecting the first and last ratio
images in the movie. Then choose Next >>.
3
As each of the wizard's dialog boxes appears,
follow the directions that are described.
4
After you have followed all sets of instructions,
an image window entitled "Movie" will appear
on your desktop. You can choose Play to play
through the images, or you can choose Movie
to build a movie, which will be displayed in a
separate movie Viewer window which has a
control panel for playing the image frames,
setting the playback speed, and maximizing
the image window.
5
If you wish to save the movie as an .avi file,
choose Save As. The Save as AVI Movie File
wizard will appear. Follow the instructions for
selecting a destination file, the "per frame"
playback speed, and the compression mode.
6
When you have finished, choose Close.
MetaFluor
298
Version 7.0
MetaFluor User’s Guide
Build INF File (Utilities Menu)
Creates a new .inf file from certain types of images.
This command can be used to create a new .inf file from MetaFluor images, Image-1/FL
images, sequentially named files, multiple sequential files, a stack file, multiple stack files,
RGB .tif files, and Bio-Rad confocal TCSM (*.pic and *.cmt) files.
For MetaFluor images, this command is useful for creating a new .inf file if the original .inf file
was deleted. If you want to build an .inf file from MetaFluor images, you should select
MetaFluor Experiment as the Source Image Type.
You can also use this command to create an .inf file for Image-1/FL images where Image-1/FL
saved interlaced pair images (such that there is only one file per time point). If you want to
build an .inf file from Image-1/FL images, you should select Image-1/FL Experiment as the
Source Image Type.
MetaFluor does not need to build an .inf file for MetaGFP images; the MetaGFP .inf file can be
read directly by MetaFluor. If you do want to build an .inf file from MetaGFP images, you
should select MetaFluor Experiment as the Source Image Type.
If you have images with sequential names (not extensions) that were created in MetaMorph or
some other software, you can use the Build INF File command to create an .inf file. The
images will be renamed appropriately for experiment playback. You can specify the name of
wavelengths so that every nth image corresponds to a different wavelength. If you have
several sequential file series (such as Fluor01.tif, Fluor02.tif, Rhod01.tif, Rhod02.tif,
FITC01.tif, FITC02.tif, etc.), MetaFluor will read these images, rename them, and generate an
.inf file. Each sequence becomes a different wavelength in MetaFluor. Appropriate
experiments will consist of sequential files named FilenameXXX.tif (or any extension) where
"XXX" is a sequence number (001, 002, etc.). The wavelength control will let you skip every
nth image if the experiment has more than one wavelength. If you do want to build an .inf file
from sequential images, you should select either Sequential Files or Multiple Seq. Files as the
Source Image Type.
The Build INF File command has an option to obtain the time from the DOS timestamp on the
image file. Or you can select the spacing in time between images. The DOS stamp is only
accurate to within two seconds. If the images were saved far apart from each other (for
example, every 30 seconds), this option can be useful. Otherwise, you should specify the time
spacing that MetaFluor is to use.
The Build INF File command is useful for taking images from some external source (such as a
confocal microscope) and converting them into a form that can be analyzed by MetaFluor.
MetaFluor
299
Version 7.0
MetaFluor User’s Guide
Building an INF File for MetaFluor, MetaGFP, or
Image-1/FL Images
To build an .inf file for MetaFluor, MetaGFP, or Image-1/FL images, use the following
procedure:
Step
Action
1
From the Utilities menu, choose Build INF File.
The Build INF File dialog box will appear.
2
From the Source Image Type list, select
MetaFluor Experiment if you need to build an
.inf file for MetaFluor of MetaGFP images.
OR
Select Image-1/FL Experiment if you are
importing Image-1/FL files.
3
Choose Select First Image to specify the first
image in the experiment. The First Image
dialog box will appear. Select the icon for the
first image file. If necessary, use the Look In
list or Up One Level icon button to locate the
correct drive and folder.
4
Choose Select Last Image to specify the last
image in the experiment. The Last Image
dialog box will appear. Select the icon for the
desired image file.
5
If the image times can be determined from the
image files, select Determine from Files from
the Image Times group.
OR
Select Equally Space from the Image Times
group. Then specify the amount of time using
Equally Space Images By.
6
Choose OK. The Build INF File dialog box will
close and the .inf file will be built for the
MetaFluor or Image-1/FL images.
MetaFluor
300
Version 7.0
MetaFluor User’s Guide
Building an INF File for Sequentially Named
Images
To build an .inf file for sequential images, use the following procedure:
Step
Action
1
From the Utilities menu, choose Build INF File.
The Build INF File dialog box will appear.
2
Select the type of images that you are using to
build the .inf file from the Source Image Type
list (Sequential Files or Multiple Seq. Files).
3
Choose Select First Image to specify the first
image in the experiment. The First Image
dialog box will appear. Select the icon for the
first image file. If necessary, use the Look In
list or Up One Level icon button to locate the
correct drive and folder.
4
Choose Select Last Image to specify the last
image in the experiment. The Last Image
dialog box will appear. Select the icon for the
desired image file.
5
If you selected Sequential Files as the
selected Source Image Type in Step 2, select
the number of wavelengths using Number of
Wavelengths.
OR
If you selected Multiple Seq. Files in Step 2,
continue to Step 6.
6
Select the number of digits in the sequence
number using Number of Sequence Digits.
7
If you selected Multiple Seq. Files in Step 2,
type the base names for the second and third
wavelengths in the 2 and 3 text boxes of Base
Names for Wavelengths 2 – 4.
OR
If you selected Sequential Files in Step 2, skip
to Step 9.
8
If the image times can be determined from the
image files, select Determine from Files from
the Image Times group.
OR
Select Equally Space from the Image Times
group. Then specify the amount of time using
Equally Space Images By.
9
Choose OK. The Build INF File dialog box will
close and the .inf file will be built for the
sequential images.
MetaFluor
301
Version 7.0
MetaFluor User’s Guide
Building an INF File for Image Stacks
To build an .inf file for stack images, use the following procedure:
Step
Action
1
From the Utilities menu, choose Build INF File.
The Build INF File dialog box will appear.
2
Select the type of images that you are using to
build the .inf file from the Source Image Type
list (Stack File or Multiple Stack Files).
3
Choose Select Stack Image. Then select the
icon for the .stk file. (If necessary, use the
Look In list or Up One Level icon button to
locate the correct drive and folder.) Then
choose Open.
4
If you selected Stack File in Step 2, select the
number of wavelengths using Number of
Wavelengths. Then skip to Step 6.
OR
If you selected Multiple Stack Files, skip to
Step 5.
5
If you selected Multiple Stack Files in Step 2,
type the base names for the second and third
wavelengths in the 2 and 3 text boxes of Base
Names for Wavelengths 2 – 4.
OR
If you selected Stack File in Step 2, skip to
Step 6.
6
In the Equally Space Images By option,
specify the amount of time between images.
7
Choose OK. The Build INF File dialog box will
close and the .inf file will be built for the stack
images.
MetaFluor
302
Version 7.0
MetaFluor User’s Guide
Building an INF File for RGB TIFF Images
To build an .inf file for RGB TIFF images, use the following procedure:
Step
Action
1
From the Utilities menu, choose Build INF File.
The Build INF File dialog box will appear.
2
From the Source Image Type list, select
Sequential RGB TIFF Files.
3
Choose Select First Image to specify the first
image in the experiment. The First Image
dialog box will appear. Select the icon for the
first image file. (If necessary, use the Look In
list or Up One Level icon button to locate the
correct drive and folder.) Then choose Open.
4
Choose Select Last Image to specify the last
image in the experiment. The Last Image
dialog box will appear. Select the icon for the
desired image file. Then choose Open.
5
From the Number of Wavelengths spin box,
select the number of wavelengths in the
experiment.
6
If the image times can be determined from the
image files, select Determine from Files from
the Image Times group.
OR
Select Equally Space from the Image Times
group. Then specify the amount of time using
Equally Space Images By.
7
Choose OK.
8
A message will appear, asking you to verify
the .inf file creation. Choose OK. The
Destination Name dialog box will appear.
9
Type a name for the .inf file in the File Name
text box. Then choose Save. The Sequential
RGB TIFF Files dialog box will appear.
10
Select which color components are to be
loaded into which wavelength image by
selecting a color component from the Load
Wavelength 1 With, Load Wavelength 2 With,
and Load Wavelength 3 With lists.
11
Choose OK. The Build INF dialog box will
close, and the .inf file will be built for the RGB
.tif files.
MetaFluor
303
Version 7.0
MetaFluor User’s Guide
Building an INF File for Bio-Rad Confocal TCSM
Images
To build an .inf file for Bio-Rad confocal TCSM images, use the following procedure:
Step
Action
1
From the Utilities menu, choose Build INF File.
The Build INF File dialog box will appear.
2
From the Source Image Type list, select
Biorad TCSM Files.
3
Choose Select TCSM PIC. The First Image
dialog box will appear. Select the icon for the
desired .pic file. (If necessary, use the Look In
list or Up One Level icon button to locate the
correct drive and folder.) Then choose Open.
4
With the Number of Wavelengths spin box,
select 1 if you are importing single images, or
select 2 if you are importing side-by-side
paired images.
5
If you selected 2 in Step 4 and want the left
side of the .pic to be the Wavelength 1 image,
select [Wavelength 1] : [Wavelength 2] from
the Image Position option button group. If you
want the Wavelength 1 image to be on the
right, select [Wavelength 2] : [Wavelength 1].
6
Choose OK.
MetaFluor
304
Version 7.0
MetaFluor User’s Guide
Build INF File - Dialog Box Options
Source Image Type
Specifies the type of images that you are using to build an .inf file. Select:
MetaFluor Experiment if you want to rebuild an .inf file for a MetaFluor or MetaGFP
experiment after the original .inf file was deleted.
Image-1/FL Experiment if you want to build an .inf file for interlaced image pairs from an
Image-1/FL experiment so that you can open the Image-1/FL experiment in MetaFluor.
Sequential Files if you want to build an .inf file for images that were created by MetaMorph or
some other type of software that saves images with sequential names sharing the same
extension.
Multiple Seq. Files if you have several series of sequential files. MetaFluor will read the
images and rename before creating an .inf file. Select Stack File if the images are in a .stk or
.spe file.
Stack File if the images are stored as planes in a single stack file.
Multiple Stack Files if the images for each wavelength are stored in separate stack files. Stack
1 will correspond to Wavelength 1, Stack 2 will correspond to Wavelength 2, etc. If you select
this image file type, all stack files must be located in the same folder. The .inf file that will be
created, as well as all of the sequentially numbered TIFF files (for example, Image1.001,
Image2.001, etc.) will be stored in the same folder.
Sequential RGB TIFF Files if the images are stored in RGB .tif files. MetaFluor reads the RGB
images and then resaves the image data into separate files which are named according to
MetaFluor conventions (Filename1.001, Filename2.001, etc.). If the RGB TIFF images are
from a Zeiss confocal microscope, an experiment notebook file containing the Zeiss
annotation information for each image will be created and saved. If you select Sequential RGB
TIFF Files, the Sequential RGB TIFF Files dialog box will appear. This window allows you to
specify which color components are to be loaded into which wavelength by selecting Red
Component, Green Component, or Blue Component from the Load Wavelength 1, Load
Wavelength 2, and Load Wavelength 3 drop-down lists.
BioRad TCSM Files if the images are stored as Bio-Rad TCSM .pic files. After MetaFluor
performs the conversion, you will have the .inf file, a Notebook (*.txt) file, two .tif files
containing the background images, and a series of image files (Filename.001, Filename.002,
and so on). These will all be stored in the same directory as the original .pic file. Note: You
must have both the .pic file and the .cmt text file available for the conversion, and they must
be in the same directory. The .cmt text file contains the annotation text that specifies the
experimental event marks and image timestamps. These will be displayed in the new
Notebook file.
Select First Image
Specifies the first image of the experiment. When you select Multiple Seq. Files,
MetaFluor assumes that each of the series of sequences has the same sequence
numbering.
Select Stack Image
When Stack File is selected as the Source Image Type, this command button specifies
the stack file containing the images from which the .inf and ratio images will be created.
MetaFluor
305
Version 7.0
MetaFluor User’s Guide
When you select Multiple Stack Files as the Source Image Type, this command button
selects the stack file for the first Wavelength image.
Select TCSM PIC
Specifies the Bio-Rad confocal TCSM .pic image file to be used.
Select Last Image
Specifies the last image of the experiment. When Multiple Seq. Files is selected,
MetaFluor assumes that each of the series of sequences has the same sequence
numbering.
Number of Wavelengths
Specifies the number of wavelengths for the experiment. When you specify more than
one wavelength, MetaFluor will skip every n images to accommodate the additional
wavelengths.
Image Position
Selects an arrangement for the confocal image pair, with the Wavelength 1 image on the
left or on the right. This option appears only if you have selected Biorad TCSM Files as
the Source Image Type.
Base Names for Wavelengths 2 - 4
This option appears only if you have selected Multiple Seq. Files or Multiple Stack Files
as the Source Image Type. When you want to build an .inf file from a series of sequential
files that have different base names, such as Fluor01.tif, Fluor02.tif, Rhod01.tif,
Rhod02.tif, FITC01.tif, FITC02.tif, etc., you will need to specify the base names for the
second, third, and fourth series. Use this option to specify the base names for the other
wavelength series.
Image Times
Select Determine from Files if the times can be determined from the image files.
Otherwise select Equally Space and set the time using Equally Space Images By.
Equally Space Images By
Use this option to specify the amount of time between images if you selected Equally
Space from the Image Times group. For some source types, you must equally space
images because the times cannot be determined from the images. You must use this
mode if you select Multiple Stack Files as the Source Image Type.
Description
Provides a description of the type of experiment that has the selected Source Image
Type.
OK
Builds the .inf file.
Cancel
Cancels the command.
MetaFluor
306
Version 7.0
MetaFluor User’s Guide
Delete Images (Utilities Menu)
Selectively deletes images from a stored experiment.
Use this command to delete unwanted images from an experiment. After you have marked the
images you want to delete, MetaFluor will delete them and reopen the experiment with the
remaining images. The experiment must be open before you can delete images from it.
MetaFluor
307
Version 7.0
MetaFluor User’s Guide
Deleting Images from a Stored Experiment
To delete images from a stored experiment, use the following procedure:
Step
Action
1
Open the experiment from which you want to
delete images, using the Open Experiment
command.
2
From the Run Experiment menu, choose
Experiment Control Panel. The Experiment
Control Panel will appear. Leave this open in
the MetaFluor window.
3
From the Utilities menu, choose Delete
Images. The Delete Images dialog box will
appear.
4
Use the Frame slider in the Experiment
Control Panel to step through your experiment,
frame by frame. The highlighted frame in the
Delete Images dialog box's list box will update
as you do this.
5
When you find a frame that you want to delete,
double-click its image number in the list box.
This will mark the image with an asterisk (*).
Only marked images will be deleted.
If you don't want to delete an image that you
have marked, double-click its image number
again to remove the asterisk.
6
When you have marked all unwanted frames,
choose Delete. A message will appear, asking
you to confirm your selection.
If you want to delete the images listed in the
message, choose OK. Otherwise choose
Cancel to cancel the Delete Image command.
7
MetaFluor will then delete the images and
display another confirmation message.
Choose OK, and the experiment will be
reopened, minus the unwanted images.
MetaFluor
308
Version 7.0
MetaFluor User’s Guide
Delete Images - Dialog Box Options
Index/Time List Box
Displays a list of all of the images in the experiment and their times. Those marked with
an asterisk (*) will be deleted when you choose Delete. Double-clicking an image number
and time toggles the asterisk on and off.
Delete
Displays a confirmation dialog box listing the images you have selected to delete. When
you confirm this message by choosing OK, MetaFluor will delete the images marked with
an asterisk (*).
Cancel
Cancels the command.
MetaFluor
309
Version 7.0
MetaFluor User’s Guide
Import N-Dimensional Imaging Sequence
This wizard imports a sequence of images acquired with a "multi-dimensional"
protocol. An example might be a Z-series or a series of wavelength images (first
dimension) that were acquired at a number of stage positions (second dimension)
at a number of timepoints (third dimension).
Drop-in: IMPORTND
Use this command to import sequential images into MetaFluor that were acquired using a
"multi-dimensional" acquisition sequence. Such images may have been generated by journals
in the MetaMorph Imaging System. An example of such a sequence is the case where a Zseries has been acquired at each location in a multi-well plate. This acquisition sequence is
then repeated at each of a number of timepoints.
Before using this command, you must install its drop-in, IMPORTND, using the MetaMorph
Meta Imaging Series Administrator.
See Also:
Installing Drop-ins Using the Meta Imaging Series Administrator
MetaFluor
310
Version 7.0
MetaFluor User’s Guide
Importing an N-Dimensional Imaging Sequence
To import an N-dimensional imaging sequence, use the following procedure:
Step
Action
1
From the Utilities menu, choose Import NDimensional Imaging Sequence. The Import
N-Dimensional Imaging Sequence dialog box
will appear.
2
Choose First Image. The Select First Image
dialog box will appear.
3
Select the icon representing the first image in
the sequence, and choose Open to return to
the Import N-Dimensional Imaging Sequence
dialog box.
4
Use Number of Sequence Digits in File Name
to specify the number of spaces in the file
name that are taken up by the sequence
number.
5
Use the other spin boxes to specify the
"dimensions" of the image sequence, as
described in the dialog box.
6
When you have finished, choose Next and
follow the directions described in the second
dialog box for specifying the stage position, Zdistance, number of wavelengths, and the
starting wavelength. Then choose Next.
7
In the third dialog box that appears, choose
Select File, and type a file name for the
imported files' new .inf file in the File Name
text box of the INF Experiment Name dialog
box that appears. Then choose Save to return
to the Import N-Dimensional Imaging
Sequence dialog box.
8
Choose OK. The final page of the Import NDimensional Imaging Sequence wizard will
appear.
9
When you are ready, choose Begin. The
Status line will indicate the progress of the
import procedure.
10
When you have finished, choose Close.
MetaFluor
311
Version 7.0
MetaFluor User’s Guide
Save as 8-Bit Image (Utilities Menu)
Saves a 16-bit wavelength image as an 8-bit .tif file.
Drop-in: SAVE8BIT
Use this command when you want to convert a 16-bit wavelength image to 8-bit format. This
will allow you to export the image for use by programs that require an 8-bit format, such as a
desktop publishing or word processing program. The grayscale values in the image will be
scaled automatically.
Before using this command, you must install its drop-in, SAVE8BIT, using the MetaMorph
Meta Imaging Series Administrator.
See Also:
Installing Drop-ins Using the Meta Imaging Series Administrator
Scale 16-Bit Image
MetaFluor
312
Version 7.0
MetaFluor User’s Guide
Saving as an 8-Bit Image
To save a 16-bit wavelength image in an 8-bit .tif image file, use the following procedure.
(Note: You must first open a stored experiment that has its wavelength images saved as
16-bit images.)
Step
Action
1
With the pointer, click the title bar of the
wavelength image that you want to save, so
that its window becomes the active window.
2
From the Utilities menu, choose Save as 8-Bit
Image. The Save as 8-Bit Image dialog box
will appear.
3
In the File Name text box, type the name
under which you want to save the image. If
necessary, use the Save In list or Up One
Level icon button to specify a different drive or
folder in which to save the image file.
4
Choose Save. The image file will be saved
with the extension ".tif" appended to the file
name, and the dialog box will close
automatically.
MetaFluor
313
Version 7.0
MetaFluor User’s Guide
Save as 8-Bit Image - Dialog Box Options
File Name
Lists the name of the currently selected file.
Files of Type
Determines the file format of the files displayed in the File Name list. The default format is
*.TIF.
Save In
Displays the currently selected folder. Click the icon for the desired folder to display its
files. Click the Up One Level icon button to go up one level in the directory structure.
Save
Saves the 16-bit wavelength image as an 8-bit .tif file.
Cancel
Cancels the command.
MetaFluor
314
Version 7.0
MetaFluor User’s Guide
Spot Measurements (Utilities Menu)
Displays the grayscale intensities and ratio values from all wavelength and ratio
images for the pixel selected by the pointer when you click over a location in one
of the images. If the images have been calibrated, the calibrated value will also be
displayed.
Use this command to determine typical intensity, ratio, and calibrated values. In addition to
displaying the intensity, ratio, and calibrated values, this command also displays the location
(X and Y coordinates) of the measurement. Although the intensity values are displayed in
MetaFluor’s Status Bar, the ratio and calibrated values are not. Therefore, you should use the
Spot Measurements command when you need to check these values quickly. This command
is useful, for example, in determining the darkest and brightest values in the images when
setting up fixed scaling for 16-bit images.
This command is available whenever you display images in an image window on your
computer screen. If you are displaying your images on an external video monitor, you can use
this command on the image displayed for the Define Regions for Measurement command
(Graphs menu).
See Also:
Define Regions for Measurement
MetaFluor
315
Version 7.0
MetaFluor User’s Guide
Making Spot Measurements
To make spot measurements, use the following procedure:
Step
Action
1
From the Utilities menu, choose Spot
Measurements. The Spot Measurements
dialog box will appear.
2
Position the pointer over one of the
wavelength or ratio images at the location you
want to measure, and press the mouse button.
3
MetaFluor will display the coordinates for the
measurements and the intensity and
calculated measurements in the Spot
Measurements dialog box.
4
Repeat Step 2 for each location you want to
measure.
5
Choose Close when you have finished.
MetaFluor
316
Version 7.0
MetaFluor User’s Guide
Spot Measurements - Dialog Box Options
Measurement At (XY:)
Displays the X and Y coordinates of the current measurement.
Wavelength N (W#)
Displays the gray level intensities at the selected location for the pertinent wavelength
image.
Ratio N (R#)
Displays the ratio value at the selected location for the pertinent ratio image.
Calibrate N (C#)
Displays the calibrated value at the selected location. The calibrated value will be
displayed only if the calibration has been configured.
More >>
Expands the dialog box. When the dialog box is expanded, the titles of the parameters
will be given in full. When you choose Less << to condense the dialog box, an
abbreviated form of the parameter titles (shown in parentheses in the preceding four
descriptions) will be displayed.
Less <<
Condenses the dialog box (see preceding description for the More >> button).
Close
Closes the dialog box.
MetaFluor
317
Version 7.0
MetaFluor User’s Guide
Configure Intensifier Gain Control (Utilities Menu)
Configures the control of the intensifier CCD camera settings when using
computer-controlled gain.
Drop-in: ICCD
Use this command before using the Set Intensifier Gain command and the Set Camera Level
and Gain command with an intensified CCD camera (and the PI Video ICCD Settings
command, if you are using this camera). Configure Intensifier Gain Control allows you to
specify the camera model, serial port, and baud rate. It also allows you to select whether the
camera is controlled by the computer or by the front-panel knobs on the intensifier. The
camera must be controlled by the computer to use the intensifier gain commands in
MetaFluor.
You must use this command before using the Set Intensifier Gain, the Set Camera Level and
Gain, and PI Video ICCD Settings commands. These three commands will be unavailable until
you do so.
Before using this command, you must install its drop-in, ICCD, using the MetaMorph Meta
Imaging Series Administrator.
See Also:
Installing Drop-ins Using the Meta Imaging Series Administrator
Set Intensifier Gain
Set Camera Level and Gain
PI Video ICCD Settings
MetaFluor
318
Version 7.0
MetaFluor User’s Guide
Configuring the Intensifier Gain Control
To configure the intensifier gain control for use with an intensified CCD camera, use the
following procedure:
Step
Action
1
From the Utilities menu, choose Configure
Intensifier Gain Control. The Configure
Intensifier Gain Control dialog box will appear.
2
Select your camera's model name from the
Intensifier Model drop-down list.
3
Select the serial port used to connect the
camera from the Serial Port drop-down list.
4
Select the appropriate baud rate for the
connection from the Baud drop-down list.
5
To control the intensified CCD camera using
the other intensified gain control commands in
MetaFluor, select Computer from the Camera
Control group.
Note: If your camera requires manual control
for some features on the camera, select
Manual before performing those operations.
6
Choose OK.
MetaFluor
319
Version 7.0
MetaFluor User’s Guide
Configure Intensifier Gain Control - Dialog Box
Options
Intensifier Model
Specifies the intensified CCD camera model name.
Serial Port
Specifies the serial port used to connect the camera to the computer.
Baud
Specifies the baud rate used for the connection between the camera and the computer.
Camera Control
Switches between manual control and computer control of the camera. Use Manual when
you want to change settings on the camera that can only be accessed on the camera
when it is not controlled by the computer. Use Computer when you want to control the
camera from MetaFluor.
OK
Configures the intensifier gain control options.
Cancel
Cancels the command.
MetaFluor
320
Version 7.0
MetaFluor User’s Guide
Set Intensifier Gain (Utilities Menu)
Allows the user to set the intensifier gain when using an intensified CCD camera.
Drop-in: ICCD
You can use this command to set the intensifier gain interactively during acquisition. The
same gain is used for all wavelengths that are acquired. You can change the gain setting by
using a slider. Once you have changed the slider's value, the camera will use that value for all
wavelengths acquired, starting with the next acquisition.
Alternatively, you can select intensifier gain settings for each wavelength prior to acquisition
and then tell MetaFluor to switch the intensifier automatically to the gain setting selected for a
wavelength right before acquiring that wavelength. When using this alternate method, you
may want to specify a delay after the gain is set so that there is enough time before the
acquisition for the gain to "lock in" to the correct setting.
Before using this command, you must install its drop-in, ICCD, using the MetaMorph Meta
Imaging Series Administrator. You must also configure the intensifier using the Configure
Intensifier Gain Control command and specify that the camera is controlled by the computer.
See Also:
Installing Drop-ins Using the Meta Imaging Series Administrator
Configure Intensifier Gain Control
Set Camera Level and Gain
PI Video ICCD Settings
MetaFluor
321
Version 7.0
MetaFluor User’s Guide
Setting the Intensifier Gain
To set the intensifier gain, use the following procedure:
Step
Action
1
From the Utilities menu, choose Set Intensifier
Gain. The Set Intensifier Gain dialog box will
appear.
2
If you want to set the gain values for each
wavelength prior to acquisition, select the Set
Intensifier Gain Before Acquiring Wavelengths
check box.
OR
If you want to set the gain during acquisition,
clear the Set Intensifier Gain Before Acquiring
Wavelengths check box and skip to Step 5.
3
Select the Set Wavelength 1 To check box if
you want the gain for Wavelength 1 to be
changed automatically during acquisition.
Then type the desired gain value in its text
box.
If you want a delay to occur after the gain has
been changed, select the desired length using
After Setting Gain, Delay for… ms.
4
Repeat Step 3 for any other wavelengths.
Then skip to Step 6.
5
If you want to set the gain interactively, select
the desired gain from the Intensifier Gain
slider. You can choose Use Current to set that
gain for the corresponding wavelength.
6
Begin your experiment. If the gain is being
automatically switched by MetaFluor, you will
see the current gain value change in the
Intensifier Gain slider as the various
wavelengths are acquired.
If you are interactively changing the gain
yourself, you can change the value selected in
Intensifier Gain slider at any time.
7
Choose Close when you have finished.
MetaFluor
322
Version 7.0
MetaFluor User’s Guide
Set Intensifier Gain - Dialog Box Options
Intensifier Gain
Allows you to change the intensifier gain interactively for all wavelengths during
acquisition if Set Intensifier Gain Before Acquiring Wavelengths is disabled.
Set Intensifier Gain Before Acquiring Wavelengths
When selected, this option instructs MetaFluor to set the intensifier gain for each enabled
wavelength to the specified value. The Set Wavelength N To options will also be
unavailable when this option is disabled.
Set Wavelength 1 To
Selecting this option's check box instructs MetaFluor to set the intensifier gain
automatically to the specified value before Wavelength 1 is acquired. Type the desired
gain value in the text box. Or choose Use Current, and the value currently displayed in
the Intensifier Gain slider will appear in this option's text box. This option is available only
if Set Intensifier Gain Before Acquiring Wavelengths has also been selected.
Set Wavelength 2 To
Selecting this option's check box instructs MetaFluor to set the intensifier gain
automatically to the specified value before Wavelength 2 is acquired. Type the desired
gain value in the text box. Or choose Use Current, and the value currently displayed in
the Intensifier Gain slider will appear in this option's text box. This option is available only
if Set Intensifier Gain Before Acquiring Wavelengths has also been selected.
Set Wavelength 3 To
Selecting this option's check box instructs MetaFluor to set the intensifier gain
automatically to the specified value before Wavelength 3 is acquired. Type the desired
gain value in the text box. Or choose Use Current, and the value currently displayed in
the Intensifier Gain slider will appear in this option's text box. This option is available only
if Set Intensifier Gain Before Acquiring Wavelengths has also been selected.
Set Wavelength 4 To
Selecting this option's check box instructs MetaFluor to set the intensifier gain
automatically to the specified value before Wavelength 4 is acquired. Type the desired
gain value in the text box. Or choose Use Current, and the value currently displayed in
the Intensifier Gain slider will appear in this option's text box. This option is available only
if Set Intensifier Gain Before Acquiring Wavelengths has also been selected.
Set Wavelength 5 To
Selecting this option's check box instructs MetaFluor to set the intensifier gain
automatically to the specified value before Wavelength 5 is acquired. Type the desired
gain value in the text box. Or choose Use Current, and the value currently displayed in
the Intensifier Gain slider will appear in this option's text box. This option is available only
if Set Intensifier Gain Before Acquiring Wavelengths has also been selected.
Use Current
Displays the value currently displayed in the Intensifier Gain slider in the gain text box for
the associated wavelength.
After Setting Gain, Delay for… ms
MetaFluor
323
Version 7.0
MetaFluor User’s Guide
Specifies the length of the delay to occur before the next acquisition once the gain is
changed.
Close
Closes the dialog box.
MetaFluor
324
Version 7.0
MetaFluor User’s Guide
Set Camera Level and Gain (Utilities Menu)
Sets the intensified CCD camera's black level and video gain.
Drop-in: ICCD
Use this command to change the ICCD camera's black level and video gain. The control of the
black level and video gain depends on the particular camera used. For some cameras, the
black level and video gain can be set only by using the computer after control of the camera
has been turned over the computer. In some cases, you may be allowed to change the black
level and video gain either manually or with this command. However, some cameras do not
support this command, and you must change the black level and video gain manually.
Before using this command, you must install its drop-in, ICCD, using the MetaMorph Meta
Imaging Series Administrator. You must also configure the intensifier using the Configure
Intensifier Gain Control command and specify that the camera is controlled by the computer.
See Also:
Installing Drop-ins Using the Meta Imaging Series Administrator
Configure Intensifier Gain Control
Set Intensifier Gain
PI Video ICCD Settings
MetaFluor
325
Version 7.0
MetaFluor User’s Guide
Setting the Camera Level and Gain
To set the ICCD camera black level and gain, use the following procedure:
Step
Action
1
From the Utilities menu, choose Set Camera
Level and Gain. The Set CCD Level and Gain
dialog box will appear.
2
Select the desired black level value from the
Black Level slider.
3
Select the desired video gain value from the
Video Gain slider.
4
Choose Close.
MetaFluor
326
Version 7.0
MetaFluor User’s Guide
Set Camera Level and Gain - Dialog Box Options
Black Level
Specifies the current black level value used by the intensified CCD camera. For some
cameras, the black level and video gain can be set only by using the computer after
control of the camera has been turned over the computer. In some cases, you may be
allowed to change the black level and video gain either manually or with this command.
However, some cameras do not support this command and you must change the black
level and video gain manually.
Video Gain
Specifies the current video used by the intensified CCD camera. For some cameras, the
black level and video gain can be set only by using the computer after control of the
camera has been turned over the computer. In some cases, you may be allowed to
change the black level and video gain either manually or with this command. However,
some cameras do not support this command and you must change the black level and
video gain manually.
Close
Closes the dialog box.
MetaFluor
327
Version 7.0
MetaFluor User’s Guide
PI Video ICCD Settings (Utilities Menu)
Changes the ICCD operating temperature and resets the intensifier if it shuts off
due to overload. If you configured the system for direct gain control from the
computer, additional setting controls that appear on the controller front panel will
also be available.
Drop-in: ICCD
Use this command to reset the intensifier if it shuts itself down due to overload. You can also
use the PI Video ICCD Settings command to specify an operating temperature for the cooled
ICCD (the default setting is -10 degrees Centigrade).
If you specified direct control of the ICCD by the computer with the Configure Intensifier Gain
Control command, a dozen other setting controls will appear in the PI Video ICCD Settings
dialog box. For the most part, these correspond to controls that appear on the ICCD controller
box, and include such options as enabling or disabling Auto-Black Level, Automatic Gain
Control, responsiveness to external triggers, Micro-Channel Plate (MCP) protection circuitry,
and the like.
Before using this command, you must install its drop-in, ICCD, using the MetaMorph Meta
Imaging Series Administrator. You must also configure the intensifier using the Configure
Intensifier Gain Control command.
See Also:
Installing Drop-ins Using the Meta Imaging Series Administrator
Configure Intensifier Gain Control
Set Intensifier Gain
Set Camera Level and Gain
MetaFluor
328
Version 7.0
MetaFluor User’s Guide
Specifying the PI Video ICCD Settings
To specify the PI video ICCD settings, use the following procedure:
Step
Action
1
Follow the directions for configuring the
intensifier gain, selecting one of the PI Video
ICCD entries from the Intensifier Model dropdown list box.
2
From the Utilities menu, select PI Video ICCD
Settings. The PI Video ICCD Settings dialog
box will appear.
3
If you want to change the operating
temperature of the ICCD, use the Temperature
Set Point spin box to specify the new
temperature. The default setting is
-10 degrees C.
4
If the intensifier has shut down due to
overload, choose Reset Intensifier If It Shut Off
Due to Overload. (Be sure all input to the
camera is off!)
5
If you selected control of the ICCD by the
control box (PI Video ICCD - Control Box)
when you used the Configure Intensifier Gain
Control command, you have finished. Now
skip to Step 9.
OR
If you selected direct control of the ICCD by
the computer (PI Video ICCD - Direct) when
you used the Configure Intensifier gain Control
command, you will see some additional
options in the PI Video ICCD Settings dialog
box. Continue to Step 6.
6
Depending on your experimental conditions,
select or clear the Advanced Settings check
boxes as necessary.
Note: If you are performing quantitative
densitometric or ratiometric analysis of your
images, you should leave Enable Automatic
Gain Control deselected.
7
If you are using an integrating ICCD, you can
specify the number of video frames to be
integrated by using Frames to Integrate.
8
If you need to reset Advanced Settings or
Frames to Integrate to the default values,
choose Reset to Defaults.
9
Choose Close to close the dialog box.
MetaFluor
329
Version 7.0
MetaFluor User’s Guide
PI Video ICCD Settings - Dialog Box Options
Temperature Set Point
Specifies the operating temperature of the cooled ICCD. The default setting is -10
degrees C.
Reset Intensifier If It Shut Off Due to Overload
If your ICCD becomes saturated due to an overload of input, it will shut down as a
protective measure. When this happens, you can reset it by choosing this command
button.
Advanced Settings
These check boxes can be selected or cleared independently, thereby emulating the
controls on the ICCD controller box. These options will only be displayed if you selected
PI Video ICCD - Direct as the Intensifier Model in the Configure Intensifier Gain Control
dialog box. These options include the following:
Enable Micro-Channel Plate Protection Circuitry (default = enabled)
Enable Gamma of 0.45 (default = disabled)
Enable Automatic Gain Control (default = disabled)
Enable Continuous (CW) Intensifier Mode (default = enabled)
Positive Polarity EXT Trigger (default = enabled)
Not EXT Trigger Enabled (default = enabled)
Enable Odd Field for Trigger and Integration (default = enabled)
Enable Any Field for Trigger and Integration (default = enabled)
Turn Off Auto-Black Level (default = enabled)
INVERT Valid Polarity (default = enabled)
Frames to Integrate
If you are using an integrating ICCD, this option specifies the number of video frames to
be integrated. A setting of 0 specifies no integration.
Reset to Defaults
Resets the Advanced Settings check boxes and Frames to Integrate spin box to their
default settings.
Close
Closes the dialog box.
MetaFluor
330
Version 7.0
MetaFluor User’s Guide
Convert PI MultiViewer Images (Utilities Menu)
Converts "split-screen" images from a single-wavelength experiment, such as
those acquired with a Princeton Instruments MultiViewer, into separate singleframe images that can be stored as a dual-wavelength experiment.
Drop-in: PIMVIEW
Use this command to create single-frame images from paired "split-screen" images, such as
those captured with the PI MultiViewer. Convert PI MultiViewer Images functions as a
"wizard," presenting a series of four dialog boxes that walk you through the processes of
selecting source images, defining the location of the split between the paired half-frame
images, aligning the two images with each other, and executing the conversion. An
experiment information (*.inf) file will be created automatically, using the name that you
specify. The converted images can then be "played back" and analyzed as with any dualwavelength experiment whose images were acquired with a conventional camera.
The Convert PI MultiViewer Images drop-in command is available only when there is no
experiment currently open. If you are currently running an experiment or playing one back, you
will need to close the experiment first before using this command.
See Also:
Installing Drop-ins Using the Meta Imaging Series Administrator
MetaFluor
331
Version 7.0
MetaFluor User’s Guide
Converting PI MultiViewer Images
To convert "split-screen" images into separate single-frame images, use the following
procedure:
Step
1
Action
From the Utilities menu, choose Convert PI
MultiViewer Images. The Convert PI
MultiViewer Experiment dialog box will appear.
This first page presented by the Convert PI
MultiViewer Images wizard is used for
selecting the source images and defining the
orientation of the split between the paired
images.
2
Choose Select. The Select Information File
(INF File) dialog box will appear.
AND
Select the .inf file corresponding to the
experiment whose images you want to
convert. If necessary, use the Look In dropdown list box or Up One Level icon button to
locate the correct drive and folder. Then
choose Open.
3
From the How Does the PI MultiViewer Split
the Image group, select the orientation of the
split between the paired source images:
Vertically (Wave 1 Above Wave 2) or
Horizontally (Wave 1 to the Left of Wave 2).
4
Choose OK. The Convert PI MultiViewer
Experiment dialog box will close, and the
Define Split in Image dialog box will appear.
This second page in the wizard is used for
specifying the precise location of the split line
between the two paired images.
5
Use the Select an Image from the Experiment
slider to locate a suitable frame from among
the experimental source images.
6
If you want to adjust the contrast of the image,
you can either have MetaFluor do so
automatically by selecting the Use Automatic
Scaling check box, so that a check mark
appears in it.
Or you can select the scaling manually by
clearing the Use Automatic Scaling check box
and adjusting the intensity scaling limits with
the Low and High sliders.
7
Now you can adjust the location of the split
line between the two paired images. Drag the
red split line until it is located as precisely as
possible between the two half-images.
8
Choose OK. The Define Split in Image dialog
box will close, and the Align Top and Bottom
MetaFluor
332
Version 7.0
MetaFluor User’s Guide
dialog box or the Align Left and Right dialog
box will appear, depending on whether you are
using a vertical or horizontal split.
This third page in the wizard is used for
adjusting the alignment between the two halfimages as precisely as possible so as to
obtain meaningful ratio images after the
source images are converted.
9
From the View Alignment Image As group,
select the method you want to use to view how
well the superimposed half-images are lined
up. Select:
Subtraction to use an image that subtracts the
grayscale values of the second image from
those the first, pixel by pixel,
Average to use an image that takes an
average of the grayscale values of
corresponding pixels in the two images,
Color to use an image in which the first halfimage is rendered in red and the second is
rendered in green, or
Ratio to use an image constructed by "ratioing"
the pixel values in first image by those of the
second image.
10
If necessary, use the Select an Image from the
Experiment slider to locate a suitable frame
from among the experimental source images.
11
As before, if you want to adjust the contrast of
the alignment image, you can either have
MetaFluor do so automatically by selecting the
Use Automatic Scaling check box, so that a
check mark appears in it.
Or you can select the scaling manually by
clearing the Use Automatic Scaling check box
and adjusting the intensity scaling limits with
the Low and High sliders.
12
Now you can adjust the alignment of the two
images. Use the Left, Right, Up, and Down
buttons to shift the second (bottom, or right)
image relative to the first (top, or left). The
offset between the two images, relative to their
original alignment, will be indicated by the
Current Offset status line.
13
When you have finished, choose OK. The
Align Top and Bottom (or Align Left and Right)
dialog box will close, and the Convert
MultiViewer Experiment dialog box will appear.
This last page of the wizard is used for
carrying out the conversion process.
14
Choose Select. The New Experiment File (INF
File) dialog box will appear.
AND
Type a name for the .inf file for the newly
MetaFluor
333
Version 7.0
MetaFluor User’s Guide
converted images in the File Name text box. .
If necessary, use the Save In drop-down list
box or Up One Level icon button to locate the
desired drive and folder. Then choose Save.
15
When you are ready, choose Begin.
A progress meter will appear at the bottom of
the dialog box, indicating the progress of the
conversion process, and the names of the
newly created images will be displayed in a
status line. When the process is complete, the
dialog box will close automatically.
MetaFluor
334
Version 7.0
MetaFluor User’s Guide
Convert PI MultiViewer Experiment - Dialog Box
Options
Select
Opens the Select Information File (INF File) dialog box, from which you will select the .inf
file for the original MultiViewer experiment whose images you want to convert.
How Does the PI MultiViewer Split the Image
Selects the orientation of the split between the paired half-images in the MultiViewer
image frames. If the images are paired one above the other, you should select Vertically.
If the images are paired side by side, you should select Horizontally.
OK
Accepts the dialog box settings, closes the Convert PI MultiViewer Experiment dialog
box, and opens the Define Split in Image dialog box.
Cancel
Cancels the Convert PI MultiViewer Experiment command.
MetaFluor
335
Version 7.0
MetaFluor User’s Guide
Convert MultiViewer Experiment - Dialog Box
Options
Select
Opens the New Experiment File (INF File) dialog box, in which you will specify a name for
the new .inf file for the converted images.
Begin
Carries out the conversion of the PI MultiViewer images to separate, MetaFluorcompatible images.
Cancel
Cancels the Convert PI MultiViewer Experiment command.
MetaFluor
336
Version 7.0
MetaFluor User’s Guide
Define Split in Image - Dialog Box Options
Select an Image from the Experiment
Selects a suitable source image for viewing while adjusting the location of the split line
between the MultiViewer image pair.
Use Automatic Scaling
Scales the 16-bit source image automatically to an 8-bit display, setting the lowest
intensity value in the original image to gray level 0 and setting the highest intensity value
to gray level 255. When this check box is selected, Low and High will be unavailable.
Clearing this check box will enable the use of Low and High.
Low
Selects a grayscale intensity value in the source image that will be scaled to gray level 0
in an 8-bit display. This option will be unavailable if Use Automatic Scaling has been
selected.
High
Selects a grayscale intensity value in the source image that will be scaled to gray level
255 in an 8-bit display. This option will be unavailable if Use Automatic Scaling has been
selected.
OK
Accepts the split line location setting, closes the Define Split in Image dialog box, and
opens the Align Top and Bottom dialog box.
Cancel
Cancels the Convert PI MultiViewer Experiment command.
MetaFluor
337
Version 7.0
MetaFluor User’s Guide
Align Top and Bottom/Align Left and Right Dialog Box Options
View Alignment Image As
Selects the method for viewing the alignment between the superimposed MultiViewer
image pair:
Subtraction subtracts the grayscale values of the second image from those the first, pixel by
pixel.
Average takes an average of the grayscale values of corresponding pixels in the two images.
Color renders the first half-image in red and the second is rendered in green.
Ratio is constructed by "ratioing" the pixel values in first image by those of the second image.
Align Images (Left, Right, Top, Bottom)
These four buttons align the images by "nudging" the second image (bottom, or right)
relative to the first (top, or left), one pixel at a time.
Current Offset
Indicates the current X and Y axis displacement, in pixels, of the second image with
respect to the first image.
Select an Image from the Experiment
This slider and text box allows you to select an image frame from the original experiment
for display while aligning the two paired images.
Use Automatic Scaling
Scales the 16-bit source image automatically to an 8-bit display, setting the lowest
intensity value in the original image to gray level 0 and setting the highest intensity value
to gray level 255. When this check box is selected, Low and High will be unavailable.
Selecting this check box will enable the use of the Low and High options.
Low
Selects a grayscale intensity value in the source image that will be scaled to gray level 0
in an 8-bit display. This option will be unavailable if Use Automatic Scaling has been
selected.
High
Selects a grayscale intensity value in the source image that will be scaled to gray level
255 in an 8-bit display. This option will be unavailable if Use Automatic Scaling has been
selected.
OK
Accepts the alignment settings, closes the Align Top and Bottom (or Align Left and Right)
dialog box, and opens the Convert MultiViewer Experiment dialog box.
Cancel
Cancels the Convert PI MultiViewer Experiment command.
MetaFluor
338
Version 7.0
MetaFluor User’s Guide
Twain Configure (Utilities Menu)
Selects a TWAIN-compliant device for image acquisition and specifies whether to
use the device's user interface.
Drop-in: TWAINCFG
Use this command to select a different TWAIN device and user interface option for image
acquisition without the need for exiting MetaFluor to use the external Video Driver Manager
program. The Configure Twain Driver dialog box that this command displays is the same as
that used by the Video Driver Manager program.
The dialog box displays provides a list of the TWAIN-compliant devices that you have installed
on your system. This list will reflect the TWAIN device files that reside on your system,
regardless of whether the equipment is still actually connected. Examples of TWAIN-compliant
devices include the certain video cameras, CCDs, and flat-bed scanners.
A typical use of this command is to select the Show Device User Interface check box so that
the acquisition options for the TWAIN device will appear before each acquisition. Most TWAIN
devices can save the acquisition settings from their respective device user interfaces. You can
use this feature to fine-tune your acquisition settings, save the settings, and then clear the
Show Device User Interface check box in this dialog box and proceed to acquire your images
in non-interactive mode.
See Also:
Installing Drop-ins Using the Meta Imaging Series Administrator
Introduction to the MetaMorph Video Driver Manager
MetaFluor
339
Version 7.0
MetaFluor User’s Guide
Configuring Use of a TWAIN-Compliant Device
To configure use of a TWAIN device for image acquisition, use the following procedure:
Step
Action
1
From the Utilities menu, choose Twain
Configure. The Configure Twain Driver dialog
box will appear.
2
From the Installed Devices table, select the
TWAIN device you want to use.
3
Select the Show Device User Interface check
box so that a check mark appears in it. Then
choose OK. The Configure Twain Driver dialog
box will close.
4
From the Run Experiment menu, choose
Experiment Control Panel. The Experiment
Control Panel will appear.
5
Choose Acquire. The user interface dialog box
for your selected TWAIN-compliant device will
appear.
6
Make any adjustments to the acquisition
settings that are necessary, and acquire and
transfer some images through the use of the
device's user interface.
7
If you want to acquire images using the
device's user interface, you are done. Simply
proceed to acquire your experimental images
using the user interface.
OR
If you want to acquire images automatically in
non-interactive mode, choose Twain Configure
again from the Utilities menu. The Configure
Twain Driver dialog box will reappear.
8
Clear the Show Device User Interface check
box. Then choose OK.
9
When you are ready to acquire your images
automatically, choose Acquire from the
Experiment Control Panel. Remember to
select the Save Images, Save Ratios, and Log
Data check boxes, as necessary.
MetaFluor
340
Version 7.0
MetaFluor User’s Guide
Twain Configure - Dialog Box Options
Installed Devices
Lists the TWAIN-compliant devices (EXAMPLES: FlashPoint video acquisition board,
Spot cameras, scanners, etc.) that you have installed on your system. Select the device
that you want to use from this list before acquiring images with the TWAIN device.
Show Device User Interface
Selecting this check box will configure your system to display the TWAIN device's
interface when you choose the acquisition command. You should acquire an image in
this fashion at least once to adjust your image acquisition settings before you
subsequently acquire images in non-interactive mode with this check box cleared.
OK
Accepts your selection of a TWAIN-compliant device from the Installed Devices table and
closes the Configure Twain Driver dialog box.
Cancel
Cancels any changes you have made to the settings in the Configure Twain Driver dialog
box and closes the dialog box.
MetaFluor
341
Version 7.0
MetaFluor User’s Guide
Calibration Menu
MetaFluor
342
Version 7.0
MetaFluor User’s Guide
Acquire Calibration Standards (Calibration Menu)
Acquires or loads calibration standards.
Use the Acquire Calibration Standards command when you want to acquire or load calibration
standards. A calibration standard is an image or set of images that represent a known value,
such as a pH or ion concentration.
This command maintains a table for you to keep track of your calibration standards.
See Also:
Equation Calibration in situ
Titration Calibration in situ
Quench Calibration
MetaFluor
343
Version 7.0
MetaFluor User’s Guide
Acquiring Calibration Standards
To acquire the calibration standards, use the following procedure:
Step
Action
1
From the Calibration menu, choose Acquire
Calibration Standards. The Acquire Calibration
Standards dialog box will appear.
2
From the What Is Being Calibrated? dropdown list, select the image you want to
calibrate. If you are using the Equation or
Titration Calibration methods, you can select
either a wavelength image or a ratio image. If
you are using the Quench Calibration, you will
only be able to select a wavelength image.
3
If needed, you can change the name of the
calibrated image series by typing a new name
in the Name text box.
4
From the Calibration Mode group, select the
desired calibration mode: Equation, Titration,
or Quench.
5
If you have previously saved a set of
calibration standards and wish to use it now,
choose Load Standards and select the icon for
the desired .cal file from the Load Calibration
Standards dialog box that appears. Then
choose Open to return to the Acquire
Calibration Standards dialog box. Now skip to
Step 13.
OR
If you still need to configure a calibration,
continue with Step 6.
6
The scroll bar, buttons, Value options, and
Comments text boxes form a table that keeps
track of the calibration reference images
stored in memory. This table can contain up to
16 entries.
Choose the button numbered with the
calibration reference image you intend to
acquire or load. The button will change from a
number to ">>" and a corresponding "<<" will
appear at the right side of the table to indicate
that this row in the table is the active row.
7
Choose Acquire to acquire an image or image
pair for the active table row if you want to
acquire the reference image or pair from
video. If you are about to overwrite an existing
calibration table entry, a warning message will
appear, asking you to verify the overwrite.
OR
Choose Load if you want to load a reference
image from the hard drive. Select the desired
MetaFluor
344
Version 7.0
MetaFluor User’s Guide
image you want to load.
Note: If Ask Whether Backgrounds Should Be
Subtracted is selected in the Calibration
Preferences dialog box, you will be asked to
indicate whether the background reference
image should be subtracted from the data
image (or image pair) that you are loading,
and you will be allowed to load in a new
background.
OR
Choose Current to use the current image (the
image that was last acquired or loaded before
you opened the Acquire Calibration Standards
dialog box) for a calibration reference.
Note: If you need to delete the selected table
row, choose Delete.
8
After you have loaded or acquired the image,
type the appropriate value for the image in the
corresponding Value text box.
If you are using Titration Calibration, you need
to use the concentration that this image
represents, such as pH value or ion
concentration, in the Value text box. If you are
using the Equation Calibration, you need to
indicate, using the Lo or Hi radio button,
whether this image corresponds to a low
(minimum) concentration or a high (maximum)
target ion concentration. The Quench
Calibration does not require a value.
9
You can type a description of the image in the
Comments text box if needed.
10
If you want to display the calibrated images
associated with the selected table row, select
the View Calibration Images check box.
11
Repeat Steps 6 - 11 for each calibration
reference image you want to load. The Status
line will indicate how many images are loaded
and how many table rows are in use. You can
use up to 16 rows (16 calibration data points)
in the table.
12
If you want to save the calibration, choose
Save Standards and type a name for the
calibration (.cal) file in the File Name text box
of the Save Calibration Standards dialog box
that appears. Then choose Save to return to
the Acquire Calibration Standards dialog box.
13
Choose OK.
MetaFluor
345
Version 7.0
MetaFluor User’s Guide
Acquire Calibration Standards - Dialog Box
Options
Load Standards
Loads a set of calibration standards that was saved to disk using Save Calibration
Standards. This command opens the Load Calibration Standards dialog box.
Save Standards
Allows you to save the current set of calibration standards to disk. This command opens
the Save Calibration Standards dialog box.
What Is Being Calibrated?
Specifies the image that you want to calibrate. You can select either a wavelength image
or a ratio image.
Name
Provides an alternative name for the calibrated image series.
View Calibration Images
Displays the calibration image(s) associated with the selected table row. When this box
is checked, the images will appear in image windows on your computer monitor.
Calibration Mode
Specifies the calibration mode that you want to use. You can select Equation, Titration, or
Quench.
Correct All Images
Opens the Correct All Images dialog box, which corrects the calibration images for
background and shading.
Slider
Displays additional rows of buttons, Values, and Comments in the table of calibration
standards.
Buttons (1 through 16)
Indicates the row number in the table of calibration standards. The table can consist of up
to 16 entries. The number on the button will change to >> if it is the active row in the
table.
Value
If you are applying the Titration Calibration, the Value is the concentration that the current
image represents, such as a pH value or ion concentration. If you are applying the
Equation Calibration, select Lo to indicate that the image corresponds to a low (minimum)
concentration or select Hi to indicate that it corresponds to a high (maximum)
concentration. The Quench Calibration does not require a value.
Comments
Allows you to provides a description of the image.
MetaFluor
346
Version 7.0
MetaFluor User’s Guide
>> and <<
Indicates the active row in the table.
Acquire
Acquires an image or image pair for the active table row from video. All images acquired
using Acquire will use the existing acquisition settings (such as illumination settings,
background subtraction, and shading correction).
Load
Loads a reference image from your hard disk for the active table row.
Current
Uses the current image (the image that was last acquired or loaded before you opened
the Acquire Calibration Standards dialog box) for the active table row.
Delete
Deletes the selected table row.
OK
Closes the dialog box.
MetaFluor
347
Version 7.0
MetaFluor User’s Guide
Equation Calibration in situ (Calibration Menu)
Configures the Kd and Viscosity constants for Equation Calibration in situ.
Displays the calibration curve.
Use the Equation Calibration in situ command to set the Kd and Viscosity constants when you
want to calibrate by equation. The Equation Calibration in situ command requires input of
these constants, which it uses to calculate the calibration equation. After you have entered the
constants you want to use, you can display the calibration curve.
The calibration equation is as follows:
⎛ S f 2 ⎞⎛ R − Visc ⋅ RMin ⎞
⎟⎟⎜⎜
⎟⎟
Concentration = K d ⎜⎜
⎝ S b 2 ⎠⎝ Visc ⋅ RMax − R ⎠
Where:
Kd is the dissociation constant for the fura-2/calcium complex,
Viscosity is a correction factor that when used, is typically between 0.7 and 0.85. When not
used, choose a value of 1,
Conc is the resulting concentration of the ion being measured (for example, Calcium) as a
result of applying the calibration equation,
Sf2 is the fluorescence intensity at the denominator wavelength in an ion-free environment.
For fura-2, this will be the intensity of the 380nm image in a calicum-free calibration image,
Sb2 is the fluorescence intensity at the denominator wavelength in an ion-bound
environment. For fura-2, this will be the intensity of the 380nm image in a calicum-saturated
calibration image,
R is the experimentally measured ratio of intensities during 340-nm and 380-nm excitation,
Visc is the intracellular viscosity correction factor,
RMin is the ratio (340/380) of the intensities of the zero-calcium calibration reference
images, and
RMax is the ratio (340/380) of the intensities of the maximal calcium reference images.
Note: You must select Equation as the calibration mode from the Calibration Mode group in
the Acquire Calibration Standards dialog box prior to using this command.
See Also:
Equation Calibration in vitro
MetaFluor
348
Version 7.0
MetaFluor User’s Guide
Configuring Equation Calibration in situ
To configure the Equation Calibration in situ, use the following procedure.
Note: You must select Equation as the calibration mode from the Calibration Mode group
in the Acquire Calibration Standards dialog box prior to using this command.
Step
Action
1
From the Calibration menu, choose Equation
Calibration in situ. The Equation Calibration in
situ dialog box will appear.
2
In the Kd Value text box, type the appropriate
dissociation constant for your experiment . For
a fura-2 experiment performed at 37 degrees
in 1 mM Mg++, Kd has been calculated to be
approximately 224 nM.
3
If necessary, you can type a viscosity
correction value in the Viscosity text box.
Viscosity correction is a fractional value up to
and including 1.0 (the default value).
Note: This option will not appear unless you
selected Ratio from the Calibrate group in the
Acquire Calibration Standards dialog box.
4
After you have entered the parameters, you
can choose Show Calibration Curve to view
the calibration curve and verify that is
appropriate. The dialog box will expand to
show the graph of the calibration curve and an
additional option, Select the Region to Plot. If
everything has been configured correctly, the
Status line will read "Equation Calibration Is
Configured OK."
5
The curve will be shown for the first region of
interest. If you want to see the curve for a
different region of interest, use the Select the
Region to Plot spin box to select the number
for a different region.
6
The Y-axis of the calibration curve will range
from the minimum ratio to the maximum ratio,
as determined by the Min. Ratio and Max.
Ratio values in the Image Display Controls
dialog box.
The minimum ratio in this dialog box may be
below the actual RMin value, or the maximum
ratio may be above the actual RMax value. If
so, values outside of RMin and RMax will
generate an error message that is shown in
the Status window, and those values will not
be plotted on the graph. You should close the
Equation Calibration in situ dialog box and
open the Image Display Controls dialog box to
adjust the minimum and maximum ratio, and
then plot the calibration again.
MetaFluor
349
Version 7.0
MetaFluor User’s Guide
7
Choose Close when you have finished.
MetaFluor
350
Version 7.0
MetaFluor User’s Guide
Equation Calibration in situ - Dialog Box Options
Kd Value
Enter the appropriate ion-indicator dissociation constant (Kd) value for your experiment.
For a fura-2/calcium experiment performed at 37 degrees C in 1 mM Mg++, Kd has been
calculated to be 224 nm (Grynkiewicz, et al., J. Biol. Chem. 260: 3440, 1985).
Viscosity
Viscosity correction is a fractional value up to and including 1.0. More information about
viscosity correction is available in the article by M. Poenie (Cell Calcium 11: 85, 1990).
Calibration Equation
Displays the calibration equation that is being used.
Status
Displays the status of the calibration equation and indicates whether there are additional
steps that you need to perform before the Equation Calibration in situ can be completed.
Show Calibration Curve
Displays the calibration curve. When the calibration curve is being displayed, the Y-axis
will range from the minimum ratio to the maximum ratio, as determined by the Image
Display Controls dialog box.
Definition of Terms
Indicates the names and definitions of the terms used in the Calibration Equation.
Double click the name of the term to display a detailed definition.
Close
Closes the dialog box.
MetaFluor
351
Version 7.0
MetaFluor User’s Guide
Equation Calibration in vitro (Calibration Menu)
Configures the Equation Calibration in vitro. Displays the calibration curve.
Use the Equation Calibration in vitro command when you are measuring a homogenous
sample and you do not need separate equations for each region of interest. When using this
command, you will only need to enter the known equation constants (typically calculated from
a previous session or experiment), and MetaFluor will create a single calibration equation,
which it uses for any region being measured.
The Equation Calibration in vitro command is useful if you are measuring solutions for in vitro
calibration, instead of living specimens. This method will save time and memory because the
calibration reference images do not need to be acquired or maintained in memory.
This method of calibration is also recommended when you are not using a perfusion system
and must add drugs by pipette. Because the other Equation Calibration method performs a
pixel-by-pixel calculation, errors may crop up due to the high likelihood of cell movement
during infusions with a pipette. The Equation Calibration in vitro minimizes this source of error.
See Also:
Equation Calibration in situ
MetaFluor
352
Version 7.0
MetaFluor User’s Guide
Configuring Equation Calibration in vitro
To configure the Equation Calibration in vitro, use the following procedure:
Step
Action
1
From the Calibration menu, choose Equation
Calibration in vitro. The Equation Calibration in
vitro dialog box will appear.
2
Type the Kd and viscosity values appropriate
for your experiment in the Kd Value and
Viscosity text boxes.
3
Type the Equation Calibration values for Sf2,
Sb2, RMin, and RMax in the appropriate
Equation Calibration Variable text boxes.
These can be values that you have obtained
during previous experiments.
OR
Choose Set from Image. A message window
will appear, informing you that Sf2, Sb2, RMin,
and RMax will be set from the low and high
concentration reference images loaded in the
Acquire Calibration Standards procedure.
Choose OK.
4
After you have selected the equation
constants and variables, you can choose
Show Calibration Curve to view the calibration
curve graph. The button text will change to
"Hide Calibration Curve," and the dialog box
will expand to display the graph of the
calibration curve. If everything has been
configured correctly, the Status line will read
"Equation Calibration Is Configured OK."
Note: The Min. Ratio and Max. Ratio options
in the Image Display Controls dialog box must
be set above and below the RMin and RMax
values, respectively; otherwise you will not be
able to view the entire calibration curve.
5
Choose Close when you have finished.
MetaFluor
353
Version 7.0
MetaFluor User’s Guide
Equation Calibration in vitro - Dialog Box Options
Kd Value
Type the appropriate Kd value for your experiment.
Viscosity
Viscosity correction is a fractional value up to and including 1.0. More information about
viscosity correction is available in the article by M. Poenie (Cell Calcium 11: 85, 1990).
Calibration Equation
Displays the calibration equation used by this command.
Equation Calibration Variables
Type the variables for Sf2, Sb2, RMin, and RMax in the appropriate text boxes. These
values can be obtained from previous experiments.
Set from Image
Use this option to calculate the equation variables from Low and High concentration
images that were already measured with the Acquire Calibration Standards command
rather than typing the values in the Equation Calibration Variables text boxes.
Show Message
The Show Message check box only applies to the Set from Image button. If you choose
the Set from Image button and you have selected the Show Message check box, a dialog
box will appear which tells you what MetaFluor is about to do. If you don't have the Show
Message check box selected, MetaFluor will complete the measurement without alerting
you that it is doing so. The Set from Image button is enabled only if you have images in
the Acquire Calibration Images table. You need to have the table set to Equation
Calibration and have at least one Lo and one Hi image pair acquired. When you choose
Set from Table, MetaFluor will calculate the Sf2, Sb2, RMin, and RMax variables for you
by measuring the images in the Acquire Calibration Images table.
Status
Displays the status of the calibration and indicates any additional steps that you need to
do before the calibration is completed.
Show Calibration Curve
Displays the calibration curve. You will not be able to view the entire calibration curve
unless the Min. Ratio and Max. Ratio options in the Image Display Control dialog box are
above and below the RMin and RMax values, respectively.
Hide Calibration Curve
Hides the calibration curve.
Definition of Terms
Indicates the names and definitions of the terms used in the Calibration Equation.
Double click the name of the term to display a detailed definition.
Close
MetaFluor
354
Version 7.0
MetaFluor User’s Guide
Closes the dialog box.
MetaFluor
355
Version 7.0
MetaFluor User’s Guide
Titration Calibration in situ (Calibration Menu)
Configures the Titration Calibration in situ. Displays the calibration curve.
Use the Titration Calibration in situ command to select the calibration method and curve-fitting
parameters when you want to calibrate by titration. The Titration Calibration in situ command
consists of a curve-fit between known concentrations and their corresponding ratios or
intensities. You first must collect data for this curve-fit by using the Acquire Calibration
Standards command.
Note: You must select Titration as the calibration mode from the Calibration Mode group in
the Acquire Calibration Standards dialog box prior to using this command.
MetaFluor
356
Version 7.0
MetaFluor User’s Guide
Configuring Titration Calibration in situ
To configure the Titration Calibration in situ, use the following procedure.
Note: You must select Titration as the calibration mode from the Calibration Mode group
in the Acquire Calibration Standards dialog box prior to using this command.
Step
Action
1
From the Calibration menu, choose Titration
Calibration in situ. The Titration Calibration in
situ dialog box will appear.
2
Select the desired curve-fit from the Curve Fit
drop-down list. If your standards range over
just a few levels (e.g., pH 6.0 - 8.0, or 30 - 300
nM), Linear Interpolation may be more than
adequate.
3
If you want your calibration curve to extend
beyond the first and last data points, select
Yes from the Extrapolate group. Otherwise,
select No.
4
If necessary, you can enforce a minimum
and/or maximum limit to the curve by selecting
the Enforce Maximum Limit and/or Enforce
Minimum Limit check boxes. You should then
type a value in the Value text box. This is
particularly recommended if you enabled
extrapolation in the preceding step.
5
Choose Show Calibration Curve to view the
calibration curve. The button text will change
to "Hide Calibration Curve," and the dialog box
will expand to display the graph of the
calibration curve and an additional option,
Select Region to Plot.
Ratio values will fall on the Y-axis, ranging
from the minimum ratio to the maximum ratio
as defined by the Min. Ratio and Max. Ratio
values in the Image Display Controls dialog
box. Calibrated values will fall on the X-axis.
All of the known points will be drawn as circles
on the graph. The calibration curve will appear
as a red trace line.
6
If you want to view the curve for a different
region of interest, use the Select the Region to
Plot spin box to select the number of the
desired region of interest.
7
Choose Close when you have finished.
MetaFluor
357
Version 7.0
MetaFluor User’s Guide
Titration Calibration in situ - Dialog Box Options
Curve Fit
Specifies the curve-fit to be used for the Titration Calibration in situ:
Linear Interpolation draws a curve that connects each point to the previous and next point.
Polynomial Interpolation computes a polynomial that best fits the data.
Line of Best Fit finds a straight line that falls closest to all of the data points.
Line of Best Log finds a log line that falls closest to all of the data points.
3rd Degree Polynomial computes a third-degree polynomial that best fits the data.
4th Degree Polynomial computes a fourth-degree polynomial that best fits the data.
Extrapolate
Select Yes to extrapolate beyond the first and last data point. The curve will be extended
out to the left of the first data point and to the right of the last data point. The curve is
extended simply by propagating the slope of the line between the last and penultimate
points.
If No is selected from the Extrapolate group, the curve will only cover the range between
the first and last data points, and subsequently measured points that fall outside of this
range will not be calibrated.
Enforce Maximum Limit and Enforce Minimum Limit
Use these two options to set limits for the curve. When these options are selected, the
curve will not go beyond the values selected in the Value text boxes.
EXAMPLE:
To calibrate pH, you can select a Minimum Limit of 5 and a Maximum Limit of 9. This
would ensure that the calibrated data points remain within the pH range of 5.0 - 9.0.
Status
Displays the status of the titration equation and indicates whether there are additional
steps that you need to perform before the Titration Calibration in situ can be completed.
Show Calibration Curve
Displays the calibration curve. Ratio values will fall on the Y-Axis, ranging from the
minimum ratio to the maximum ratio as defined in the Image Display Controls dialog box.
Calibrated values will fall on the X-axis. All of the known points will be drawn as circles on
the graph. The calibration curve will appear as a red trace line. You can choose which
region of interest's calibration is displayed by changing the region selector at the top of
the graph.
Close
Closes the dialog box.
MetaFluor
358
Version 7.0
MetaFluor User’s Guide
Titration Calibration in vitro (Calibration Menu)
Configures the Titration Calibration in vitro. Displays the calibration curve.
This command allows you to enter the measured values and calibrated (actual) values for a
titration calibration manually when you have obtained these values from another source. If you
have already set up calibration reference images using the Acquire Calibration Standards
dialog box, MetaFluor can measure these images and determine the measured values from
them. You can then enter the calibrated values that correspond to these measured values in
the Titration Calibration in vitro table. Once you have configured the Titration Calibration in
vitro you can display the calibration curve.
This method of calibration is also recommended when you are not using a perfusion system
and must add drugs by pipette. Because the other Titration Calibration method performs a
pixel-by-pixel calculation, errors may crop up due to the high likelihood of cell movement
during infusions with a pipette. The Titration Calibration in vitro minimizes this source of error.
See Also:
Titration Calibration in situ
MetaFluor
359
Version 7.0
MetaFluor User’s Guide
Configuring Titration Calibration in vitro
Manually Configuring Titration Calibration in vitro
Configuring Titration Calibration in vitro Using Reference Images
MetaFluor
360
Version 7.0
MetaFluor User’s Guide
Manually Configuring Titration Calibration in vitro
To configure the Titration Calibration in vitro manually, use the following procedure:
Step
Action
1
From the Calibration menu, choose Titration
Calibration in vitro. The Titration Calibration in
vitro dialog box will appear.
2
Select Manually Configure from the Data
Source group to enter values manually in the
table that you have collected from another
source.
3
In the Values are box, choose the ratio or
wavelength to which you want to apply this
calibration.
4
Select the number of entries for the table using
Entries.
Note: You must have at least two entries.
5
Using the data that you have collected from
other sources, enter the measured value and
the calibrated value for each entry in the
Intensity (or Ratio) and Cal. Value text boxes.
6
Specify the type of values for the table using
the Entered Value Is group. You can select an
intensity wavelength or a ratio.
7
Choose Curve Fit. The Titration Calibration in
vitro Graph dialog box will appear.
8
You may need to reconfigure the graph. To do
so, select the desired curve-fitting method
from the Curve Fit drop-down list.
If you want to extrapolate the points beyond
the first and last values, select Yes in the
Extrapolate group.
If you know that the calibrated values should
not extend beyond a minimum and/or
maximum point, you can use Enforce
Minimum Limit and Enforce Maximum Limit to
set them.
9
If you are satisfied with the calibration, choose
OK to set it and close both dialog boxes.
OR
Choose Cancel to return to the Titration
Calibration in vitro dialog box. Repeat Steps 2
- 8.
MetaFluor
361
Version 7.0
MetaFluor User’s Guide
Configuring Titration Calibration in vitro Using
Reference Images
To configure the Titration Calibration in vitro using reference images, use the following
procedure.
Note: You must define regions using the Define Regions for Measurement command
(Graphs menu) and acquire or load the reference images using the Acquire Calibration
Standards command prior to using this command.
Step
Action
1
From the Calibration menu, choose Titration
Calibration in vitro. The Titration Calibration in
vitro dialog box will appear.
2
Select Use Data in Acquire Calibration
Standards from the Data Source group.
The calibrated values from the Value text
boxes in the Acquire Calibration Images dialog
box will appear in the table.
3
If you know the measured value, type it in the
Intensity (or Ratio) text box.
OR
If you do not know the measured value,
choose the button in the Measure column of
the table (1, 2, 3, and so on) to measure the
region of interest. MetaFluor will determine the
value from the region and display it for you.
4
Repeat Step 3 for each row in the table.
5
Choose Curve Fit. The Titration Calibration in
vitro Graph dialog box will appear.
6
You may need to configure the graph. To do
so, select the desired curve-fitting method
from the Curve Fit drop-down list.
If you want to extrapolate the points beyond
the first and last values, select Yes in the
Extrapolate group.
If you know that the calibrated values should
not extend beyond a minimum and/or
maximum point, you can select Enforce
Minimum Limit and Enforce Maximum Limit to
set fixed end-points.
7
If you are satisfied with the calibration, choose
OK to set it and close both dialog boxes.
OR
Choose Cancel to return to the Titration
Calibration in vitro dialog box. Repeat Steps 2
through 6.
MetaFluor
362
Version 7.0
MetaFluor User’s Guide
Titration Calibration in Vitro - Dialog Box Options
Data Source
Select Use Data in Acquire Calibration Standards if you want to measure calibration
reference images that have already been acquired or loaded using the Acquire
Calibration Standards command. This automatically loads the entries for the Cal. Value
column of the table.
Select Manually Configure if you want to enter values manually in the table that you have
collected from another source.
Values Are
This option appears only if you have selected Manually Configure as the Data Source. It
enables you to associate the calibrations for in vitro titration with a specific ratio or
wavelength. Select the ratio or wavelength you want from the Values are drop-down list.
Entries
This option appears only if you have selected Manually Configure as the Data Source.
This allows you to set the number of entries in the table. You must have at least two
entries. The number of entries depends on the number of calibration standards you have
set up.
Status
Displays the status of the calibration and indicates any additional steps that you need to
take before the calibration is completed.
Measure
This option is available only if you have selected Use Data in Acquire Calibration
Standards as the Data Source. Use the button in this column to measure the region in the
calibration reference image associated with that particular row of the table and determine
the Intensity/Ratio value for you.
Intensity/Ratio
Enter the measured (intensity or ratio, as applicable) value in this text box. If you have
selected Use Data in Acquire Calibration Standards, you can choose Measure if you want
MetaFluor to measure the region of interest in the associated calibration reference image
and then determine this value for you.
Cal. Value
This is the calibrated (actual) value. If you are configuring the Titration Calibration in vitro
manually, you will need to obtain this from some other source. If you have selected Use
Data in Acquire Calibration Standards, these values will be obtained from the Acquire
Calibration Standards by MetaFluor.
Entered Value Is
This option will be available only if you have selected Manually Configure as the Data
Source. Specify either an intensity wavelength or a ratio.
Curve Fit
Displays the calibration curve. You can select the desired curve-fitting method from the
Curve Fit drop-down list.
MetaFluor
363
Version 7.0
MetaFluor User’s Guide
If you want to extrapolate the points beyond the first and last values, select Yes in the
Extrapolate group. The curve will be extended out to the left of the first data point and to
the right of the last data point. The curve is extended simply by propagating the slope of
the line between the last and penultimate points.
If you select No from the Extrapolate group, the curve will only cover the range between
the first and last data points, and subsequently measured points that fall outside of this
range will not be calibrated.
If you know that the calibrated values should not extend beyond a minimum and/or
maximum point, you can use Enforce Minimum Limit and Enforce Maximum Limit to set
them.
Choosing OK will complete the Titration Calibration in vitro and close the Titration
Calibration in vitro dialog box. Cancel allows you to return to the Titration Calibration in
vitro dialog box.
Close
This closes the dialog box without completing the Titration Calibration in vitro. You must
display the Curve Fit to complete the Titration Calibration in vitro.
MetaFluor
364
Version 7.0
MetaFluor User’s Guide
Quench Calibration (Calibration Menu)
Configures the Quench Calibration. Displays the calibration curve.
This method of calibration is used exclusively for single-wavelength dyes, such as Calcium
Green and fluo-3. Use the Quench Calibration command to select the appropriate constants
when you want to calibrate by quench equation. This command requires Multiplier and Divisor
constants in addition to the standard Kd constant (for derivation, see Kao, et al., J. Biol.
Chem., 264: 8179, 1989). These are used when calibrating the calibration equation.
Quench calibration is based on the principle that, when a saturating concentration of a heavy
metal (e.g., 2 mM Mn++) is added to the preparation and the cells are made permeable, dye
fluorescence will be quenched to an intensity that is roughly 20% of maximum. Metal-free dye
in lysed cells is known to have a fluorescence that is 1/40th of maximum. From these
assumptions, the FMax can be derived from the following formula
(F
FMax =
− Fbkg
Mn
)+ F
bkg
0.2
Subsequently, FMin can be calculated from the formula
FMin =
(F
Max
− Fbkg
40
)+ F
bkg
Finally, the ion concentration is automatically calculated by MetaFluor as
Conc =
K d (F − FMin )
(F
Max
− F)
Note: This command can only be used for single-wavelength dye calibrations. It does not
apply to ratiometric calibrations.
Note: You must select Quench as the calibration mode from the Calibration group in the
Acquire Calibration Standards dialog box prior to using this command.
MetaFluor
365
Version 7.0
MetaFluor User’s Guide
Configuring the Quench Calibration
To configure the Quench Calibration, use the following procedure.
Note: You must select Quench as the calibration mode from the Calibration Mode group
in the Acquire Calibration Standards dialog box prior to using this command.
Step
Action
1
From the Calibration menu, choose Quench
Calibration. The Quench Calibration dialog box
will appear.
2
Type the appropriate ion-indicator dissociation
constant (Kd) for your experiment in the Kd
Value text box.
3
The Quench Calibration uses the equations
listed in the right half of the dialog box to
approximate low and high concentration
images. After these are obtained, it will apply
the Equation Calibration algorithm.
The Quench Calibration equations require that
the Multiplier M and Divisor D variables be
specified. Suggested values are 5 and 40,
respectively.
4
Choose Show Calibration Curve to view the
calibration curve. The button text will change
to "Hide Calibration Curve," and the dialog box
will expand to display the graph of the
calibration curve and an additional option,
Select the Region to Plot.
If everything has been configured correctly,
the Status line will read "Quench Calibration Is
Configured OK."
5
If you want to view the curve for a different
region of interest, use the Select the Region to
Plot spin box to select the number for the
region you want to specify instead.
6
Choose Close when you have finished.
MetaFluor
366
Version 7.0
MetaFluor User’s Guide
Quench Calibration - Dialog Box Options
Kd Value
Type the appropriate Kd value for your experiment.
Multiplier M
Specifies the multiplier variable, M, used by the calibration equation. This value must be
specified. The value 5 is recommended.
Divisor D
Specifies the denominator variable, D, used by the calibration equation. This value must
be specified. The value 40 is recommended.
Status
Displays the status of the titration equation and indicates whether there are additional
steps that you need to perform before the Quench Calibration can be completed.
Calibration Equation
Displays the calibration equation used by the Quench Calibration command.
Show Calibration Curve
Displays the calibration curve.
Close
Closes the dialog box.
MetaFluor
367
Version 7.0
MetaFluor User’s Guide
Calibration Map (Calibration Menu)
Applies a calibration to an experimental image, generating a custom look-up table
that assigns a specific color to a particular ion concentration or pH value. The
"calibration map" that is displayed will correspond to the currently active
experimental image.
Use this command to generate a calibration map which displays the image in calibrated
values, where the difference in color between pixels directly relates to the difference in
concentration. This command allows you to visualize the relationships of ion concentration in
the specimen.
If you want to apply a calibration to an entire series of experimental images, you should first
apply this command, and then perform the procedure for the Save Calibration Maps
command.
QUICK TIP: To hide the Image Window Toolbar, right-click on the image and choose Hide
Image Window Toolbar from the pop-up shortcut menu that appears.
See Also:
Save Calibration Maps
MetaFluor
368
Version 7.0
MetaFluor User’s Guide
Generating a Calibration Map
To generate a calibration map, use the following procedure:
Step
Action
1
Select the image you want to convert into a
calibration map so that it is the active image.
2
From the Calibration menu, choose Calibration
Map. The Calibration Map dialog box will
appear.
3
Type the expected minimum and maximum
calibrated values (ion concentration or pH) in
the Minimum Calibrated Value and Maximum
Calibrated Value text boxes.
4
Select the desired look-up table from the Lookup Table drop-down list. Rainbow is the
recommended option.
5
You can draw a scale bar on the calibration
map as a key. To do so, select Draw Scale
Bar. Then choose Configure Scale Bar. The
Draw Scale Bar dialog box will appear.
Type the desired title in the Title text box. This
should be a short name, such as the default
"Conc." Select the desired drawing colors
using Background Color and Foreground
Color.
The Calibration Scale Bar is configured
through your choice of labels, rather than
automatically. Type the first label in the Label
text box and choose Add so that it appears in
the list box. Repeat for the remainder of the
desired value labels. You can use Change,
Delete, Sort Up, and Sort Down to change the
list.
Use Location to select the desired location on
the image for the scale bar. Choose Close
when you have finished.
6
Choose Generate Image to create the
calibration map. When MetaFluor has finished
computing the map, the calibration map will
appear on the screen.
7
If you wish, you can save the Calibration Map
by choosing Save Image.
8
Choose Close when you have finished.
MetaFluor
369
Version 7.0
MetaFluor User’s Guide
Calibration Map - Dialog Box Options
Minimum Calibrated Value
Type the minimum calibrated value that you expect to be in the image which you want to
convert to a calibration map.
Maximum Calibrated Value
Type the maximum calibrated value that you expect to be in the image which you want to
convert to a calibration map.
Look-up Table
Specifies the look-up table to use for the calibration map. Rainbow is the recommended
option.
LUT File
This option will be available when Custom is selected from the Look-up Table list. Use
this option to select a custom look-up table from the Select LUT dialog box. Select the
desired file name from the File Name list.
Draw Scale Bar
Draws a scale bar on the calibration map as a key.
Configure Scale Bar
Configures the scale bar. This command opens the Draw Scale Bar dialog box which
allows you to configure the title, scale bar colors, labels, and location of the scale bar.
Generate Image
Displays the calibration map.
Save Image
Saves the calibration map.
Close
Closes the dialog box.
MetaFluor
370
Version 7.0
MetaFluor User’s Guide
Save Calibration Maps (Calibration Menu)
Converts a series of calibration images to calibration maps and saves them.
Use this command when you want to save calibration images as calibration maps using
sequential file names. You can create movies from the calibration maps with the Play Movie
from Disk drop-in command (Utilities menu) or by using MetaMorph.
Prior to applying this command, you must use the Calibration Map command to calibrate the
first experimental image. Following that, applying the Save Calibration Maps command will
generate and save calibration maps for the entire experiment.
See Also:
Calibration Map
MetaFluor
371
Version 7.0
MetaFluor User’s Guide
Saving Calibration Maps
To generate and save multiple calibration maps from an entire experiment, use the
following procedure:
Step
Action
1
From the Calibration menu, choose Save
Calibration Maps. The Save Calibration Maps
dialog box will appear.
2
Type a file name in the Base File Name text
box. For example, if the base file name is
"Calib," images will be saved as Calib0001.tif,
Calib0002.tif, and so on.
3
Use Sequence to select the starting number
for the sequence.
4
Choose Directory to specify the folder for
saving the images. The Browse for Folder
dialog box will appear. Select the desired
folder and then choose OK to return to the
Save Calibration Maps dialog box.
5
Select the Generate and Save Calibration Map
After Each Cycle check box if you want to
generate a calibration map and save it using a
sequential file name after each cycle. The
sequence number will be incremented after
each cycle.
6
Choose OK.
7
After you have set up the Save Calibration
Maps sequence, you can open the Experiment
Control Panel and "play back" the experiment.
The calibration maps will be saved after each
ratio cycle is completed.
MetaFluor
372
Version 7.0
MetaFluor User’s Guide
Save Calibration Maps - Dialog Box Options
Base File Name
The base file name for the calibration maps that will be saved.
Sequence
Specifies the starting number of the sequence.
Directory
Opens the Browse for Folder dialog box, from which you can select the folder in which to
save the images.
Generate and Save Calibration Map After Each Cycle
When this option is selected, MetaFluor will generate a calibration map and save it after
each cycle, using a sequential file name. The sequence number will be incremented after
each cycle.
OK
Closes the dialog box.
MetaFluor
373
Version 7.0
MetaFluor User’s Guide
Save Calibration Table (Calibration Menu)
Saves the current ratio or calibration scale as a .gry file.
Drop-in: SAVECAL
Use this command when you want to save a ratio image or calibration scale to disk. The
calibration table can then be used in MetaMorph and applied to a grayscale TIFF image with
the Calibrate Gray Levels command (Measure menu) for measurement of brightness, optical
density, etc.
Note: If the system has not been calibrated, the ratio scale will be saved. Otherwise the
current calibration scale is saved.
See Also:
Installing Drop-ins Using the Meta Imaging Series Administrator
MetaFluor
374
Version 7.0
MetaFluor User’s Guide
Saving Calibration Tables
To save a calibration table, use the following procedure:
Step
Action
1
From the Calibration menu, choose Save
Calibration Table. The Save Calibration Table
dialog box will appear.
2
From the Ratio Image list, select the ratio
image to use for the calibration table.
3
Choose Select File. The Save Calibration
Table dialog box will appear.
4
Type a new file name in the File Name text
box for the first of the two images, or select an
icon for an existing file.
If the desired folder is not listed at the top of
the dialog box, use the Save In drop-down list
box or Up One Level icon button to change to
the correct location. Then select a file name.
5
Choose Save. The Save Calibration Table
dialog box will close.
6
From the Save Calibration Table dialog box,
choose Save. The ratio scale or calibration
scale will be saved as a calibration table in a
file with a *.gry extension, and the dialog box
will close.
MetaFluor
375
Version 7.0
MetaFluor User’s Guide
Save Calibration Table - Dialog Box Options
Ratio Image
Selects the ratio image (Ratio 1 or Ratio 2) from which to obtain the calibration or ratio
scale (depending on whether or not the image has been calibrated).
Select File
Selects a file name for saving the calibration table. You can save the table under a new
name or you can overwrite an existing file.
Save
Calculates ion concentrations for all possible ratio values in the ratio image and saves a
table of ratios and corresponding ion concentrations. The table will be saved as a *.gry
file, which can then be used in MetaMorph to apply the calibration using the Calibrate
Gray Levels command (Measure menu) for measurement of brightness, optical density,
etc.
Cancel
Cancels the command.
MetaFluor
376
Version 7.0
MetaFluor User’s Guide
Import Image-1/FL CAL File (Calibration Menu)
Imports Image-1/FL equation calibration files.
Use this command when you want to read in an equation calibration file to MetaFluor that was
generated with Image-1/FL.
Note: You will not be able to import Image-1/FL titration calibration files.
See Also:
Equation Calibration
MetaFluor
377
Version 7.0
MetaFluor User’s Guide
Importing an Image-1/FL CAL File
To import an Image-1/FL .cal file, use the following procedure:
Step
Action
1
From the Calibration menu, choose Import
Image-1/FL CAL File. The Select Image-1/FL
CAL File dialog box will appear.
2
Select the icon for the desired file, using the
Look In drop-down list box or Up One Level
icon button to locate the file if necessary. Then
choose Open.
3
After the file has been read, a message box
will appear which confirms that the Image-1/FL
.cal file has been imported and the equation
constants have been calculated.
Choose OK.
4
The Equation Calibration in vitro dialog box will
appear with the equation variables filled in for
the appropriate text boxes.
5
Type the appropriate Kd Value and Viscosity
constants in the Equation Constants text
boxes.
Continue by following the procedure for the
use of the Equation Calibration in vitro
command.
MetaFluor
378
Version 7.0
MetaFluor User’s Guide
Import Image-1/FL CAL File - Dialog Box Options
File Name
Lists the name of the currently selected file.
Files of Type
Determines the file format of the files displayed in the File Name list.
Look In
Displays the currently selected folder. Click the icon for the desired folder to display its
files. Click the Up One Level icon button to go up one level in the directory structure.
Open
Opens the Image-1/FL .cal file.
Cancel
Cancels the command.
MetaFluor
379
Version 7.0
MetaFluor User’s Guide
Journals Menu
MetaFluor
380
Version 7.0
MetaFluor User’s Guide
Create Journal (Journals Menu)
Creates and saves a new journal using the Journal Editor.
Use this command to create new MetaFluor journals. The Journal Editor enables you to select the
functions that you want to included in a journal.
The Journal Editor dialog box contains two tabbed areas. The Functions area on the left side of the
dialog box contains all of the available functions that initiate specific commands. You can display this list
in either alphabetically or according to the functions associated with each menu and command. The
Journal area on the right lists the functions that have been added to the currently selected journal, in the
order that they will occur.
The Edit Journal command enables you to select any journal for editing. However, if you want to edit a
journal that is part of the current taskbar,. simply press and hold the [SHIFT] key while you click the
associated button on the taskbar. This opens the Journal Editor with the selected journal ready for
editing.
After you have created a collection of journals, you can assign them all to the same journal toolbar for
ease of use.
When you create journals, you should remember that shorter journals are easier to manage
and easier to troubleshoot (if necessary).
Notes:
If you load an updated version of MetaFluor to a different directory from the previous
version, you will need to update your old journals with the Edit Journal command so
that the journals will be configured to look in the appropriate directories.
The Command "***End of Journal***" indicates the end of the journal. This is the
last command in every journal and is a required command. You cannot delete this
command.
Shortcut: CTRL + N
See Also:
Create Journal Toolbar
Edit Journal
List of Journal Functions
MetaFluor
381
Version 7.0
MetaFluor User’s Guide
Creating a Journal
To create a journal, use the following procedure:
Step
Action
1
From the Journals menu, choose Create
Journal. The Select a New Journal Name
dialog box will appear.
2
Type a name for the new journal in the File
Name text box. MetaFluor will assign the file
extension ".jnl" to your file name.
AND
Choose Save. The Journal Editor dialog box
will open.
3
From the Builtin Functions tab in the View box,
select the view that you want to use to display
the list of journal functions: Alphabetical or
Task.
4
Highlight the function that you want to add to
the journal Function List.
5
Choose Copy, or drag the function from the
Function List to the list of journal entries on the
right.
You can add entries to your journal by
dragging functions to either the Functions or
Descriptions box on the right or by using
another appropriate editing method, such as
Copy and Paste.
6
When you select a function on either the
functions tab or the descriptions tab, the lower
portion of the tab shows you available
parameters and options that you can set.
Playback Interactively will change an entry's
interactive status. If there is an "I" displayed in
front of the entry, the journal will stop during
playback to display a dialog box, so that you
can modify the function's parameters (if there
are any parameters that can be edited). This
command is the same as the Toggle
Interactive command in the Journal menu.
7
To save a journal after editing, choose
File>Save. This will overwrite the existing
version of the journal.
OR
Choose File>Save As to save the edited
journal under a new name so that the original
file remains intact. Type the file name in the
File Name text box in the Save Journal As
dialog box and choose Save.
8
To print your completed journal, choose
File>Print. The entire journal is sent to the
MetaFluor
382
Version 7.0
MetaFluor User’s Guide
currently selected Windows printer. Icons are
not shown in the printed version, only text.
9
Use the File>Close command to close any
journals you do not want to use. (Remember
to save first!)
10
When you have finished editing and saving
your journals, choose File>Exit to close the
Journal Editor dialog box.
MetaFluor
383
Version 7.0
MetaFluor User’s Guide
Create Journal - Dialog Box Options
File
Provides a menu that contains a set of commands to enable you to originate new journals and to edit, save
and print existing journals.
New
Creates a new journal file.
Open
Opens the selected journal file.
Close
Closes the active journal.
Save
Saves the current journal, overwriting the contents of the journal file if it has been previously saved.
Save As
Saves the current journal using a different file name of your choice.
Revert to Saved
Restores the currently displayed journal to the condition it was in when it was last saved.
Print
Opens the Windows Print dialog box and enables you to print a copy of the journal to the selected
Windows device. Icons are not shown in the printed version, only text.
Exit
Discontinues any running journal and closes the Journal Editor dialog box.
Edit
Provides a menu that contains commands for cutting, copying, pasting, and controlling journal functions.
Cut
Deletes the selected function from the current journal.
Copy
Copies the selected function from the current journal.
Paste
Pastes the most recently cut or copied function to the current journal, placing it above the currently
selected function in the list of functions.
Delete
Permanently removes the selected journal function.
Disable
Temporarily deactivates the selected journal function.
Interactive
Turns on or off (toggles) the interactive journal mode. A check next to this setting indicates that it is
active (on).
Override Settings
MetaFluor
384
Version 7.0
MetaFluor User’s Guide
Enables you to temporarily override the current settings and replace them with new settings.
Built-in Functions
Lists functions that can be added to a journal. Functions can be added by double-clicking a function name in
the table, or by dragging a function from the table to the list of functions in the current journal.
View
Selects a view for the display of the journal functions in the Function Table: Alphabetical or by
Menu.
Recorded Journals
Shows your currently accessed folder and associated path. Use this tab to move your folder selection from
one folder to another. From the appropriate journal folder, double-click the name of the journal that you
want to open for viewing or editing, or to run. You can also double-click or drag journals from these folders
into the currently open journal to run journals from within a journal or to loop a journal.
Actions
Shows a list of programming commands that you can include in your journal. Double-click the name of the
command or drag the command into the appropriate location in your journal
Built-in Functions
Lists functions that can be added to a journal. Functions can be added by double-clicking a function name in
the table, or by dragging a function from the table to the list of functions in the current journal.
Journal
Lists the active journals that are open for editing. The journal name displayed is the current journal. The
status text next this option lists how many journals are open for editing.
Functions
Lists all of the functions in the current journal. Click an entry once to select it for cutting, copying, pasting,
editing, or toggling the interactive mode. Double-click an entry to edit the entry. Select the entry and press
Delete to remove the entry, or right click and select Delete. Only the function names are shown in this
window. Choose the Description tab to see any variables or parameters assigned to the function or action.
This table is located on the right side of the dialog box.
Descriptions
Shows the same information as the Functions tab, but also includes any assigned variables and parameter
settings.
For both the Functions tab and the Descriptions tab, the following selections are available for most
functions. Selected programming actions will show entry boxes for all applicable parameters, variables and
settings for the programming action.
Playback Interactively
Enables interactive journal editing. With interactive journal editing, you can modify function settings
during journal playback. For any functions that have modifiable settings, the journal will pause and
open a dialog box for each function for which you have checked Playback Interactively.
Disable
Deactivates the selected function without removing it from the journal or changing any of the
function settings.
Edit Function Settings
Opens the associated settings dialog box for the selected function.
Select Settings to Override
For specific function settings in specific function dialog boxes, enables you to temporarily select
and override certain settings with new values.
MetaFluor
385
Version 7.0
MetaFluor User’s Guide
Undo
Resets all settings for the function to the previously set values.
MetaFluor
386
Version 7.0
MetaFluor User’s Guide
Edit Journal (Journals Menu)
Edits a journal that was created previously and saved.
Use this command when you want to make changes to a journal. After you select the journal
you want to edit, this command will open the Journal Editor so that it can make the necessary
changes. Use this command to add journal entries or to edit the parameters for a journal
entry. Also use this command to add programming actions that cannot be created in a journal
by recording the journal.
The Journal Editor dialog box contains two tabbed areas. The Functions area on the left side of the
dialog box contains all of the available functions that initiate specific commands. You can display this list
in either alphabetically or according to the functions associated with each menu and command. The
Journal area on the right lists the functions that have been added to the currently selected journal, in the
order that they will occur.
Interactive Mode stops the journal during playback so that you can modify its parameters. This
option can be selected when you add a new function to a journal. You can also change a
particular journal entry's interactive mode status by highlighting the desired entry in the list on
the right and choose Toggle Interactive. This will toggle the entry's status to on ("X") or off (no
"X"), depending on its current state.
Using the Journal Editor dialog box, you can edit several journals at once without returning to
the Journals menu. You can cut, copy, and paste journal entries to and from the various
journals as you are editing them.
If you want to edit a journal that is part of the current journal toolbar, there is a quick way to
select it without using the Edit Journal command. Simply press and hold the [SHIFT] key while
clicking the journal's Toolbar button. This will open the Journal Editor with the selected journal
ready for editing.
Note: If you load an updated version of MetaFluor to a different directory from the previous
version, you will need to update your old journals with the Edit Journal command so that the
journals will be configured to look in the appropriate directories.
See Also:
Create Journal
Create Journal Toolbar
List of Journal Functions
MetaFluor
387
Version 7.0
MetaFluor User’s Guide
Editing a Journal
To edit one or more journals, use the following procedure:
Step
Action
1
From the Journal menu, choose Edit Journal.
The Select a Journal to Edit dialog box
opens.
2
Select the journal that you want to edit. If
necessary, use the Look In list or Up One
Level button to locate the correct drive and
folder. Then choose Open. The Journal
Editor dialog box will appear.
3
If you want to edit more than one previously
saved journal at once, choose File>Open.
The Open a Journal to Edit dialog box will
open. Select the file for the desired journal
and choose Open.
(You can open previously saved journals at
any time while editing a journal.)
4
The last journal open will become the current
journal, as listed in the drop-down list in the
upper right corner of the dialog box.
You can edit another open journal by
selecting it from the drop-down list or, if the
taskbar to which it has been assigned is
currently displayed, you can "shift-click" its
assigned button (hold down the [SHIFT] key
and click the taskbar button using your left
mouse button). The status text at the top of
the dialog box will note how many journals
are currently open.
5
From the View list, select the view you want
to use; either Alphabetical or Menu.
6
You can add entries to your journal by
dragging functions to either the Functions or
Descriptions box on the right or by using
another appropriate editing method, such as
Copy and Paste.
7
Playback Interactively will change an entry's
interactive status. If there is an "I" displayed
in front of the entry, the journal will stop
during playback to display a dialog box, so
that you can modify the function's
parameters (if there are any parameters that
can be edited). This command is the same
as the Toggle Interactive command in the
Journal menu.
8
To save a journal after editing, choose
File>Save. This will overwrite the existing
version of the journal.
OR
Choose File>Save As to save the edited
MetaFluor
388
Version 7.0
MetaFluor User’s Guide
journal under a new name so that the original
file remains intact. Type the file name in the
File Name text box in the Save Journal As
dialog box and choose Save.
9
To print your completed journal, choose
File>Print. The entire journal is sent to the
currently selected Windows printer. Icons
are not shown in the printed version, only
text.
10
You can use the File>Close command to
close any journals you do not want to use.
(Remember to save first!)
11
When you have finished editing and saving
your journals, choose File>Exit to close the
Journal Editor dialog box.
MetaFluor
389
Version 7.0
MetaFluor User’s Guide
Adding a Journal Entry
To add a journal entry to the journal you are editing, use the following procedure:
Step
Action
1
From the View list, select the view you want
to use to display the Function List: either
Alphabetical or Menu.
2
From the Built-in Functions list on the left,
select the function that you want to add to
your journal.
AND
Choose Edit>Copy or drag the function from
the Built-in Functions List to the list of journal
entries on the right.
3
If the command has parameters or settings
that you can edit (such as an
enabled/disabled state), its dialog box will
appear so that you can change its options.
Choose OK when you have finished.
If there are no parameters or options to set, a
dialog box with the message "This journal
entry is not editable" will appear.
4
The function will now appear in the right
column before the previously selected entry.
If you selected Playback Interactively, an "I"
will appear before the function name in both
the Functions tab and the Descriptions tab.
MetaFluor
390
Version 7.0
MetaFluor User’s Guide
Cutting, Copying, and Pasting Journal Entries
If you want to remove the currently highlighted entry from your journal list, choose Edit>Cut, OR rightclick and choose Cut, OR Ctrl+X, OR Press the Delete key.
If you want to copy the currently highlighted entry from your journal list, choose Edit>Copy, OR right-click
and choose Copy, OR Ctrl+C.
If you want to paste the last entry that was cut or copied, highlight the entry and choose Edit>Paste, OR
right-click and choose Paste, OR Ctrl+V. The pasted entry will appear above the currently highlighted
entry.
You can cut and copy multiple entries from the journal. To select a set of adjacent entries, select the first
entry and then hold down the [SHIFT] key while selecting the last entry in the list. All entries in between
the two selected entries will also be selected. To select multiple entries scattered throughout the list,
select the first entry, and then hold down the [CTRL] key while selecting the other desired entries. Only
these entries will be highlighted. You can cut and copy as described above.
MetaFluor
391
Version 7.0
MetaFluor User’s Guide
Editing Entries in a Journal
As you edit a journal, you can decide to change the parameters or settings that you selected for a
particular function. To change the parameters or settings, highlight the desired entry in the list on the
right and click Edit Function Setting. You will then be able to change the function's editable parameters in
its dialog box. Choose OK, Apply, or Record (as applicable) to record the changes in the function's
parameters.
If you want to change a particular journal entry's interactive mode status, highlight the desired entry in
the right-hand list and choose Play Interactively. This will toggle the entry's status to on ("I") or off (no "I")
depending on its current state.
Note: When you change the setting in a command's dialog box while editing a journal, you must choose
its OK, Apply or Record, or other applicable command button for your changes to be recorded.
MetaFluor
392
Version 7.0
MetaFluor User’s Guide
Edit Journal - Dialog Box Options
File
Provides a menu that contains a set of commands to enable you to originate new journals and to edit, save
and print existing journals.
New
Creates a new journal file.
Open
Opens the selected journal file.
Close
Closes the active journal.
Save
Saves the current journal, overwriting the contents of the journal file if it has been previously saved.
Save As
Saves the current journal using a different file name of your choice.
Revert to Saved
Restores the currently displayed journal to the condition it was in when it was last saved.
Print
Opens the Windows Print dialog box and enables you to print a copy of the journal to the selected
Windows device. Icons are not shown in the printed version, only text.
Exit
Discontinues any running journal and closes the Journal Editor dialog box.
Edit
Provides a menu that contains commands for cutting, copying, pasting, and controlling journal functions.
Cut
Deletes the selected function from the current journal.
Copy
Copies the selected function from the current journal.
Paste
Pastes the most recently cut or copied function to the current journal, placing it above the currently
selected function in the list of functions.
Delete
Permanently removes the selected journal function.
Disable
Temporarily deactivates the selected journal function.
Interactive
Turns on or off (toggles) the interactive journal mode. A check next to this setting indicates that it is
active (on).
Override Settings
MetaFluor
393
Version 7.0
MetaFluor User’s Guide
Enables you to temporarily override the current settings and replace them with new settings.
Built-in Functions
Lists functions that can be added to a journal. Functions can be added by double-clicking a function name in
the table, or by dragging a function from the table to the list of functions in the current journal.
View
Selects a view for the display of the journal functions in the Function Table: Alphabetical or by
Menu.
Recorded Journals
Shows your currently accessed folder and associated path. Use this tab to move your folder selection from
one folder to another. From the appropriate journal folder, double-click the name of the journal that you
want to open for viewing or editing, or to run. You can also double-click or drag journals from these folders
into the currently open journal to run journals from within a journal or to loop a journal.
Actions
Shows a list of programming commands that you can include in your journal. Double-click the name of the
command or drag the command into the appropriate location in your journal
Built-in Functions
Lists functions that can be added to a journal. Functions can be added by double-clicking a function name in
the table, or by dragging a function from the table to the list of functions in the current journal.
Journal
Lists the active journals that are open for editing. The journal name displayed is the current journal. The
status text next this option lists how many journals are open for editing.
Functions
Lists all of the functions in the current journal. Click an entry once to select it for cutting, copying, pasting,
editing, or toggling the interactive mode. Double-click an entry to edit the entry. Select the entry and press
Delete to remove the entry, or right click and select Delete. Only the function names are shown in this
window. Choose the Description tab to see any variables or parameters assigned to the function or action.
This table is located on the right side of the dialog box.
Descriptions
Shows the same information as the Functions tab, but also includes any assigned variables and parameter
settings.
For both the Functions tab and the Descriptions tab, the following selections are available for most
functions. Selected programming actions will show entry boxes for all applicable parameters, variables and
settings for the programming action.
Playback Interactively
Enables interactive journal editing. With interactive journal editing, you can modify function settings
during journal playback. For any functions that have modifiable settings, the journal will pause and
open a dialog box for each function for which you have checked Playback Interactively.
Disable
Deactivates the selected function without removing it from the journal or changing any of the
function settings.
Edit Function Settings
Opens the associated settings dialog box for the selected function.
Select Settings to Override
For specific function settings in specific function dialog boxes, enables you to temporarily select
and override certain settings with new values.
MetaFluor
394
Version 7.0
MetaFluor User’s Guide
Undo
Resets all settings for the function to the previously set values.
Save
Saves the current journal, overwriting the contents of the journal file if it has been previously saved.
Run Journal
Runs the current open journal. The journal must be saved before it will run.
Exit
Closes any running journal and closes the Journal Editor dialog box.
MetaFluor
395
Version 7.0
MetaFluor User’s Guide
Run Journal (Journals Menu)
Allows you to select a previously saved journal and run it at that particular
moment.
This command is useful for running journals that you do not use frequently and which are not
used in conjunction with other journals.
For journals that you use frequently, it is best to assign them to a journal toolbar with other
similar journals, and run them directly from the toolbar as needed, rather than using the Run
Journal command. If you need to run a journal after a specific event (for example, after each
acquisition cycle), you should use the Auto-Execute Journals command.
WARNING:
When you use journals during a procedure that involves an illumination device, you should
close the Illumination Control dialog box before starting the journal. Attempts to run a journal
while the Illumination Control dialog box is still open may cause your system to appear to
"freeze." This is due to the "modal" nature of dialog boxes that are opened in journal playback
mode, combined with the Illumination Control dialog box's need to reconfigure itself by closing
itself and reopening when a new illumination device is selected.
See Also:
Create Journal
Create Journal Toolbar
Auto-Execute Journals
Configure Illumination
MetaFluor
396
Version 7.0
MetaFluor User’s Guide
Running a Journal
To run a journal, use the following procedure:
Step
Action
1
From the Journals menu, choose Run Journal.
The Select a Journal to Run dialog box will
appear.
2
Select the desired journal. If necessary, use
the Look In list or Up One Level button to
locate the appropriate drive and folder.
3
Choose Open. The dialog box will close and
the journal will run.
MetaFluor
397
Version 7.0
MetaFluor User’s Guide
Select a Journal to Run - Dialog Box Options
File Name
Lists the name of the currently selected journal file.
Files of Type
Determines the format of the files displayed in the File Name list.
Look In
Displays the currently selected folder. Click the icon for the desired folder to display its
files. Click the Up One Level button to go up one level in the directory structure.
Open
Opens the file.
Cancel
Cancels the command.
MetaFluor
398
Version 7.0
MetaFluor User’s Guide
Auto-Execute Journals (Journals Menu)
Allows you to run previously created and saved journals automatically.
Use this command to run previously created and saved journals automatically when selected
events occur. The Auto-Execute Journals dialog box has a list of events for which you can
specify an autoexecuting journal. You can associate a journal with the start or end of a new
experiment, the opening or closing of a stored experiment, the moment before, during, or after
acquisition of a wavelength image, or upon termination of acquisition. In the Auto-Execute
Journals dialog box, you can select only one journal per event. However, there is a command
available in the Journal Editor for executing a journal while running another one, so it is
possible to run more than one journal per event. You can save sets of associations between
events and journals in an autoexecute journal list file (*.aej) and load saved files from disk. If
an error occurs while the journal is running, a message box will appear, asking if you want to
remove the association between the offending journal and the event.
Note: This command is unavailable in the MetaFluor Offline system.
Note: MetaFluor will autoexecute journals only if the Auto-Execute Journals command in the
Journals menu has been enabled (a check mark will appear next to its name). This is so that
you can disable the Auto-Execute Journal command if you need to start or open an
experiment without the journals running.
See Also:
Use Auto-Execute Journals
MetaFluor
399
Version 7.0
MetaFluor User’s Guide
Autoexecuting Journals
To autoexecute journals, use the following procedure:
Step
Action
1
From the Journals menu, choose AutoExecute Journals. The Auto-Execute Journals
dialog box will appear.
2
If you have previously saved an autoexecute
journals list file and want to use it, choose
Load List. The Select an AutoExecute Journal
List dialog box will appear. Select the desired
file and choose Open. Then skip to Step 7.
OR
If you want to create a new set of event/journal
associations, continue to Step 3.
3
To assign a journal to a specific task/event,
highlight the task in the Tasks Which Can
Execute Journals table and choose Assign
Journal. Alternatively, you can double-click the
task's entry in the table.
4
The Select a Journal dialog box will appear.
Select the file for the desired journal. If
necessary, use the Look In list or Up One
Level button to locate the appropriate drive
and folder. Then choose Open.
A check mark will appear in front of the task
name, and the status line at the bottom of the
dialog box will indicate the name of the journal
file associated with the task. If you need to
remove a journal assignment, highlight the
pertinent task and choose Clear Journal.
5
Repeat Steps 3 and 4 for each journal
association you want to assign.
6
If you want to save the set of event/journal
associations, choose Save List. The Save
AutoExecute Journal List dialog box will
appear.
AND
Type a name for the autoexecute journal list
file in the File Name text box and choose
Save.
7
Choose Close when you have finished.
MetaFluor
400
Version 7.0
MetaFluor User’s Guide
Auto-Execute Journals - Dialog Box Options
Tasks Which Can Execute Journals
Lists the tasks or events which you can assign a journal to autoexecute when that event
occurs. A check mark will appear next to the events that have a journal associated with
them. The status text below this list box displays the name of the journal that will be
autoexecuted when the selected task or event occurs.
Load List
Opens the Select an AutoExecute Journal List dialog box, from which you can load a
previously saved set of task/journal associations.
Save List
Opens the Save AutoExecute Journal List dialog box, with which you can save a set of
task/journal associations in an autoexecute journals list file (*.aej).
Assign Journal
Assigns a journal to the selected task using the Select a Journal dialog box.
Clear Journal
Clears the journal associated with the selected task/event. Displays "<None>" to indicate
that there is no journal associated with the selected task or event.
Clear All Journals
Clears all journals from all tasks.
Close
Closes the dialog box.
MetaFluor
401
Version 7.0
MetaFluor User’s Guide
Use Auto-Execute Journals (Journals Menu)
Enables and disables the Auto-Execute Journals command.
This command acts as a toggle, enabling or disabling the Auto-Execute Journals command.
After you have selected the journals to autoexecute using the Auto-Execute Journals
command, you will need to enable the Use Auto-Execute Journals command by choosing it
from the Journals menu, so that a check mark appears before its name.
If you do not want to run the journals at any point before or during an experiment, choose the
Use Auto-Execute Journals command again from the Journals menu. This will disable the
Auto-Execute Journals command, and the check mark in the Use Auto-Execute Journals
menu will disappear.
Note: This command is unavailable in the MetaFluor Offline system.
See Also:
Auto-Execute Journals
MetaFluor
402
Version 7.0
MetaFluor User’s Guide
Using the Auto-Execute Journals Command
To enable the Use Auto-Execute Journals command, use the following procedure:
Step
Action
1
Select the Journals menu.
2
Choose Use Auto-Execute Journals. This will
toggle the command's state. If it is enabled, a
check mark will appear next to its name on the
menu.
If the command is inactive, choosing Use
Auto-Execute Journals will enable it and a
check mark will appear next to its name.
Choosing the command again will disable it
and remove the check mark.
MetaFluor
403
Version 7.0
MetaFluor User’s Guide
Sequence Journals (Journals Menu)
Sets up a sequence of journals that can be run at a specified time in the
experiment or after a specified number of acquisition cycles have occurred.
Use this command to create a sequence of journals defined by time or cycle number. You can
select a specific time or acquisition cycle number in the experiment, or select a time or
acquisition cycle within a configured sequence. The journals must already exist before you
create the sequence. There is no limit to the number of journals that can be contained in a
sequence.
Note: This command is unavailable in the MetaFluor Offline system.
You can also use this command to save and load a sequence list and to edit an existing
sequence list. If necessary, you can reset the cycle count prior to starting the sequence.
Likewise, you can zero the clock prior to the sequence. The current time, cycle number, and
last journal run will be indicated in a Sequence Status window, which you can choose whether
or not to display.
After you have set up the sequence, you can use the Use Sequence Journals command to
enable or disable sequencing during image acquisition. Or you can use the Run Sequence
command to start acquisition and initiate the sequence.
The journals in the sequence will run when their times or cycle numbers are reached in the
experiment. For instance, you can set up a sequence to run a journal when an experiment is
started, to run another journal one minute later, and run a third journal five minutes after that.
This command does not repeat the journal sequence.
If you need to rezero the sequence clock after starting a journal sequence, you will need to
have added the Zero Sequence Clock journal function to the journal before you start the
sequence. The only other way you will be able to restart the sequence timer is to close the
Sequence Status window and choose Run Sequence again from the Journal menu. If you
merely want to stop the sequence cycle, you can close the Experiment Control Panel, but the
timer will continue to run.
See Also:
Use Sequence Journals
Run Sequence
MetaFluor
404
Version 7.0
MetaFluor User’s Guide
Sequencing Journals
To sequence journals, use the following procedure:
Step
Action
1
From the Journal menu, choose Sequence
Journals. The Sequence Journals dialog box
will appear.
2
To add a journal to the sequence, choose Add.
The Add Sequence Journal dialog box will
appear.
3
Choose Select Journal. The Select a Journal
dialog box will appear.
AND
Select the file for the desired journal. If
necessary, use the Look In list or Up One
Level button to locate the appropriate drive
and folder. Then choose Open to return to the
Add Sequence Journal dialog box.
4
Select:
Execute at Experiment Time if you want the
journal to run at a specific time in the
experiment. Use its spin box and drop-down
list to set the amount of time and units of
measure.
Execute on Experiment Cycle if you want the
journal to run at a specific acquisition cycle,
counted from the beginning of the
experimental acquisition. Use its spin box to
select the acquisition cycle number.
Execute at Sequence Time if you want the
journal to run at a specific time from the start
of the sequence timer. Use its spin box and
drop-down list to set the amount of time and
units of measure.
Execute on Sequence Count if you want the
journal to run at a specific acquisition cycle
after you start the sequence timer. Use its spin
box to select the acquisition cycle number.
5
When you have finished, choose OK. The
Sequence Journals dialog box will reappear.
6
Repeat Steps 2 - 5 for each journal you want
to add.
When you have finished adding journals, verify
that all of the journals that you want to use
have check marks in front of their names in the
Journal Sequence List. If not, double-click the
name to toggle the check mark on.
7
If you want to zero the clock prior to the
sequence when using the Run Sequence
command, select Zero the Experiment Clock.
MetaFluor
405
Version 7.0
MetaFluor User’s Guide
Likewise, select Zero the Experiment Cycle
Counter if you want to reset the cycle prior to
the sequence when using the Run Sequence
command.
8
If you do not want to see the Sequence Status
window when using the Run Sequence
command, clear the Display the Sequence
Status Window check box.
OR
If you want to be able to see the current time,
cycle count, and last journal run while using
the Run Sequence command, leave the
Display the Sequence Status Window check
box selected (the default state).
9
Choose OK when you have finished.
MetaFluor
406
Version 7.0
MetaFluor User’s Guide
Sequence Journals - Dialog Box Options
Journal Sequence List
Lists the journals in sequence and displays when each will be run. Those indicated with a
check mark will be run during the sequence. To enable or disable the check mark,
double-click the journal name.
Add
Adds a journal to the sequence list. This command opens the Add Sequence Journal
dialog box. Use Select Journal to select the journal you want to add. You can specify that
the journal be run after a specific amount of time after image acquisition is started, or you
can specify that the journal be run after a specific number of cycles has occurred.
Remove
Removes the selected journal from the Journal Sequence List.
Edit
Allows you to change the journal that is run, and when it is to be run. This command
opens the Edit Sequence dialog box. Use Select Journal to change the journal. You can
specify that the journal be run after a specific amount of time after image acquisition is
started, and you can specify that the journal be run after a specific number of cycles has
occurred.
Save List
Saves the current sequence list. This command opens the Save Journal Sequence dialog
box. Use its Sequence List File command to specify the file name for saving the list.
Choose OK when you have finished.
Load List
Loads a previously saved sequence list. This command opens the Load Journal
Sequence dialog box. Use its Select a Sequence List to specify the file name of the list
you want to load. Choose OK when you have finished.
Zero the Experiment Clock
Resets the clock counter to zero prior to starting a sequence with the Run Sequence
command.
Zero the Experiment Cycle Counter
Resets the cycle count prior to starting a sequence with the Run Sequence command.
Display the Sequence Status Window
Displays the Sequence Status window when you run the Run Sequence command. This
window indicates the current time, cycle count, and the last journal run.
OK
Configures the sequence of journals.
MetaFluor
407
Version 7.0
MetaFluor User’s Guide
Add Sequence Journals - Dialog Box Options
Select Journal
Displays the Select a Journal dialog box, from which you can select the journal for which
you want to configure the sequence timing.
Execute at Experiment Time
Selects a specific time in the experiment for the selected journal to run.
Execute on Experiment Cycle
Selects a acquisition cycle in the experiment for the selected journal to run.
Execute at Sequence Time
Selects a specific time from the start of the sequence timer for a journal to run.
Execute on Sequence Count
Selects a specific acquisition cycle after you start the sequence timer for a journal to run.
OK
Accepts the timing configuration for the selected journal and returns you to the Sequence
Journals dialog box.
Cancel
Cancels the command and returns you to the Sequence Journals dialog box.
MetaFluor
408
Version 7.0
MetaFluor User’s Guide
Use Sequence Journals (Journals Menu)
Enables or disables the use of the Sequence Journals command.
Use this command to enable or disable the journal sequencing that was set up in the
Sequence Journals dialog box. If you start image acquisition with this command enabled, it will
start the sequence that you have set up in the Sequence Journals dialog box. If this command
is not already enabled when you use the Run Sequence command, it will be enabled at that
time.
You must set up the sequence using the Sequence Journals command prior to using this
command.
Note: This command is unavailable in the MetaFluor Offline system.
See Also:
Sequence Journals
Run Sequence
MetaFluor
409
Version 7.0
MetaFluor User’s Guide
Using Sequence Journals
To enable the Use Sequence Journals command, use the following procedure:
Step
Action
1
Select the Journals menu.
2
Choose Use Sequence Journals. This will
toggle the command's state. If it is enabled, a
check mark will appear before its name on the
menu. If it is enabled, choosing Use Sequence
Journals will disable it and the check mark will
be removed from the menu.
MetaFluor
410
Version 7.0
MetaFluor User’s Guide
Run Sequence (Journals Menu)
Starts image acquisition and runs a sequence of journals at a specified time in the
experiment or after a specified number of cycles have occurred.
Use this command to start image acquisition and run a sequence of journals defined by time
or cycle number. The journals must already exist before you create the sequence. If you
selected Zero the Experiment Cycle Counter in the Sequence Journals dialog box, the cycle
count will be reset prior to starting the sequence. Likewise, if you selected Zero the
Experiment Clock, the clock will be zeroed prior to the sequence. If you selected Display the
Sequence Status Window, the Sequence Status window will be displayed, providing you with
the current time, cycle count, and the last journal run.
You must set up the sequence using the Sequence Journals command prior to using this
command.
This command automatically enables the Use Sequence Journals command if it is not
already enabled.
Note: This command is unavailable in the MetaFluor Offline system.
See Also:
Sequence Journals
Use Sequence Journals
MetaFluor
411
Version 7.0
MetaFluor User’s Guide
Running a Journal Sequence
To run a journal sequence, use the following procedure:
Step
Action
1
Select the Journals menu.
2
Choose Run Sequence. If the Use Sequence
Journals command is not enabled, Run
Sequence will be disabled.
3
If you selected Zero the Experiment Cycle
Counter or Zero the Experiment Clock in the
Sequence Journals dialog box, the counter(s)
will be reset. If you selected Display the
Sequence Status Window in the Sequence
Journals dialog box, the Sequence Status
window will appear, indicating the current time,
cycle count, and the last journal run.
4
The Run Sequence command will then start
image acquisition and run the journal
sequence.
5
If an error occurs while the journal is running,
a message box will appear, asking if you want
to remove the offending journal.
MetaFluor
412
Version 7.0
MetaFluor User’s Guide
Trigger Journals (Journals Menu)
Configures the trigger input devices and trigger conditions for Use Trigger Journal
and Wait for Trigger commands.
Use this command to add or edit a trigger input device driver. This command allows you to
specify the device used and its configuration.
After you have configured the driver, you can create a trigger condition that will instruct
MetaFluor to run a particular journal when the computer receives a signal from the specified
trigger input device that meets the condition. Each condition includes (1) the trigger input
device supplying the signal, (2) the voltage signal pin, and (3) the desired voltage signal state
(high or low) that must be received from the trigger input device to run the specified journal.
You can create a list of conditions and enable them as you need them. MetaFluor will wait for
only those conditions that are selected in the Trigger Journals dialog box.
Note: This command is unavailable in the MetaFluor Offline system.
See Also:
Use Trigger Journal
Wait for Trigger
MetaFluor
413
Version 7.0
MetaFluor User’s Guide
Configuring Trigger Journals
To configure trigger journals, use the following procedure:
Step
Action
1
From the Journals menu, choose Trigger
Journals. The Trigger Journals dialog box will
appear.
2
To add and configure a new trigger input
device, choose Add. The Open DIO Driver
dialog box will appear.
3
Type the name of the device in the Device
Name text box.
4
Use the DIO Hardware drop-down list to
specify the type of digital I/O device hardware
you are using.
5
Choose Change Driver Configuration. The
Digital I/O Configuration dialog box will
appear.
The options displayed in this dialog will
depend on the type of hardware you selected
in Step 4. Select the appropriate settings and
choose OK.
6
Choose OK to complete the configuration of
the trigger input device and return to the
Trigger Journals dialog box.
7
To add a new trigger condition, choose Add.
The Add Trigger Condition dialog box will
appear.
8
Choose Select Journal. The Select a Journal
dialog box will appear.
Select the icon for the desired journal. Use the
Look In list or Up One Level icon button if
necessary to locate the journal file. Then
choose Open.
9
Select the desired trigger input device from
Trigger Input Device drop-down list.
Use Trigger Input Pin # to select the input pin
that will be receiving the signal.
Then use Trigger When Pin Goes to select the
signal (High or Low) that will trigger the
playback of the associated journal.
Choose OK.
10
Repeat Steps 7 - 9 for all of the trigger
conditions you want to set up.
Then double-click each one you want to use,
to enable it (a check mark will appear in front
of all of the conditions that are enabled).
11
Choose OK when you have finished.
MetaFluor
414
Version 7.0
MetaFluor User’s Guide
MetaFluor
415
Version 7.0
MetaFluor User’s Guide
Trigger Journals - Dialog Box Options
Trigger Input Devices
Lists the trigger input devices that have been configured.
Add (Trigger Input Devices)
Adds and configures a new trigger input device. Use Device Name to specify a unique
name for the device. Use DIO Hardware to specify the hardware you are using for the
trigger device. Change Driver Configuration allows you to set the base address and data
flow direction for the device (or to specify the parallel port and IRQ setting if you are using
a parallel port).
Remove (Trigger Input Devices)
Removes the selected trigger input device from the Trigger Input Devices list.
Edit (Trigger Input Devices)
Allows you to edit a previously configured trigger input device. The options available are
the same as those for the Add command. You can also edit a trigger input device by
double-clicking its name in the Trigger Input Devices list.
Trigger Conditions
Lists the trigger conditions that have been defined. Only those that are enabled will be
used by the trigger commands. To enable a trigger condition, double-click its name so
that a check mark appears in front of the name.
Add (Trigger Conditions)
Adds and configures a trigger condition.
Select Journal selects a journal to be associated with the trigger. After you select a journal, its
name will be listed in the Add Trigger Conditions dialog box.
Trigger Input Device selects a trigger input device to use for the condition.
Trigger Input Pin # specifies the pin number that will receive the signal.
Trigger When Pin Goes (High or Low) specifies the desired state of the pin necessary to
trigger the journal.
Remove (Trigger Conditions)
Removes the selected trigger condition from the Trigger Conditions list.
Edit (Trigger Conditions)
Allows you to edit a previously configured trigger input device. The options available are
the same as those for the Add command.
OK
Closes the Trigger Journals dialog box.
MetaFluor
416
Version 7.0
MetaFluor User’s Guide
Use Trigger Journals (Journals Menu)
Enables or disables the use of the Trigger Journals command.
Use this command to enable or disable the use of the trigger conditions set up in the Trigger
Conditions dialog box. When enabled (marked with a check mark), this command polls the
trigger input device to see if a trigger condition has been met; if it has, this command runs the
journal specified in the condition.
Use the Trigger Journals command to set up the condition(s) prior to using this command.
Note: This command is unavailable in the MetaFluor Offline system.
See Also:
Trigger Journals
Wait for Trigger
MetaFluor
417
Version 7.0
MetaFluor User’s Guide
Using Trigger Journals
To enable the Use Trigger Journals command, use the following procedure:
Step
Action
1
Select the Journals menu.
2
Choose Use Trigger Journals. This will toggle
the command's state. If it is enabled, a check
mark will appear before its name on the menu.
If it is enabled, choosing Use Trigger Journals
will disable it and the check mark will be
removed from the menu.
MetaFluor
418
Version 7.0
MetaFluor User’s Guide
Wait for Trigger (Journals Menu)
Waits for the selected trigger condition(s) to be met and runs the associated
journal as each condition is met.
Use this command when you want MetaFluor to suspend all activity until a signal that meets
the selected trigger condition(s) is received from the trigger input device. When a condition is
met, its journal will be run. Because the Wait for Trigger dialog box is modal (operates in a
restricted mode), you will not be able to use any other MetaFluor command until all of the
conditions are met or until you cancel the command.
This command waits for those conditions that were enabled in the Trigger Journals dialog box.
Note: This command is unavailable in the MetaFluor Offline system.
See Also:
Trigger Journals
Use Trigger Journals
MetaFluor
419
Version 7.0
MetaFluor User’s Guide
Waiting for a Trigger
To configure MetaFluor to wait for a trigger, use the following procedure:
Step
Action
1
From the Journals menu, choose Wait for
Trigger. The Wait for Trigger dialog box will
appear.
2
When the conditions specified in the Trigger
Journals dialog box have been met, the Wait
for Trigger dialog box will close.
If an error occurs while the journal is running,
a message box will appear, asking if you want
to remove the offending journal.
3
If you want to cancel the Wait for Trigger
command before the remaining condition(s)
are met, choose Cancel.
MetaFluor
420
Version 7.0
MetaFluor User’s Guide
Create Journal Toolbar (Journals Menu)
Creates a toolbar consisting of buttons that allow you to run a journal with a single
click of a mouse button.
Use this command to create toolbars for accessing frequently used groups of related journals.
You can create and save as many journal toolbars as you want, but only one can be used at a
time. Each journal toolbar can consist of up to 50 buttons in a configuration of rows and
columns of your choice. By adjusting the width of the buttons, you can create toolbars with
very small buttons that resemble an icon bar, or you can create toolbars with long buttons for
descriptive text. You can also embellish the buttons with a button graphic, such as a small
colored square or an arrowhead.
After a toolbar is created, you can immediately assign previously created journals to its
buttons. Use the Edit Journal Toolbar command to assign journals to buttons later.
Note: If you load an updated version of MetaFluor to a different directory from the previous
version, you will need to update your old journal toolbars with the Edit Journal Toolbar
command so that the toolbars will be configured to look for its journals in the appropriate
directory.
See Also:
Edit Journal Toolbar
Load Journal Toolbar
List of Journal Functions
MetaFluor
421
Version 7.0
MetaFluor User’s Guide
Creating a Journal Toolbar
To create a journal toolbar, use the following procedure:
Step
Action
1
From the Journals menu, choose Create
Journal Toolbar. The Create Journal Toolbar
dialog box will appear.
2
Select the number of rows and columns for the
toolbar using Rows and Columns. Then select
the Width (# Letters) of Each Button. Choose
OK.
3
If desired, type a title for the Toolbar in the
Journal Toolbar Title text box.
4
Choose OK. The Create Journal Toolbar
dialog box will close, and the Select a New
Journal Toolbar Name dialog box will appear.
Type the file name for the toolbar in the File
Name text box. The file extension ".jtb" will be
assigned to your file name. Choose Save.
5
The Edit Journal Toolbar dialog box will
appear. This consists of two tabbed pages, a
Buttons page which you will use to assign
functions to the Toolbar buttons, and a Toolbar
page which consists of the options you used in
Steps 2 and 3.
Select the Buttons tab.
6
To assign a journal to a button, highlight the
desired button location for the journal name in
the Journal Name list and choose Assign
Entry.
7
The Select a Journal dialog box will appear.
Select the file for the desired journal. If
necessary, use the Look In list or Up One
Level button to locate the appropriate drive
and folder. Then choose Open.
8
When the journal name appears in the Journal
Name table, type the text that is to appear on
the button in the Wording to Appear on Button
text box.
9
If you want to place a graphic on the button (a
colored square or a directional arrowhead),
choose the Button Graphic command button.
The Button Graphic dialog box will appear.
Click the graphic of your choice. The Button
Graphic dialog box will close automatically.
and the graphic you chose will appear on the
Button Graphic command button for the
selected entry in the Journal Name table.
10
Repeat Steps 6 - 9 until you have assigned a
journal to each button. If you wish, you can
MetaFluor
422
Version 7.0
MetaFluor User’s Guide
leave some buttons blank for future use.
11
When you have finished, choose Close.
MetaFluor
423
Version 7.0
MetaFluor User’s Guide
Create Journal Toolbar - Dialog Box Options
Rows
Specifies the number of rows for the journal toolbar.
Columns
Specifies the number of columns for the journal toolbar.
Width (# Letters) of Each Button
Specifies the width of each button (number of letters that appears on the button).
Journal Toolbar Title
Specifies the title that appears at the top of the toolbar.
OK
Creates the toolbar and opens the Select a New Journal Toolbar Name dialog box to
save the toolbar file. Type the desired file name in the File Name text box and choose
Save.
Cancel
Cancels the command.
MetaFluor
424
Version 7.0
MetaFluor User’s Guide
Edit Journal Toolbar - Dialog Box Options
Buttons Tab Page
Journal Name
Lists the names of the journals assigned to each button in the toolbar. "<Empty>" means
that a journal has not been assigned to that button.
Assign Entry
Selects a journal to be assigned to a journal toolbar button.
Clear Entry
Clears the assigned journal from the button currently selected in the Journal Name table
and displays "<Empty>" for that particular button.
Clear All Entries
Clears all assigned journals from the Journal Name table and displays "<Empty>" for all
buttons. When you you choose this button, a message window will appear, asking you to
verify that you wish to clear all buttons.
Button Graphic
Opens the Button Graphic dialog box, from which you can select a graphic (a colored
square or a directional arrowhead) which will appear on the currently selected button.
Wording to Appear on Button
Specifies a label for the currently selected button.
Toolbar Title
Specifies the title that appears at the top of the toolbar.
Close
Closes the Edit Journal Toolbar dialog box.
Toolbar Tab Page
Rows
Selects the number of rows in the toolbar.
Columns
Selects the number of columns in the toolbar.
Width
Selects the number of characters displayed on each toolbar button.
Toolbar Title
Specifies the title that appears at the top of the toolbar.
Close
MetaFluor
425
Version 7.0
MetaFluor User’s Guide
Closes the Edit Journal Toolbar dialog box.
MetaFluor
426
Version 7.0
MetaFluor User’s Guide
Edit Journal Toolbar (Journals Menu)
Assigns journals to empty toolbar buttons, replaces existing journals assigned to
buttons with new journals, and clears journals from the selected toolbar. Adds new
rows or columns of buttons to the selected toolbar.
Use this command when you want to add or change the journals assigned to an existing
toolbar's buttons or when you want to change the size of the toolbar. This command will be
unavailable until a journal toolbar has been created with the Create Journal Toolbar
command.
Note: If you load an updated version of MetaFluor to a different directory from the previous
version, you will need to update your old journal toolbars with the Edit Journal Toolbar
command so that the toolbars will be configured to look for its journals in the appropriate
directory.
See Also:
Create Journal Toolbar
Load Journal Toolbar
List of Journal Functions
MetaFluor
427
Version 7.0
MetaFluor User’s Guide
Editing Journal Toolbars
To edit a journal toolbar, use the following procedure:
Step
Action
1
From the Journals menu, choose Edit Journal
Toolbar. The Edit Journal Toolbar dialog box
will appear. This consists of two tabbed pages,
a Buttons page and a Toolbar page.
2
If you want to change the number of buttons
on the Toolbar, change the configuration of
rows and columns, or change the width of the
buttons, select the Toolbar tab.
3
Change the number of rows or columns as
desired by making an alternative selection
from the Rows and Columns spin boxes,
respectively.
4
To change the width of the buttons, select a
new width from the Width spin box.
5
To change the Toolbar's title, overtype the
current entry in the Toolbar Title text box with
the new title.
6
To change the assignments of journals,
graphics, or labels of the Toolbar buttons,
select the Buttons tab.
7
To change the journal assignment of a button,
highlight the desired button location for the
journal name in the Journal Name list and
choose Assign Entry.
8
The Select a Journal dialog box will appear.
Select the file for the desired journal. If
necessary, use the Look In list or Up One
Level button to locate the appropriate drive
and folder. Then choose Open.
9
When the journal name appears in the Journal
Name table, type the text that is to appear on
the button in the Wording to Appear on Button
text box.
10
If you want to place a graphic on the button (a
colored square or a directional arrowhead), or
change the graphic assignment of the button,
choose the Button Graphic command button.
The Button Graphic dialog box will appear.
Click the graphic of your choice, or choose
(None) to remove an assigned graphic. The
Button Graphic dialog box will close
automatically. and the graphic you chose will
appear on the Button Graphic command
button for the selected entry in the Journal
Name table.
11
Repeat Steps 7 - 10, as needed, for each
button.
MetaFluor
428
Version 7.0
MetaFluor User’s Guide
12
When you have finished, choose Close.
MetaFluor
429
Version 7.0
MetaFluor User’s Guide
Edit Journal Toolbar - Dialog Box Options
Buttons Tab Page
Journal Name
Lists the names of the journals assigned to each button in the toolbar. "<Empty>" means
that a journal has not been assigned to that button.
Assign Entry
Selects a journal to be assigned to a journal toolbar button.
Clear Entry
Clears the assigned journal from the button currently selected in the Journal Name list
and displays "<Empty>" for that particular button.
Clear All Entries
Clears all assigned journals from the Journal Name list and displays "<Empty>" for all
buttons. When you you choose this button, a message window will appear, asking you to
verify that you wish to clear all buttons.
Button Graphic
Opens the Button Graphic dialog box, from which you can select a graphic (a colored
square or a directional arrowhead) which will appear on the currently selected button.
Wording to Appear on Button
Specifies a label for the currently selected button.
Toolbar Title
Specifies the title that appears at the top of the toolbar.
Close
Closes the Edit Journal Toolbar dialog box.
Toolbar Tab Page
Rows
Selects the number of rows in the toolbar.
Columns
Selects the number of columns in the toolbar.
Width
Selects the number of characters displayed on each toolbar button.
Toolbar Title
Specifies the title that appears at the top of the toolbar.
Close
MetaFluor
430
Version 7.0
MetaFluor User’s Guide
Closes the Edit Journal Toolbar dialog box.
MetaFluor
431
Version 7.0
MetaFluor User’s Guide
Load Journal Toolbar (Journals Menu)
Loads the selected toolbar as the active toolbar.
Use this command when you want to load a different toolbar as the active toolbar. When the
toolbar is loaded, you can run any of the journals assigned to its buttons.
If you were using a toolbar prior to saving the current protocol file, that toolbar will be loaded
the next time the protocol file is used (this also applies to the default protocol file). This means
that you may only need to use the Load Journal Toolbar command to switch between toolbars.
See Also:
Create Journal Toolbar
MetaFluor
432
Version 7.0
MetaFluor User’s Guide
Loading a Journal Toolbar
To load a journal toolbar, use the following procedure:
Step
Action
1
From the Journals menu, choose Load Journal
Toolbar. The Select a Journal Toolbar dialog
box will appear.
2
Select the desired toolbar file. Use the Look In
list or Up One Level button to locate the
correct drive and folder, if necessary.
3
Choose Open. The selected toolbar will
appear in the MetaFluor application window.
MetaFluor
433
Version 7.0
MetaFluor User’s Guide
Load Journal Toolbar- Dialog Box Options
File Name
Lists the name of the currently selected journal file.
Files of Type
Determines the file format of the files to be displayed in the File Name list.
Look In
Displays the currently selected folder. Click the icon for the desired folder to display its
files. Click the Up One Level button to go up one level in the directory structure.
Open
Opens the toolbar file.
Cancel
Cancels the command.
MetaFluor
434
Version 7.0
MetaFluor User’s Guide
Journal Toolbar Shortcuts (Journals Menu)
Displays a secondary menu which lists keyboard shortcuts that can be used to run
the journals that are on the current toolbar.
Use this command to view the keyboard shortcuts for each journal on the toolbar. Although
you can run the journals by selecting a menu item from the secondary menu, this command's
purpose is to provide you with a list of the keyboard shortcuts assigned to the current journal
toolbar. Shortcuts which are not assigned to a toolbar button will display the message "Not
available" in dimmed text.
Once you know the shortcuts associated with each journal, you won't need to use the Journal
Toolbar Shortcuts command. The keyboard shortcuts work the same way as other keyboard
shortcuts listed in the menus: press and hold the first key and then press the second key
listed.
EXAMPLE:
The first journal toolbar on the active toolbar might be named "Acquire." Its shortcut is CTRL +
1. Press and hold the [CTRL] key and then press the number [1] on your keyboard.
See Also:
Create Journal Toolbar
Load Journal Toolbar
MetaFluor
435
Version 7.0
MetaFluor User’s Guide
Using the Journal Toolbar Shortcuts
To use the journal toolbar shortcuts, use the following procedure:
Step
Action
1
Select the Journals menu.
2
Choose Journal Toolbar Shortcuts. A
secondary menu will appear. The menu lists
the toolbar's journals and the keyboard
shortcut assigned to each position on the
toolbar. Shortcuts which are not assigned to a
toolbar button will display the message "Not
available" in dimmed text.
3
To run a particular journal, choose it from the
secondary menu.
OR
Use the keyboard shortcut listed next to the
journal: press and hold the [CTRL] key and
then press the assigned numeric key.
MetaFluor
436
Version 7.0
MetaFluor User’s Guide
Show Journal Toolbar (Journals Menu)
Displays the current journal toolbar.
Use this command when you want to display a toolbar that has been hidden with the Hide
Journal Toolbar command. If there is no active journal toolbar, this command will be
unavailable and will appear in dimmed text. Use the Load Journal Toolbar command to load a
journal toolbar.
Shortcut: CTRL + J
See Also:
Hide Journal Toolbar
Load Journal Toolbar
MetaFluor
437
Version 7.0
MetaFluor User’s Guide
Showing the Active Journal Toolbar
To show the active journal toolbar, use the following procedure:
Step
Action
1
Select the Journals menu.
2
Choose Show Journal Toolbar. The active
toolbar will appear, and the Show Journal
Toolbar command in the Journals menu will be
replaced by the Hide Journal Toolbar
command.
Note: An alternative to the menu command is
to use a keyboard shortcut, CTRL + J, to show
or hide the toolbar. This key allows you to
toggle back and forth between states.
MetaFluor
438
Version 7.0
MetaFluor User’s Guide
Hide Journal Toolbar (Journals Menu)
Hides the current journal toolbar from view.
Use this command when you want to hide the current journal toolbar to gain additional
desktop space or when the toolbar is not currently needed.
Shortcut: CTRL + J
See Also:
Show Journal Toolbar
Load Journal Toolbar
MetaFluor
439
Version 7.0
MetaFluor User’s Guide
Hiding the Active Journal Toolbar
To hide the active journal toolbar, use the following procedure:
Step
Action
1
Select the Journals menu.
2
Choose Hide Journal Toolbar. The active
toolbar will disappear, and the Hide Journal
Toolbar command in the Journals menu will be
replaced by the Show Journal Toolbar
command.
Note: An alternative to the menu command is
to use a keyboard shortcut, CTRL + J, to show
or hide the toolbar. This key allows you to
toggle back and forth between states.
MetaFluor
440
Version 7.0
MetaFluor User’s Guide
Windows Menu
MetaFluor
441
Version 7.0
MetaFluor User’s Guide
Show or Hide Toolbar (Windows Menu)
Displays or hides the Icon Toolbar.
Use this command to display or hide the Icon Toolbar. After you have hidden the Icon Toolbar
using this command, you can display it again by rechoosing the Show or Hide Toolbar
command.
The Icon Toolbar provides quick access to frequently used menu commands for MetaFluor's
acquisition or playback modes. You can still access these commands directly from the menu if
you wish.
The Icon Toolbar is displayed in one of three modes. When you first start MetaFluor, a "start
up" toolbar is shown. Click on the icons for a description of each their functions:
When you start a new experiment, the following "new experiment" Icon Toolbar will be
displayed. Click on the icons for a description of each their functions:
When you open a previously stored experiment for playback, a different set of icons will be
displayed in an "open experiment" Icon Toolbar. Click on the icons for a description of each
their functions:
Shortcut: CTRL + T
MetaFluor
442
Version 7.0
MetaFluor User’s Guide
Showing or Hiding the Icon Toolbar
To show or hide the Icon Toolbar, use the following procedure:
Step
Action
1
Select the Windows menu.
2
Choose Show or Hide Toolbar.
If the Icon Toolbar is visible, it will be hidden. If
it is already hidden, it will be displayed instead.
MetaFluor
443
Version 7.0
MetaFluor User’s Guide
Show or Hide Command Bar (Windows Menu)
Displays or hides the Command Bar.
Use this command to display or hide the Command Bar. After you have hidden the Command
Bar using this command, you can display it again by rechoosing the Show or Hide Command
Bar command.
The Command Bar provides quick access to frequently used menu commands for MetaFluor's
acquisition or playback modes. You can still access these commands directly from the menu if
you wish. To view a description of each of the commands in the Command Bar, choose More
>>. The Command Bar window will expand, and the More >> button will be replaced by the
Less << button. Choosing this button will condense the Command Bar again, so that it uses
less space in the MetaFluor application window.
Shortcut: CTRL + B
MetaFluor
444
Version 7.0
MetaFluor User’s Guide
Showing or Hiding the Command Bar
To show or hide the Command Bar, use the following procedure:
Step
Action
1
Select the Windows menu.
2
Choose Show or Hide Command Bar.
If the Command Bar is visible, it will be hidden.
If it is already hidden, it will be displayed
instead.
MetaFluor
445
Version 7.0
MetaFluor User’s Guide
Show or Hide Graphs (Windows Menu)
Displays or hides time-based graphs (measurements and analog data).
Use this command to display or hide the measurements and analog data graphs. Hiding the
graphs will allow you to conserve computer memory and space on your screen without
requiring you to redefine regions when you want to bring back the graph display. Graphs can
be displayed again by rechoosing the Show or Hide Graphs command. The measurements
graphs that will be displayed include those that have been enabled by selecting the Show
Graphs check box in the Configure Graphs dialog box.
Shortcut: [F8]
See Also:
Configure Graphs
MetaFluor
446
Version 7.0
MetaFluor User’s Guide
Showing or Hiding Graphs
To show or hide graphs, use the following procedure:
Step
Action
1
Select the Windows menu.
2
Choose Show or Hide Graphs.
If the graphs are visible, they will be hidden. If
they are already hidden, they will be displayed
instead.
MetaFluor
447
Version 7.0
MetaFluor User’s Guide
Open Sequence Status (Windows Menu)
Opens the Sequence Status window.
Use this command to display the Sequence Status window. This window displays the current
experimental clock time, acquisition cycle number, and last journal run. This counter is
particularly useful for keeping track of journal sequencing.
Note: This command is unavailable in the MetaFluor Offline system.
See Also:
Close Sequence Status
Sequence Journals
Zero Clock
MetaFluor
448
Version 7.0
MetaFluor User’s Guide
Opening the Sequence Status Window
To open the Sequence Status window, use the following procedure:
Step
Action
1
From the Windows menu, choose Open
Sequence Status. The Sequence Status
window will appear.
2
You can close the Sequence Status window at
any time by clicking the Close button in its
upper right corner, or by choosing Close
Sequence Status from the Windows menu.
MetaFluor
449
Version 7.0
MetaFluor User’s Guide
Sequence Status - Dialog Box Options
Clock
Displays the elapsed time from when an experiment was opened or the Zero Clock
command was last carried out.
Count
Displays the current acquisition cycle.
Last Journal Run
Displays the name of the last journal to be run in the current session. If no journal has
been run, this field will be blank.
MetaFluor
450
Version 7.0
MetaFluor User’s Guide
Close Sequence Status (Windows Menu)
Closes the Sequence Status window.
Use this command to close the Sequence Status window. This window displays the current
experimental clock time, acquisition cycle number, and last journal run.
Note: This command is unavailable in the MetaFluor Offline system.
See Also:
Open Sequence Status
Sequence Journals
MetaFluor
451
Version 7.0
MetaFluor User’s Guide
Closing the Sequence Status Window
To close the Sequence Status window, use the following procedure:
Step
1
Action
From the Windows menu, choose Close
Sequence Status.
OR
Clicking the Close button in the upper right
corner of the Sequence Status window.
2
The Sequence Status window will close.
MetaFluor
452
Version 7.0
MetaFluor User’s Guide
Open Status Window (Windows Menu)
Opens the Status window.
Use this command to display the Status window. The upper part of this window displays error
messages, event marks, and Display Message journal command messages. You can clear
the message at any time.
The lower half of this window displays the image saving status. The first line for the image
saving status displays what will be saved if image saving is enabled (such as the entire
image). The second line displays when the next image will be saved, how many more images
can be saved, and the drive where the images are being saved.
If you want to display the Status window whenever you open an experiment, you can
configure a preference for this in the General Preferences dialog box (Preferences command,
File menu).
See Also:
Close Status Window
Preferences
MetaFluor
453
Version 7.0
MetaFluor User’s Guide
Opening the Status Window
To open the Status window, use the following procedure:
Step
Action
1
From the Windows menu, choose Open Status
Window. The Status window will appear.
2
Choose Clear whenever you want to clear a
message from the Status window.
MetaFluor
454
Version 7.0
MetaFluor User’s Guide
Status - Dialog Box Options
Msg
Displays error messages, event marks, and Display Message journal command
messages
Save
Indicates the current image saving status (whole image, region, and so on), when the
next image will be saved, how many more images can be saved, and the drive where the
images are being saved.
Clear
Clears the message from the Msg status line.
Close
Closes the Status window.
MetaFluor
455
Version 7.0
MetaFluor User’s Guide
Close Status Window (Windows Menu)
Closes the Status window.
Use this command to close the Status window. You can also close the Status window using its
Close command button.
If you do not want to display the Status window every time you open an experiment, you can
configure a preference for this in the General Preferences dialog box (Preferences command,
File menu).
See Also:
Open Status Window
Preferences
MetaFluor
456
Version 7.0
MetaFluor User’s Guide
Closing the Status Window
To close the Status window, use the following procedure:
Step
Action
1
Select the Windows menu.
2
Choose Close Status Window. The Status
window will close.
MetaFluor
457
Version 7.0
MetaFluor User’s Guide
Open Notebook (Windows Menu)
Opens the Notebook.
Use this command when you want to keep notes while you are working on an experiment.
MetaFluor records the current date and time in the Notebook file when you open the
Notebook. You can type any additional information as necessary. The Notebook is a simplified
text editor: you can copy, cut, and paste text to and from it. If you want to start a new line
in the Notebook, hold down the [CTRL] key while pressing the [ENTER] key. The text
box can be resized as need by dragging its borders.
Note: The pop-up context menu that appears when you right-click in the Notebook window
contains commands that allow you to cut, copy, paste, or delete text, as well as to undo any
changes you make.
When you save images from an experiment, the corresponding Notebook file will also be
saved. This is a text file (*.txt) that can be opened with the Microsoft WordPad or Notepad
programs (which come bundled with Windows). In addition, the Notebook window has Copy
and Print command buttons that allow you to copy the text to the Clipboard or send it to a
printer. Notebook files can be saved and loaded independently using the Save and Load
command buttons, respectively.
You can configure a preference in the General Preferences dialog box to open the Notebook
automatically whenever an experiment is open (Preferences command, File menu).
See Also:
Preferences
Close Notebook
MetaFluor
458
Version 7.0
MetaFluor User’s Guide
Opening the Notebook
To open the Notebook, use the following procedure:
Step
Action
1
Start a new experiment or open a previously
stored experiment.
2
From the Windows menu, choose Open
Notebook. The Notebook window will appear.
3
If you want to load a previously saved
Notebook file, choose Load and select the icon
for the desired .txt file from the Load Notebook
dialog box that appears. If necessary, use the
Look In drop-down list box or Up One Level
icon button to locate the appropriate drive and
folder. Then choose Open.
4
In the Notebook window's text box, type the
text you want to save. If you alter the entry in a
previously saved Notebook, the word
"(Modified)" will be appended to the name in
the Notebook window's title bar.
5
If you want to print the information in the
Notebook window, choose Print.
OR
If you want to copy the information to the
Clipboard so that you can paste it into another
Windows-based program, choose Copy.
6
If you want to save the text in a Notebook file
now, choose Save. The Save Notebook dialog
box will appear. Type a name for the file in the
File Name text box. Then choose Save.
OR
If you want to save the Notebook file
automatically when you end the experiment,
you need do nothing. The file will be saved
automatically under the .inf file's name with the
".txt" extension when you end the experiment.
MetaFluor
459
Version 7.0
MetaFluor User’s Guide
Open Notebook - Dialog Box Options
Text Box
Use the text box at the top to type, copy text to or copy text from the Notebook. You can
Advance One Line:
Press the [CTRL] and [ENTER] keys simultaneously with the insertion point positioned at the
end of the previous line.
Select One Word:
Position the pointer above the word and double-click the left mouse button.
Cut Text:
Select the desired text and press [CTRL] + [X].
Copy Text:
Select the desired text and press [CTRL] + [C].
Paste Text:
Select the desired text and press [CTRL] + [V]
Delete Text:
Press the [BACKSPACE] or the [DEL] key.
Clear
Deletes all of the text in the Notebook.
Load
Opens the Load Notebook dialog box, from which you can load a previously saved
Notebook (*.txt) file.
Save
Opens the Save Notebook dialog box, from which you can save the current Notebook
(*.txt) file. Note: Notebook files are saved automatically when an experiment is ended.
You should only need to use the Save command if you want to save independent
Notebook entries.
Copy
Copies the information in the Notebook text box to the Clipboard, so that you can paste it
into another Windows-based program.
Print
Sends the information in the Notebook text box to your default printer.
Close
Closes the Notebook.
MetaFluor
460
Version 7.0
MetaFluor User’s Guide
Close Notebook (Windows Menu)
Closes the Notebook.
Use this command when you want to close the Notebook. The Notebook is used to record
notes while you are working on an experiment.
When you save images from an experiment, the corresponding notebook (*.txt) file is also
saved. This file is a text file and can be opened with the Windows WordPad or NotePad
programs if you want to print a copy of it.
Use the Open Notebook command to open the Notebook again if necessary.
You can configure a preference in the General Preferences dialog box to open the Notebook
automatically whenever an experiment is open (Preferences command, File menu).
See Also:
Preferences
Open Notebook
MetaFluor
461
Version 7.0
MetaFluor User’s Guide
Closing the Notebook
To close the Notebook, use the following procedure:
Step
Action
1
Select the Windows menu.
2
Choose Close Notebook. The Notebook will
close.
MetaFluor
462
Version 7.0
MetaFluor User’s Guide
Open Annotation (Windows Menu)
Opens the Annotation window.
Use this command during a new experiment or during playback of a stored experiment to view
a display of the annotations that are automatically made during image acquisition. The
annotations will include the (1) Video acquisition, (2) Exposure time, (3) Image region size,
and (4) Background subtraction and shading correction status of each image.
Note: The pop-up context menu that appears when you right-click in the Annotation window
contains commands that allow you to cut, copy, paste, or delete text, as well as to undo any
changes you make.
See Also:
Close Annotation
MetaFluor
463
Version 7.0
MetaFluor User’s Guide
Opening the Annotation Window
To open the Annotation window, use the following procedure:
Step
Action
1
Start a new experiment or open a previously
stored experiment.
2
From the Windows menu, choose Open
Annotation. The menu item will change to
Close Annotation, and the Annotation window
will appear. The annotations for the currently
open images will be displayed in the main text
box in the lower portion of the dialog box.
3
To view a display of a particular image, select
the image window from the Image drop-down
list box.
4
To view the annotations for images at a
different timepoint in an experiment being
played back, use the Experiment Control
Panel to switch to the desired timepoint.
MetaFluor
464
Version 7.0
MetaFluor User’s Guide
Open Annotation - Dialog Box Options
Image
Selects the image whose annotation you want to display.
Annotation text box
Displays information regarding the selected image’s video acquisition mode, exposure
time, size, and background subtraction and shading correction status.
MetaFluor
465
Version 7.0
MetaFluor User’s Guide
Close Annotation (Windows Menu)
Closes the Annotation window.
Use this command when you want to close the Annotation window. The Annotation window is
used to view a display of annotations that are made automatically during image acquisition.
The annotations will include the (1) Video acquisition, (2) Exposure time, (3) Image region
size, and (4) Background subtraction and shading correction status of each image.
See Also:
Open Annotation
MetaFluor
466
Version 7.0
MetaFluor User’s Guide
Closing the Annotation Window
To close the Annotation window, use the following procedure:
Step
Action
1
Select the Windows menu.
2
Choose Close Annotation. The Annotation
window will close.
MetaFluor
467
Version 7.0
MetaFluor User’s Guide
Arrange Windows (Windows Menu)
Resizes and tiles all open image windows so that they fit across the top of the
MetaFluor application workspace.
Use this command when you want to optimize space on the desktop. The image windows will
be resized to fit in a single row across the application window.
See Also:
Bring Images to Front
MetaFluor
468
Version 7.0
MetaFluor User’s Guide
Arranging the Image Windows
To arrange the image windows to fit in a single row, use the following procedure:
Step
Action
1
Select the Windows menu.
2
Choose Arrange Windows. All open image
windows will be tiled horizontally across the
upper edge of the MetaFluor application
workspace.
MetaFluor
469
Version 7.0
MetaFluor User’s Guide
Bring Images to Front (Windows Menu)
Brings image windows to the uppermost layer of the workspace display.
Use this command when your image windows are obscured by dialog boxes or graph windows
and you need to see the entire images without obstruction. This command is particularly
handy when your workspace is cluttered with dialog boxes or graph windows that, because of
their size or numbers, obscure your view of the image windows.
If you have overlapping images in your workspace, successive uses of this command will
bring images to front by alternating between the "lowest" and "highest" windows in the pile.
Note: Some dialog boxes are "modal"; that is, they must be closed before you can use
another command. There will therefore be some conditions under which you will not be able to
take advantage of the "Bring to Front" commands.
Shortcut: CTRL + I
See Also:
Bring Dialogs to Front
Bring Graphs to Front
MetaFluor
470
Version 7.0
MetaFluor User’s Guide
Bringing Images to Front
To bring an otherwise obscured image window to the "top" of your workspace display,
use the following procedure:
Step
Action
1
Select the Windows menu.
2
Choose Bring Images to Front. The obscured
image window will be displayed in the topmost
layer of the workspace display.
3
As an alternative, you can use the keyboard
shortcut, CTRL + I.
MetaFluor
471
Version 7.0
MetaFluor User’s Guide
Bring Dialogs to Front (Windows Menu)
Brings dialog boxes to the uppermost layer of the workspace display.
Use this command when your workspace is cluttered with image or graph windows that,
because of their size or numbers, obscure your view of the command dialog box. This
command is most effectively used for bringing the Experiment Control Panel to the front.
Note: Some dialog boxes are "modal"; that is, they must be closed before you can use
another command. There will therefore be some conditions under which you will not be able to
take advantage of the "Bring to Front" commands.
Shortcut: CTRL + D
See Also:
Bring Images to Front
Bring Graphs to Front
MetaFluor
472
Version 7.0
MetaFluor User’s Guide
Bringing Dialogs to Front
To bring an otherwise obscured dialog box to the "top" of your workspace display, use
the following procedure:
Step
Action
1
Select the Windows menu.
2
Choose Bring Dialogs to Front. The obscured
dialog box will be displayed in the topmost
layer of the workspace display.
Note: This command is most effectively used
for bringing the Experiment Control Panel to
the front.
3
As an alternative, you can use the keyboard
shortcut, CTRL + D.
MetaFluor
473
Version 7.0
MetaFluor User’s Guide
Bring Graphs to Front (Windows Menu)
Brings the graph windows to the uppermost layer of the workspace display.
Use this command when your workspace is cluttered with image windows and dialog boxes
that, because of their size or numbers, obscure your view of the graph windows.
Note: Some dialog boxes are "modal"; that is, they must be closed before you can use
another command. There will therefore be some conditions under which you will not be able to
take advantage of the "Bring to Front" commands.
Shortcut: CTRL + G
See Also:
Bring Images to Front
Bring Dialogs to Front
MetaFluor
474
Version 7.0
MetaFluor User’s Guide
Bringing Graphs to Front
To bring your otherwise obscured graph windows to the "top" of your workspace display,
use the following procedure:
Step
Action
1
Select the Windows menu.
2
Choose Bring Graphs to Front. The obscured
graph windows will be displayed in the
topmost layer of the workspace display.
3
As an alternative, you can use the keyboard
shortcut, CTRL+ G.
MetaFluor
475
Version 7.0
MetaFluor User’s Guide
Analog Menu
MetaFluor
476
Version 7.0
MetaFluor User’s Guide
Introduction to the Analog Measurements Drop-in
Overview
The Analog Measurements drop-in, DAC, supplies an additional menu of MetaFluor
commands for acquisition of voltage data in addition to, or in lieu of, acquisition of images.
Sources of the voltage data can be simple measurement probes, such as a calcium or oxygen
electrode, or they can be multiplexed devices for continuous measurement, such as are used
in electrophysiology. MetaFluor can acquire the voltage data either at a particular time during
the acquisition cycle, or continuously at a user-specified rate during the experiment.
Graphing, Logging, and Saving Analog Data
Analog data acquired by MetaFluor can be graphed, logged, and/or saved to a file. Each
measurement channel, from as many as 16 channels, can have its own data column in a log
file and its own scrolling, time-based graph. Any analog data that have been saved to a .bin
file can be replayed for offline analysis. In addition, two channels can be "ratioed" and the ratio
represented on another configurable, time-based graph. (However, the numeric format of ratio
data prevents the saving of analog ratio values in a .bin file.)
Equipment Required for Analog Measurements
To perform analog measurements in MetaFluor, you will need the Analog Measurements
drop-in, DAC.out, a National Instruments data acquisition (DAQ) board such as the PC-LPM16 or LAB-PC+ boards, and your own measurement probes or other hardware which generate
analog signals suitable for use with the data acquisition board.
Prior to Using the Analog Measurements Drop-in
First you will need to install the National Instruments data acquisition board and the National
Instruments software drivers. (Follow the instructions provided in the National Instruments
documentation that was included with the board.)
Then you will need to install the Analog Measurements drop-in using the MetaMorph Meta
Imaging Series Administrator. The name for this drop-in is DAC. After you have installed the
drop-in, you can start MetaFluor.
Finally, you will need to install the hardware driver for the drop-in and configure a Data
Acquisition Device to be able to make analog measurements. You can do this from the dialog
box that opens when you choose Configure Analog Measurements from the Analog menu.
Alternatively, you can use the Illumination Control command from the Devices menu to install
and configure the hardware driver.
MetaFluor
477
Version 7.0
MetaFluor User’s Guide
Configure Analog Measurements (Analog Menu)
Configures the device(s) supplying analog data to the computer.
Drop-in: DAC
Use this command to configure the hardware used for acquiring analog measurement data
and to configure the display and storage of analog measurement data. This function allows
MetaFluor to act like an analog-to-digital converter (ADC), acquiring data from such source
signals as pH meters, calcium or oxygen electrodes, temperature probes, and
electrophysiological amplifiers. Data can be acquired at a user-specified stage in the
ratiometric acquisition cycle, or it can be acquired asynchronously at a user-specified rate.
Note: You must first start a new experiment for this command to be enabled.
When you configure your data acquisition, you will select the data channel to be associated
with each "virtual" channel that is acquired by MetaFluor. Alternatively, you can select a ratio
of two data channels, or create your own equation that uses any combination of data channels
and arithmetic operators, constant values, logical operators, or Boolean functions. This
flexibility allows you, for example, to perform shading correction and background subtraction
on each of two Wavelength inputs and then plot the ratio of the two sets corrected images.
QUICK TIP: You can hide and redisplay the analog data graphs by choosing Show or Hide
Graphs from the Windows menu or by using the keyboard shortcut, the [F8] function key.
See Also:
Overview of the Use of Configure Analog Measurements
Analog Display
Analog Async Status
Replay Stored Data
Convert Data File to Text File
MetaFluor
478
Version 7.0
MetaFluor User’s Guide
Overview of the Use of the Configure Analog
Measurements Command
To use Configure Analog Measurements, use the following procedure:
Step
Action
1
From the Analog menu, choose Configure
Analog Measurements. The Configure Analog
Measurements dialog box will appear.
2
If you have not already done so, you must
install the appropriate hardware driver. Exit
Metafluor and open the Meta Imaging Series
Administrator and follow the instructions in the
help file for yor specific device.
3
Also if you have not done so, you must install
and configure a Data Acquisition Device.
4
In the Configure Analog Measurements dialog
box, define your virtual measurement
channels. Follow the procedure for defining
virtual analog measurements channels.
5
After defining a channel, you must decide if its
data are to be displayed in a real-time graph,
saved as text to a log file, or saved as binary
data to a Save file (*.bin).
If you want to display the data from the
channel in an on-screen graph, follow the
procedure for configuring the analog data
graph.
If you want to save the data from the channel
as text to a log file, follow the procedure for
configuring the analog measurements log.
If you want to save the data from the channel
as binary data to a Save file, follow the
procedure for configuring an analog
measurements Save file.
6
Next you will need to calibrate the
measurement channel. Follow the procedure
for calibrating analog measurements
channels.
7
Repeat Steps 5 - 7 for each measurement
channel.
8
When you have finished, choose Close. You
will now be able to acquire analog data
automatically when you run experiments in
MetaFluor.
MetaFluor
479
Version 7.0
MetaFluor User’s Guide
Defining Virtual Analog Measurements Channels
You will need to define a virtual measurement channel for each analog measurement you
want to make, up to a maximum of 16. You can associate any number of virtual channels
with the same physical channel.
To define a virtual channel for measurement of analog data, use the following procedure:
Step
Action
1
In the Configure Analog Measurements dialog
box, locate the Virtual Channel List Box.
2
Double-click the virtual channel number you
want to use. If a channel is already in use, a
check mark will be seen next to its entry.
3
You next need to associate the virtual channel
with a physical channel. Select one of the
physical channels listed in the Measure dropdown list. If additional configuration is
required, the Configure button will become
available.
If you select Ratio of 2 Channels, you can
assign a ratio of any two data channels to the
virtual channel you are configuring. The
Calibrate Channel button will become a
Configure Ratio button, and the Save Data
check box will become unavailable.
If you select Formula, you can create an
equation using any of the data channels and
arithmetic operators (+, -, *, /), constant
values, logical operators (<, >, =, <>, >+, <+),
or Boolean functions (AND, OR, ABS, IF). The
Calibrate Channel button will become an Edit
Formula button, and the Save Data check box
will become unavailable.
4
Choose Configure and enter the specifications
for your hardware device in the dialog box that
appears. Refer to the device's owner's manual
for the required configuration parameters.
5
From the Sample drop-down list, select the
time during the experiment when the channel
is to acquire data.
6
If you selected Asynchronously in Step 5, a
new control spin box, Sampling Frequency,
will appear. Select the desired rate of
acquisition from this spin box.
7
If you selected Ratio of 2 Channels in Step 3,
choose the Configure Ratio button. The
Configure Ratio dialog box will appear.
AND
Select the appropriate channels from the
numerator (upper) and denominator (lower)
drop-down lists. Choose OK to return to the
Configure Analog Measurements dialog box
MetaFluor
480
Version 7.0
MetaFluor User’s Guide
when you have finished.
8
If you selected Formula in Step3, choose the
Edit Formula button. The Edit Formula dialog
box will appear.
AND
Type a formula in the text box in the upper part
of the dialog box. You can use any
combination of data channels, arithmetic
operators, logical operators, Boolean
functions, and constants in your equation. To
test its validity, choose the Evaluate Formula
button. Choose OK to return to the Configure
Analog Measurements dialog box when you
have finished.
MetaFluor
481
Version 7.0
MetaFluor User’s Guide
Configuring the Analog Data Graphs
To configure a graph for real-time, on-screen display of the data from an analog
measurements channel, use the following procedure. The X-axis will always represent
time.
Note: You can hide and redisplay the analog data graphs by choosing Show or Hide
Graphs from the Windows menu or by using the keyboard shortcut, the [F8] function key.
Step
Action
1
In the Configure Analog Measurements dialog
box, select the Graph Data check box, so that
a check mark appears in it.
2
Choose Configure Graph. The Configure
Graph dialog box will appear.
3
Type a title for the graph in the Graph Title text
box.
4
Type a label for the Y-axis in Title text box.
5
Type a minimum and maximum value for the
range of the Y-axis in the Minimum Value and
Maximum Value text boxes, respectively.
6
To specify the number of major intervals in the
Y-axis, enter a value in Major Tick Marks.
AND
To specify the number of minor tick marks to
be displayed between each major tick mark on
the Y-axis, enter a value in Minor Tick Marks.
7
Use the Maximum Points on the Graph spin
box to specify the number of data points to
appear at a time on the updating analog
measurements graph.
8
If you do not want to graph every data point,
you can use data reduction to specify that only
every nth data point be graphed. To do so,
select the "skip" factor from the Reduce Points
by a Factor of spin box.
AND
From the When Reducing Data option button
group, select a value for each data-reduced
point on the graph: the lowest value (Use
Mimimum Point in Data Set), the highest value
(Use Maximum Point in Data Set), or an
average (Use Average Value of Data Set).
9
When you have finished, choose OK.
MetaFluor
482
Version 7.0
MetaFluor User’s Guide
Configure Graph - Dialog Box Options
Graph Title
Specifies a title for an analog data graph.
Title
Specifies a label for the Y-axis.
Minimum Value
Defines the minimum value for the Y-axis range.
Maximum Value
Defines the maximum value for the Y-axis range.
Major Tick Marks
Specifies the number of major intervals in the Y-axis.
Minor Tick Marks
Specifies the number of minor tick marks to be displayed between each major tick mark
on the Y-axis.
Maximum Points on the Graph
Specifies the number of data points to appear at a time on the updating analog
measurements graph.
Reduce Points by a Factor of
Selects a "skip" factor to specify that only every nth data point is graphed.
When Reducing Data
Selects a value for each data-reduced point on the graph: the lowest value (Use
Mimimum Point in Data Set), the highest value (Use Maximum Point in Data Set), or an
average (Use Average Value of Data Set).
OK
Accepts the graph settings and closes the Configure Graph dialog box.
Cancel
Rejects the graph settings and closes the Configure Graph dialog box.
MetaFluor
483
Version 7.0
MetaFluor User’s Guide
Configuring the Analog Measurements Log
To configure the analog measurements log, use the following procedure. (The log file
itself is defined and opened automatically when you open the Experiment Control Panel
from the Run Experiment menu and select its Log Data check box.)
Note: Asynchronously acquired analog measurements data can not be logged. Data can
be logged only if sampling is conducted at a specific time during the acquisition cycle.
Asynchronously acquired data should be saved to a Save file.
Step
Action
1
In the Configure Analog Measurements dialog
box, select the Log Data check box so that a
check mark appears in it.
2
Choose Configure Log. The Configure Log
dialog box will appear.
3
Type a title in the Column Title text box for the
column in the data file or worksheet to which
data will be logged.
4
Type a description of the data in the
Description text box. The text you enter will be
displayed next to the column title you specified
in Step 3.
5
In the Data Format text box, specify the
number of digits to be output to the data log.
6
When you have finished, choose OK.
MetaFluor
484
Version 7.0
MetaFluor User’s Guide
Configuring the Analog Measurements Save File
To save analog measurements to a binary Save file (*.bin), use the following procedure.
This file can be replayed later to analyze a stored experiment (see Replay Stored Data).
Note: Because of the numeric format used for representing data, ratio values obtained
from "ratioing" a pair of analog channels can not be saved in a .bin file, and the Save
Data check box will be unavailable.
Step
Action
1
In the Configure Analog Measurements dialog
box, select the Save Data check box so that a
check mark appears in it.
2
Choose Configure Save. The Configure Save
dialog box will appear.
3
Choose Select Save File. The Select Save File
dialog box will appear.
4
You can either choose an existing .bin data file
by selecting its icon, or you can type a name in
the File Name text box for a new file to be
created. If necessary, use the Save In dropdown list or Up One Level icon button to
change to the correct location. Then select the
icon for the file and choose Save.
The File Status text field will indicate if a file
already exists and that data will be appended
to it, or it will indicate that the file does not
exist and will be created.
5
If you wish, you can rename a file by choosing
Rename Existing File. The Rename dialog box
will open.
AND
Type the new file name in the New Filename
text box and choose OK.
6
If you want to delete a file that already exists,
choose Delete Existing File. A dialog box will
appear, asking you to verify the deletion.
Choose Yes to confirm deletion.
7
When you have finished, chose Close.
MetaFluor
485
Version 7.0
MetaFluor User’s Guide
Calibrating the Analog Measurements Channels
To calibrate an analog measurements channel, use the following procedure:
Step
Action
1
From the Configure Analog Measurements
dialog box, choose Calibrate Channel. The
Calibrate Channel dialog box will appear.
2
You must have at least two "known" samples
to perform a calibration, and you can have as
many as eight "knowns." Select a check box in
the leftmost column for each "known" sample.
This will enable the corresponding Sample
buttons.
3
Next, for each "known" (standard) sample, put
your measurement probe into the sample and
press the Sample button for that sample. The
measured value, in raw units, will appear in
the Measured text box next to the Sample
button.
4
Now type the known value in the Known text
box.
5
Repeat Steps 3 and 4 for each "known"
sample.
6
Select the type of curve-fitting you want from
the Curve Fit drop-down list.
7
If needed, select the Extrapolate, Enforce
Maximum Limit, or Enforce Minimum Limit
check boxes and enter values in the
associated spin boxes to extrapolate the curve
or to limit it to a specific range.
8
Choose Auto-Calculate Graph Axes to create
the calibration curve.
9
If you change any of the Measured or Known
fields and do not want to change the graph
axes, choose Update Graph to recalculate and
redraw the graph.
10
When you have finished, choose Close.
MetaFluor
486
Version 7.0
MetaFluor User’s Guide
Calibrate Channel - Dialog Box Options
Use
Selecting these check boxes will in turn enable the corresponding Sample buttons. One
of these should be selected for each "known" sample used in the calibration. At least two
"knowns" are needed to perform a calibration, and you can use as many as eight.
Sample
These "buttons" are chosen after loading a standard sample. The sample will be
measured, and the measured value, in raw units, will appear in the corresponding
Measured text box.
Measured
After you press the corresponding Sample button, each of these text boxes will
automatically display the measured value, in raw units, of the standard sample that has
been loaded.
Known
The known value of the standard sample, in actual units, is typed in this text box.
Curve Fit
This drop-down box allows the selection of the type of curve-fitting to be performed in the
calibration procedure. Choices are: Linear Interpolation, Polynomial Interpolation, Line of
Best Fit, Line of Best Log, 3rd Degree Polynomial, and 4th Degree Polynomial.
Extrapolate
Selecting this check box allows extrapolation of the calibration curve beyond the data
points. Be sure to define the desired range with Enforce Maximum Limit and Enforce
Minimum Limit.
Enforce Maximum Limit
Selecting this check box and entering a value in the spin box allows the specification of
the maximum value of the range of the calibration curve.
Enforce Minimum Limit
Selecting this check box and entering a value in the spin box allows the specification of
the minimum value of the range of the calibration curve.
Linear Interpolation Graph
Displays the calibration curve in graphical format.
Update Graph
If any of the Measured or Known fields have been changed, but you do not want to
change the graph axes, choosing this option will recalculate and redraw the graph.
Auto-Calculate Graph Axes
Creates the calibration curve from the Measured and Known data values.
Close
MetaFluor
487
Version 7.0
MetaFluor User’s Guide
Closes the Calibrate Channel dialog box.
MetaFluor
488
Version 7.0
MetaFluor User’s Guide
Configure Analog Measurements - Dialog Box
Options
Virtual Channel List
Lists the available virtual channels (maximum of 16) for measurement of analog data.
You can associate more than one virtual channel with an individual physical device
channel. For example, you can have a single pH measurement probe attached to a
specimen, but may want to record the pH separately for each excitation wavelength. The
pH data for each wavelength can thus be displayed in its own graph. Each channel can
be enabled or disabled with a double-click. When a particular virtual channel is selected,
all option settings in the rest of the dialog box will pertain to that virtual channel.
Measure
Selects a physical hardware channel to be associated with a virtual channel.
Alternatively, you can select Ratio of 2 Channels to take a "ratio" between two analog
data channels, and graph the ratio values on another analog measurements graph, or
you can select Formula to create an expression using any combination of data channels,
constant values, arithmetic operators, logical operators, and Boolean functions. If you
select Ratio of 2 Channels, the Calibrate Channel button will become the Configure Ratio
button. If you select Formula, the Calibrate Channel button will become the Edit Formula
button.
Sample
Specifies a time during the experimental acquisition cycle when a virtual channel is to
receive analog data. You can acquire before or after the entire acquisition cycle.
Alternatively, you can acquire before, during, or after the acquisition period for
Wavelength 1, 2, or 3. Finally, you can acquire asynchronously (not associated with a
particular time in the acquisition cycle) throughout the experiment. If you choose
Asynchronously, an additional option, Sampling Frequency, will appear, allowing you to
specify the rate of acquisition in Hz. Asynchronous sampling can accommodate
continuous rates of up to 10 kHz, with a maximum rate of up to 50 kHz.
Note: If you select Asynchronously, you will not be able to send the data to a log file.
Instead, you should save your data to a binary Save file.
Graph Data
Selecting this check box allows data from the currently selected virtual channel to be
displayed in a real-time, on-screen graph.
Configure Graph
Opens the Configure Graph dialog box, from which you can specify graph titles, labels,
ranges, and the number of tick marks.
Log Data
Selecting this check box allows the data from the currently selected virtual channel to be
logged to a text-based log file or by Dynamic Data Exchange to an open spreadsheet.
Configure Log
Opens the Configure Log dialog box, allowing you to specify a title and numeric format for
the analog data column in the log file.
Save Data
MetaFluor
489
Version 7.0
MetaFluor User’s Guide
Selecting this check box allows the data from the currently selected virtual channel to be
saved to a binary (*.bin) Save file. Data saved in this format can be replayed at a later
time for offline analysis. This option will be unavailable for virtual channels configured for
representation of a ratio between two analog input channels.
Configure Save
Opens the Configure Save dialog box, allowing you to select, rename, or delete a Save
file.
Calibrate Channel
Opens the Calibrate Channel dialog box, allowing you to calibrate the analog signal of a
virtual channel. Even if a previous virtual channel has been associated with particular
physical channel (selected in the Measure drop-down list) and the calibration procedure
has been performed, selection of a different virtual channel for that same physical
channel will still require that the calibration procedure be performed once again.
Configure Ratio
If you select Ratio of 2 Channels from the Measure drop-down list, the Calibrate Channel
button will become the Configure Ratio button. This button opens the Configure Ratio
dialog box, from which you can select a pair of channels, one representing the
"numerator" and the other the "denominator."
Edit Formula
If you select Formula from the Measure drop-down list, the Calibrate Channel button will
become the Edit Formula button. This button opens the Edit Formula dialog box, from
which you can create an equation involving any combination of data channels, arithmetic
operators, constant values, logical operators, or Boolean functions. The value of the
formula will be calculated and plotted on the analog measurements graph just as if it
were data from a physical data channel. This flexibility allows you, for example, to
perform shading correction and background subtraction on each of two Wavelength
inputs and then plot the ratio of the two sets corrected images.
Close
Closes the dialog box.
MetaFluor
490
Version 7.0
MetaFluor User’s Guide
Configure Log - Dialog Box Options
Column Title
Specifies a title for the analog data column.
Description
Allows a brief description of the analog data, to be displayed next to the Column Title.
Data Format
Allows the configuration of the digits displayed in the analog data column. Each "#"
symbol corresponds to a digit. For example, the format "##.##" will cause the number
6.437 to be displayed as 6.44. Leading 0's are not printed.
OK
Accepts the data log configuration and closes the Configure Log dialog box.
Cancel
Rejects the data log configuration and closes the Configure Log dialog box.
MetaFluor
491
Version 7.0
MetaFluor User’s Guide
Configure Save - Dialog Box Options
Select Save File
Opens the Select Save File dialog box, allowing you to enter a name for a new Save file
or to select an existing file to which data will be appended.
File Status
This status line indicates whether a file already exists and that data will be appended to it,
or if the file does not exist and will be created.
Rename Existing File
Opens the Rename dialog box, allowing you to rename an existing Save file by typing a
new name in the New Filename text box.
Delete Existing File
Allows you to delete an existing Save file. If you choose Delete Existing File, a dialog box
will appear, asking for confirmation.
Close
Closes the Configure Save dialog box.
MetaFluor
492
Version 7.0
MetaFluor User’s Guide
Configure Ratio - Dialog Box Options
Ratio =
The upper and lower drop-down lists select data channels for the numerator and
denominator, respectively, to be ratioed and plotted in the analog measurements graph.
OK
Accepts the configured ratio and closes the dialog box.
Cancel
Ignores the configuration and closes the dialog box.
MetaFluor
493
Version 7.0
MetaFluor User’s Guide
Edit Formula - Dialog Box Options
Enter a Formula… (text box)
This box is used for creating an expression using any combination of data channels,
constant values, arithmetic or logical operators, or Boolean functions. The equation will
be calculated and plotted in the analog measurements graph, just as if it represented
"raw" data being acquired by a physical data channel.
Evaluate Formula
Checks the entered formula for validity. The status line next to this button provides
feedback from the evaluation.
OK
Accepts the configured formula and closes the dialog box.
Cancel
Rejects the formula and closes the dialog box.
MetaFluor
494
Version 7.0
MetaFluor User’s Guide
Analog Display (Analog Menu)
Configures the display of analog data graphs.
Drop-in: DAC
Each virtual analog data channel has its own associated graph. This can result in up to 16
graphs appearing simultaneously on your screen. This command allows you to show or hide
analog data graphs during an experiment. You can also use this command to clear a graph or
to reconfigure its X or Y axis. Configuring the X-axis will affect all displayed virtual channel
graphs.
QUICK TIP: You can hide and redisplay the analog measurements graphs by choosing Show
or Hide Graphs from the Windows menu or by using the keyboard shortcut, the [F8] function
key.
See Also:
Installing Drop-ins Using the Meta Imaging Series Administrator
Configure Graphs
MetaFluor
495
Version 7.0
MetaFluor User’s Guide
Configuring the Analog Display
To configure the display of your analog data graphs, use the following procedure.
Note: You can also hide and redisplay the analog data graphs by choosing Show or Hide
Graphs from the Windows menu or by using the keyboard shortcut, the [F8] function key.
Step
Action
1
From the Analog menu, choose Analog
Display. The Analog Display dialog box will
appear.
2
From the Analog Channel drop-down list,
select the virtual channel associated with the
graph you want to configure.
3
If you want to hide the graph from view during
the experiment or during playback, choose
Hide Graph.
OR
If you decide to display a graph after hiding it,
you can choose Show Graph. This action will
not affect the data being acquired and stored.
4
If you want to erase all the data points on a
graph, choose Clear Graph.
5
If you want to reconfigure the Y-axis of a
graph, choose Config Y Axis. The Configure
Graph dialog box will appear. Enter any
changes you want to make to the graph title or
Y-axis label, range, or tick marks. Choose OK
when you have finished.
6
Repeat Steps 2 - 5 for each channel.
7
If you want to reconfigure the X-axis, choose
Config X Axis. The Configure Graphs dialog
box will open. Enter the desired X-axis units
and range in the Time and Range boxes,
respectively, and choose OK.
8
When you have finished, choose Close.
MetaFluor
496
Version 7.0
MetaFluor User’s Guide
Analog Display - Dialog Box Options
Analog Channel
Selects the channel to be associated with an analog data graph.
Show Graph
Enables the display of the selected graph.
Hide Graph
Disables the display of the selected graph. This will not affect the data being acquired
and stored.
Clear Graph
Erases all the data points plotted on a graph.
Config Y Axis
Opens the Configure Graph dialog box, allowing you to change the title of the graph or
the Y-axis label, range, or tick marks. This is the same dialog box as is seen when
Configure Graph is chosen from the Configure Analog Measurements dialog box.
Config X Axis
Opens the Configure Graphs dialog box, allowing you to change the X-axis units and
range. This is the same dialog box as appears when you choose Configure Graphs from
the Graphs menu. By default, Graph 2 will be the active graph selected for configuration
from the Graph drop-down list. Any changes you make will affect all displayed virtual
channel graphs.
Close
Closes the Analog Display dialog box.
MetaFluor
497
Version 7.0
MetaFluor User’s Guide
Analog Async Status (Analog Menu)
Toggles the active/inactive state of an asynchronously sampling analog data
channel.
Drop-in: DAC
Use this command to control whether a virtual analog data channel, running in asynchronous
mode, is actively acquiring data during an experiment. By default, asynchronously sampling
virtual analog channels will measure data as long as a MetaFluor experiment is running. The
dialog box that appears when you choose Analog Async Status will allow you to turn such
sampling on or off.
See Also:
Installing Drop-ins Using the Meta Imaging Series Administrator
Defining Virtual Analog Measurements Channels
MetaFluor
498
Version 7.0
MetaFluor User’s Guide
Controlling Analog Async Status
To use the Analog Async Status control dialog box, use the following procedure:
Step
Action
1
From the Analog menu, choose Analog Async
Status. The Analog Async Status dialog box
will appear.
2
Sixteen check boxes will be seen,
corresponding to the 16 virtual channels.
While a check box is selected, that channel
will actively measure data.
To stop a channel from gathering data, clear
its check box with a mouse click.
To switch an inactivated channel back on,
reselect its check box with another click.
(Channels which are not acquiring in
asynchronous mode will have their check
boxes dimmed.)
3
When you have finished, choose Close.
MetaFluor
499
Version 7.0
MetaFluor User’s Guide
Analog Async Status - Dialog Box Options
Virtual Channel Check Boxes
Selecting a channel's check box permits that channel to acquire data, while clearing its
check box stops that channel from acquiring data. Channels that are not running in
asynchronous mode will have their check boxes dimmed.
Close
Closes the dialog box.
MetaFluor
500
Version 7.0
MetaFluor User’s Guide
Replay Stored Data (Analog Menu)
Allows you to replay analog data which was stored in binary format in a Save file
(*.bin).
Drop-in: DAC
Use this command to select a previously saved experiment in a Save file for offline playback
of analog data.
Note: You must first open the experiment by selecting its associated Information file (*.inf).
See Also:
Installing Drop-ins Using the Meta Imaging Series Administrator
Configuring the Analog Measurements Save File
MetaFluor
501
Version 7.0
MetaFluor User’s Guide
Replaying Stored Analog Measurement Data
To replay stored analog measurement data, use the following procedure:
Step
Action
1
From the Analog menu, choose Replay Stored
Data. The Replay Data dialog box will appear.
2
Choose Select Data File. The Select File
dialog box will open.
3
Select the icon for the Save file (*.bin) that you
want to open. If the file is not displayed, use
the Look In drop-down list box or Up One
Level button to locate the correct drive and
folder. Then choose Open. The Select File
dialog box will close.
When you have selected a data file, all of the
experiments that have been stored in it will be
displayed in the Experiments List. If Analog
Measurements data have been stored in an
experiment, this will be indicated in the second
column by the acronym DAC, and the virtual
channels that were active will be listed.
4
Select an experiment from the Experiments
List.
5
Choose OK. The Replay Data dialog box will
close and the analog data will be replotted on
the analog measurements graphs.
MetaFluor
502
Version 7.0
MetaFluor User’s Guide
Replay Stored Data - Dialog Box Options
Select Data File
Opens the Select File dialog box, allowing you to select a Save file (*.bin) for playback of
one of its experiments.
Experiments in Data File
This column in the Experiments List displays the date and time of each experiment that
was saved in the Save file. These are obtained from the timestamp at the time the New
Experiment command was invoked for the experiment.
Contents
This column in the Experiments List displays the data that have been stored in the
experiment. If analog measurements data were stored in the experiment, this will be
indicated by the acronym DAC, and the virtual channels that were active will be listed.
OK
Accepts the selected experiment for playback.
Cancel
Cancels the command.
MetaFluor
503
Version 7.0
MetaFluor User’s Guide
Convert Data File to Text File (Analog Menu)
Converts experimental data from binary format to text format.
Drop-in: DAC
Use this command to convert experimental data from a Save file (*.bin) into readable, commadelimited text, which is then saved to a text file (*.txt). This conversion could take several
minutes if the binary file is large.
See Also:
Installing Drop-ins Using the Meta Imaging Series Administrator
MetaFluor
504
Version 7.0
MetaFluor User’s Guide
Converting Analog Measurement Data Files to
Text Files
To convert analog measurement data files to text files, use the following procedure:
Step
Action
1
From the Analog menu, choose Convert Data
File to Text File. The Convert Data File to Text
File dialog box will appear.
2
Choose Select Data File. The Select File
dialog box will appear.
3
Select the icon for the Save file (*.bin) that you
want to convert to text format. If the file is not
displayed, use the Look In drop-down list box
or Up One Level icon button to locate the
correct drive and folder. Then choose Open.
The Select File dialog box will close.
4
Select an experiment from the Experiment List
Box.
5
Choose Select Text File. The Select File
dialog box will open.
6
In the File Name list, type the name of the text
file to be used to store the data. Then choose
Save. The Select File dialog box will close.
7
Choose OK. The Convert Data File to Text File
dialog box will close and the binary format
data from the Save file will be converted to text
format.
MetaFluor
505
Version 7.0
MetaFluor User’s Guide
Convert Data File to Text File - Dialog Box Options
Select Data File
Opens the Select File dialog box, allowing you to select a Save file (*.bin) for conversion
to text format.
Experiments in Data File
This column in the Experiments List displays the date and time of each experiment that
was saved in the Save file. These are obtained from the timestamp at the time the New
Experiment command was invoked for the experiment.
Contents
This column in the Experiments List displays the data that have been stored in the
experiment. If analog measurements data were stored in the experiment, this will be
indicated by the acronym DAC, and the virtual channels that were active will be listed.
Select Text File
Opens the Select File dialog box, allowing you to select a text file (*.txt) for conversion of
experimental data from binary format.
OK
Accepts the selected experiment for conversion to text format.
Cancel
Cancels the command.
MetaFluor
506
Version 7.0
MetaFluor User’s Guide
Help Menu
MetaFluor
507
Version 7.0
MetaFluor User’s Guide
Updates History (Help Menu)
Displays a history of all of the updates that have been downloaded to your imaging
system.
Use this command to read a list of the updates and program "patches" that have been
downloaded to the imaging program. The Updates History dialog box displays a table listing
the update or patch ID code, the date it was created, and the date it was installed on the
computer.
EXAMPLE: "T10148,01/01/98,03/05/98" indicates that a patch with the code "T10148" and
having a creation date of January 1, 1998, was installed on March 5, 1998.
MetaFluor
508
Version 7.0
MetaFluor User’s Guide
Updates History - Dialog Box Options
History Table
Displays a list of all updates and patches that have been installed.
OK
Closes the dialog box.
MetaFluor
509
Version 7.0
MetaFluor User’s Guide
Reading Your Updates History
To read a list of the updates and patches that you have downloaded to your imaging
system, use the following procedure:
Step
Action
1
From the Help menu, choose Updates
History. The Updates History dialog box will
appear.
2
The dialog box displays a table that lists all
updates and patches that have been
installed.
EXAMPLE: "T10148,01/01/98,03/05/98"
indicates that a patch with the code "T10148"
and having a creation date of January 1,
1998, was installed on March 5, 1998.
3
When you have finished reading the list,
choose OK to close the dialog box.
MetaFluor
510
Version 7.0
MetaFluor User’s Guide
Basic Tools
MetaFluor
511
Version 7.0
MetaFluor User’s Guide
Dialog Boxes
Dialog boxes are displayed in MetaFluor whenever it is necessary to request
information about a command or task to be performed or to supply you with
information.
Commands which display a dialog box are marked with an ellipsis (". . .") in their respective
MetaFluor menus. An ellipsis is also used on command buttons in dialog boxes that open
secondary dialog boxes.
Most MetaFluor dialog boxes use options and command buttons that are similar to those used
in many Windows-based applications. An option can be selected by positioning the pointer
over it and clicking the left mouse button. If you want to use the keyboard, you can press the
[Tab] key to move forward (left to right, top to bottom) to the next area within the dialog box.
The cursor (Arrow) keys can be used to move between options in a group box.
Typical Dialog Box Options
Dialog boxes often have an OK button, a Close button, or another command button that
closes the dialog box while completing the command. Some, however, use the Close button
found in the dialog box's upper right corner. Clicking the Close button automatically closes the
dialog box. To cancel a command, choose Cancel from the dialog box or press the [Esc] key.
TIP: To bring otherwise obscured dialog boxes to the "top" of your workspace display, use the
Bring Dialogs to Front command (Windows menu), or use its keyboard shortcut, [CTRL] + [D].
This command is best used to bring the Experiment Control Panel to the front.
Selecting Files from Standard Dialog Boxes That Open and Save Files
Many MetaFluor dialog boxes that open and save files share a design common to many
Windows-based programs. Once you have learned how to use these options for one dialog
box, such as the one used by the Open command, you will have learned how use the options
for many dialog boxes.
Selecting the Drive
Selecting the File's Directory
Selecting the File Type
Selecting the File
MetaFluor
512
Version 7.0
MetaFluor User’s Guide
Icon Toolbar
This ribbon of command icons offers a quick and convenient way to carry out frequently used
commands for MetaFluor's acquisition or playback modes. You can still access these
commands directly from the menu if you wish.
The Icon Toolbar is displayed in one of three modes. When you first start MetaFluor, a "start
up" toolbar is shown. Click on the icons for a description of each their functions:
When you start a new experiment, the following Icon Toolbar will be displayed. Click on the
icons for a description of each their functions:
When you open a previously stored experiment for playback, a different set of icons will be
displayed. Click on the icons for a description of each their functions:
Shortcut: CTRL + T
MetaFluor
513
Version 7.0
MetaFluor User’s Guide
Using Image Window Tools
MetaFluor
514
Version 7.0
MetaFluor User’s Guide
Image Window Toolbar
Each image window has its own Image Window Toolbar, located on the left side of the
image window, which consists of tools that operate only within that particular image
window. All of the tools listed below are available for 8-bit and 16-bit images. The Zoom
and Histogram Tools are the only tools available for working with a binary (1-bit) image.
Note: You can hide the Image Window Toolbar by right-clicking in the image window and
choosing Hide Image Window Toolbar from the pop-up context menu that appears. The
command will change to Show Image Window Toolbar. To display the toolbar once
again, simply right-click again and choose Show Image Window Toolbar.
Zoom Tool
Histogram Tool
Display Mode Tool
Contrast Tool and Slider
Palette Tool
Threshold Tool and Slider
MetaFluor
515
Version 7.0
MetaFluor User’s Guide
Zoom Tool (Image Window Toolbar)
The Zoom Tool provides eight levels of magnification ranging from 25 to 800
percent.
Use this tool to increase or decrease the magnification for the current image. You can select
25, 33, 50, 75, 100, 150, 200, 400, or 800 percent magnification. If you increase the
magnification to 150 percent or more, you can use the Zoom Tool's "magnifying glass" pointer
to select and directly zoom into a specific area of interest.
You can also use the keyboard shortcuts to increase or decrease the magnification level of the
active image window. Press the appropriate shortcut key listed below until you reach the
desired magnification level.
Shortcuts:
Increase magnification = [PgUp]
Decrease magnification = [PgDn]
MetaFluor
516
Version 7.0
MetaFluor User’s Guide
Using the Zoom Tool
To use the Zoom Tool to increase or decrease the magnification in an image, use the
following procedure:
Step
Action
1
Select the Zoom Tool by clicking it using the
left mouse button.
2
Choose one of the following magnification
levels from the pop-up menu that appears:
25%, 33%, 50%, 75%, 100%, 150%, 200%,
400%, or 800%. (A check mark indicates the
currently chosen zoom level.)
3
If you chose 150%, 200%, 400%, or 800%, the
pointer will change to a magnifying glass.
Position the magnifying glass over the center
of the area you want to magnify and click.
4
MetaFluor will increase or decrease the
magnification.
MetaFluor
517
Version 7.0
MetaFluor User’s Guide
Histogram Tool (Image Window Toolbar)
The Histogram Tool displays a distribution of an image's grayscale values.
Use this tool when you want to see a visual representation of the distribution of an image's
grayscale values. A typical histogram is shown below.
In addition to creating histograms of 8-bit images, you can create histograms of 16-bit images.
Note: If you set the grayscale histogram scaling and axis range for an image with its
Histogram Tool, this will update the settings for the selected wavelength in the Scale 16-Bit
Images dialog box (if autoscaling has been disabled).
Click the numeric labels and the graph bars in the picture to read a brief description about
each item's function.
Configuring the Histogram Settings
Hiding the Histogram Labels
Using Show Highlight Bars
Highlighting Under Bars
Highlighting Between Bars
Turning On Area as Percentage
Turning On Apply LUT to Graph
Scaling Between Bars
Using the Histogram Commands
Stretching an Image's LUT (8-bit)
Scaling an Image (16-bit)
Setting the Histogram's X-Axis
MetaFluor
518
Version 7.0
MetaFluor User’s Guide
Resetting the Histogram's X-Axis
MetaFluor
519
Version 7.0
MetaFluor User’s Guide
Using the Histogram Tool
To open and use an image's histogram, use the following procedure:
Step
Action
1
Select the Histogram Tool by clicking it using
the left mouse button. The image's histogram
will appear.
2
Move the blue or red Highlight Bar (located at
the edges of the histogram) to display the
grayscale value for the histogram currently
below the selected bar. The number of pixels
in the image with that grayscale value will also
be displayed.
You can move each bar independently by
dragging the desired bar with the left mouse
button. To move them simultaneously, hold
down the [SHIFT] key while dragging the
pointer.
MetaFluor
520
Version 7.0
MetaFluor User’s Guide
Display Mode Tool (Image Window Toolbar)
The Display Mode Tool allows you to select the Monochrome, Pseudocolor, or a
user-defined display mode look-up table (LUT) for an image.
Use this tool to switch between the image's two default look-up tables, Monochrome and
Pseudocolor. The Monochrome look-up table is a black and white grayscale display mode.
The Pseudocolor look-up table is an arbitrarily assigned color display mode. Or you can use
the Configure LUT option in the tool's pop-up menu to configure, save, and apply your own
look-up table for use with the image.
Click the Procedure button above to select from a list of Display Mode Tool procedures.
MetaFluor
521
Version 7.0
MetaFluor User’s Guide
Selecting a Display Mode
To select a display mode, use the following procedure:
Step
Action
1
Select the Display Mode Tool by clicking it
using the left mouse button.
2
Choose Monochrome or Pseudocolor from the
pop-up menu to use one of the standard
MetaFluor display modes. The check mark
indicates the active display mode.
OR
Select a previously loaded user-defined lookup table from the pop-up menu.
3
MetaFluor will switch to the selected display
mode.
MetaFluor
522
Version 7.0
MetaFluor User’s Guide
Loading an Existing LUT
To load an existing look-up table, such as one of the sample LUTs provided with
MetaFluor, use the following procedure:
Step
Action
1
Select the Display Mode Tool by clicking it
using the left mouse button. A pop-up menu
will appear.
2
Choose Configure LUT. The Define User LUT
dialog box will appear.
3
Choose Load. The Load LUT File dialog box
will appear.
4
Select the icon for the desired file. Use the
Look In drop-down list box or Up One Level
icon button to select the desired folder if
necessary.
5
Choose Open. The Load LUT File dialog box
will close.
6
The newly loaded LUT will appear in the LookUp Table Mode List Box on the left side of the
Define User LUT dialog box. (It will also
appear in the Display Mode Tool pop-up menu
as a menu item.)
Refer to Selecting a Display Mode for more
information about selecting the active look-up
table.
MetaFluor
523
Version 7.0
MetaFluor User’s Guide
Configuring the Display Mode
To configure the display mode using the Configure LUT option, use the following
procedure:
Step
Action
1
Select the Display Mode Tool by clicking it
using the left mouse button. A pop-up menu
will appear.
2
Choose Configure LUT. The Define User LUT
dialog box will appear.
3
Select the look-up table that you want to
configure from the Look-Up Table Mode List
Box on the left side of dialog box.
4
If you want to change the quantization of the
image, type the desired value in the
Quantization text box.
5
If you want to invert a look-up table, select
Invert.
6
If you want to use a sawtooth grayscale,
select Contour.
7
Subtract determines how MetaFluor displays
pixels when the Adjust Digital Contrast
command causes them to display the value for
intensities less than zero.
When deselected, Subtract will direct
MetaFluor to clip the gray levels of the pixels
and display the value for the intensity zero
(this is the default setting).
Select Subtract to "wrap around" the gray
values and display the value for the difference
of the image window's maximum intensity and
the intensity produced by Adjust Digital
Contrast.
8
When you have finished configuring the lookup table, you can choose Save to save it. The
Save LUT File dialog box will appear. Type a
file name in the File Name text box and
choose Save.
MetaFluor
524
Version 7.0
MetaFluor User’s Guide
Defining a User LUT
To define a new look-up table, use the following procedure:
Step
Action
1
Select the Display Mode Tool by clicking it
using the left mouse button. A pop-up menu
will appear.
2
Choose Configure LUT. The Define User LUT
dialog box will appear.
3
Choose Create. A new LUT named User0 will
appear in the Look-Up Table Mode List Box.
Red, Green, Blue, Upper, and Lower will
become available.
4
Choose the < command button on the right
side of the dialog box to open the LUT graph.
The X-axis values of the graph are the "Input,"
while the Y-axis values are the "Output."
If the user LUT is based on a monochrome
LUT, only one of the three scan lines will be
visible.
5
Select the desired starting and ending look-up
table addresses to be modified using Lower
and Upper.
You can select the entire range or you can
select smaller ranges, leaving existing values
for other parts of the look-up table intact.
6
The intensity for the red, green, and blue
components for the selected range of
addresses can be editing by enabling the color
component(s) you want to edit using the Red,
Green, and Blue check boxes. You can
disable any component you do not want to
edit.
AND
For each of the selected components, select a
starting value and an ending value using the
text boxes next to Red, Green, and Blue. (If
you know the color for the range, rather than
the values, you can select the desired color
from the Color drop-down list and the
appropriate values will appear in the starting
and ending value text boxes.)
7
Choose Apply to apply the edited look-up table
to the image.
(You can repeat Steps 4 - 6 as necessary.)
8
If you want to save the custom look-up table
on disk for future use, choose Save. Type the
desired file name in the File Name text box
and choose Save.
MetaFluor
525
Version 7.0
MetaFluor User’s Guide
MetaFluor
526
Version 7.0
MetaFluor User’s Guide
Contrast Tool and Slider (Image Window Toolbar)
The Contrast Tool allows you to autoenhance, reset, or fix the contrast of an
image. The Slider, in its default state, allows you to adjust the overall brightness of
an image and expand the range of grayscale levels displayed in an image.
Use the Contrast Tool when you want to perform one of the three tasks in the Contrast Tool's
pop-up menu: Auto Enhance, Reset Contrast, or Fix Contrast:
Auto Enhance adjusts the contrast by performing a grayscale stretch on only those
grayscale levels that are contained in the image's histogram.
Reset Contrast resets the contrast to the default settings of Contour = OFF, Invert = OFF,
Quantization = 255, Brightness = 50, and Contrast = 50.
Fix Contrast changes the pixel gray values in the image permanently, based the image's
new LUT values. This feature does not affect 16-bit images.
When the Threshold Tool is in the "Thresholding Off" mode, the slider in the Image Window
Toolbar can be used to adjust image brightness and contrast. Dragging with the left mouse
button while the Contrast Pointer is over the slider adjusts the overall brightness of the image.
Dragging with the right mouse button adjusts the range of grayscale levels displayed, thereby
changing contrast. (Contrast can only be increased, never decreased, relative to the original
image state.)
See Also:
Histogram Tool
MetaFluor
527
Version 7.0
MetaFluor User’s Guide
Using the Contrast Tool
To use the Contrast Tool, use the following procedure:
Step
Action
1
Select the Contrast Tool by clicking it using the
left mouse button.
2
Select one of the following options from the
pop-up menu that appears: Auto Enhance,
Reset Contrast, or Fix Contrast.
3
If you choose Fix Contrast for a stack, a dialog
box will appear:
If you want to fix the contrast for all planes,
choose Yes.
OR
If you want to fix the contrast for the current
plane, choose No.
MetaFluor
528
Version 7.0
MetaFluor User’s Guide
Using the Contrast Slider
To adjust the brightness and contrast with the Contrast Slider, use the following
procedure:
Step
Action
1
Position the pointer over the Contrast Slider so
that it changes from the Arrow Pointer to the
Contrast Pointer.
2
To adjust the brightness of the image, drag the
mouse up or down using the LEFT mouse
button until you have found the desired
contrast setting.
Note: This will only affect an image's LUT.
You must choose Fix Contrast if you want to
alter the image data permanently.
3
To expand the contrast range, drag the mouse
up using the RIGHT mouse button until you
have found the desired contrast setting. (You
will not be able to decrease the contrast in an
image beyond the original state.)
Note: This will only affect an image's LUT.
You must choose Fix Contrast if you want to
alter the image data permanently.
Expanding the contrast reduces the number of
grayscale levels that you will see in the image
at one time (the number of grayscale levels
actually available stays the same) but
increases the perceived contrast of the image.
MetaFluor
529
Version 7.0
MetaFluor User’s Guide
Palette Tool (Image Window Toolbar)
The Palette Tool selects the number of grayscale levels used for displaying an
image.
Use this tool when you want to change the number of palette entries used for displaying an
image. A palette is a fixed number of colors that can be rendered at any one time in the
display. The default setting for MetaFluor is 64 Palette Entries.
The number of images that you can display on the desktop can be increased if each image
uses fewer palette entries. However, color images tend to look better with the maximum
possible number of palette entries.
The setting for palette entries affects only the number of gray levels or colors used for display;
it does not change the bit-depth or actual grayscale values of the image pixels.
MetaFluor
530
Version 7.0
MetaFluor User’s Guide
Using the Palette Tool
To use the Palette Tool, use the following procedure:
Step
Action
1
Select the Palette Tool by clicking it using the
left mouse button. A pop-up menu will appear.
2
Choose one of the following palettes from the
menu:
2 Palette Entries,
16 Palette Entries,
32 Palette Entries,
64 Palette Entries,
128 Palette Entries, or
236 Palette Entries.
(A check mark will indicate the current palette
selection.)
3
MetaFluor will change the palette selection.
MetaFluor
531
Version 7.0
MetaFluor User’s Guide
Threshold Tool and Slider
MetaFluor
532
Version 7.0
MetaFluor User’s Guide
Threshold Tool and Slider (Image Window
Toolbar)
Creates a boundary between the objects being measured and other parts of an
image on the basis of an image's gray levels.
Some measurement commands require that a distinction in the form of a boundary be made
between the objects being measured and other parts of an image (referred to as image
"segmentation," or "thresholding"). The Threshold Tool allows you to create a boundary on the
basis of the image's gray levels. The Threshold Tool displays a menu that provides four
choices:
(1) Inclusive, with gray values between the lower and upper threshold limits included in the
measurement. Pixels with gray values outside of the lower and upper threshold limits will
be highlighted by a black overlay (and again excluded from measurement).
(2) Exclusive, with gray values between the lower and upper threshold limits excluded from
measurement. Pixels with gray values within this range will be marked in the image with a
black overlay.
(3) Off.
(4) Auto Threshold, which applies an inclusive threshold to what MetaFluor perceives to be
the objects in the image. This uses a sophisticated algorithm for analysis of a grayscale
histogram, measuring the "peaks" at the brighter end of the histogram to select the
threshold range. Autothresholding of 24-bit color images uses the Intensity channel.
When thresholding is enabled, the Contrast Slider will change to become the Threshold Slider,
and will include a draggable Low Threshold Arrow and High Threshold Arrow. The Threshold
Tool button will indicate the current thresholding status. The button displays three bars
representing the three states of the Threshold Slider, with a small wedge-shaped arrow under
the bar that corresponds to the current state. When thresholding is disabled, the slider will
revert to its status as the Contrast Slider, and can be used to adjust the brightness and
contrast of the image.
MetaFluor
533
Version 7.0
MetaFluor User’s Guide
Using the Threshold Tool and Slider
When the Threshold Tool is in one of the "On" modes, the slider in the Image Window
Toolbar will change to a Threshold Slider, allowing you quickly to set the threshold range.
To use the slider to threshold an image, use the following procedure.
Note: Moving a threshold arrow toward a new value that is past the second threshold
arrow will automatically cause both arrows to select the new value.
Step
1
Action
By default, images are initially displayed in
Exclusive mode. Select the Threshold Tool by
clicking it using the left mouse button. A
secondary menu will appear, providing you
with four choices:
Inclusive,
Exclusive,
Off, and
Auto Threshold.
2
Choose one of the options, as appropriate to
your needs.
Note: For 24-bit color images, it is best to use
the Auto Threshold mode, rather than the
Inclusive or Exclusive modes.
3
If you chose Inclusive in Step 2, the Threshold
Tool button will be displayed with the wedgeshaped arrow pointing to the middle bar. If you
are thresholding a wavelength image, a black
thresholding overlay will cover the entire
image, indicating that all pixel values are
included for measurement. If you are
thresholding a ratio image, the overlay will be
red.
Drag the lower arrow in the slider up to select
a lower threshold gray value limit so that the
background areas are free of the overlay.
AND
Drag the upper arrow in the slider to select an
upper threshold gray value limit that removes
the thresholding overlay from any bright
background areas.
Readjust the lower threshold setting if
necessary.
4
If the image is in Exclusive mode (the default
state), the Threshold Tool button will be
displayed with the wedge-shaped arrow
pointing to the rightmost bar, and the image
will be uniformly covered by the black
thresholding overlay (red in ratio images),
because the gray level range has not yet been
selected.
Drag the lower arrow in the slider upward to
select a lower threshold gray value limit so that
MetaFluor
534
Version 7.0
MetaFluor User’s Guide
the background is covered with the black
thresholding overlay.
AND
Drag the upper arrow in the slider to select an
upper threshold gray value limit as needed.
5
If you chose Off in Step 2, any previously
displayed thresholding will be removed.
6
If you chose Auto Threshold in Step 2,
MetaFluor will perform an analysis of the
intensity values in the image and then select a
threshold range automatically.
MetaFluor
535
Version 7.0
MetaFluor User’s Guide
Using Region Tools
MetaFluor
536
Version 7.0
MetaFluor User’s Guide
Region Toolbar
Click each tool in the picture of the
Region Toolbar to read a brief description of the tool and to jump to a more detailed
discussion on how to use it.
The Region Toolbar consists of tools to create and manipulate regions of interest in an
image. MetaFluor defines a region of interest with a colored region outline, which, when
selected is a dotted, blinking boundary.
Note: Regions drawn with a two-dimensional Region Tool (Rectangular, Ellipse, Trace,
or Auto-Trace) must be at least 2x2 in size to be valid in MetaFluor.
Click the name of one of the Region Tools in the following list to learn more about its use.
The Region Tools include:
Locator Tool,
Rectangular Region Tool,
Ellipse Region Tool,
Trace Region Tool,
Single Line Tool,
Multi-Line Tool,
Traced Line Tool, and
Auto-Trace Region Tool.
The status bar below the tools indicates which tool is currently active. This area also
displays the coordinates and size of the region that you are creating or editing. For
irregularly shaped regions, a "bounding rectangle" is placed over the region, and the
coordinates of its upper left corner are given.
Opening the Region Toolbar
Moving the Region Toolbar
Closing the Region Toolbar
Changing the Color of a Region's Outline
Copying a Region Outline
Shrinking a Region Outline to Fit an Object
MetaFluor
537
Version 7.0
MetaFluor User’s Guide
Shrinking a Region Outline Using a Three-Button Mouse
Configuring Region Toolbar Tools
The Down Arrow button next to the status bar opens a pull-down configuration menu
which you can use to configure default colors, sizes, and positions for regions, as well the
default behavior of the Locator Tool.
Configuring the Default Behavior for Region Tools
Configuring the Default Color for Regions
Locking Region Positions
Locking Region Sizes
Setting Default Region Size
MetaFluor
538
Version 7.0
MetaFluor User’s Guide
Region Tools
MetaFluor
539
Version 7.0
MetaFluor User’s Guide
Locator Tool (Region Toolbar)
The Locator Tool is the default tool in the Region Toolbar.
Use this tool to select, move, resize, edit, and delete regions. When you select the Locator
Tool, the pointer will look like an arrow.
Click the Procedure button above to select from a list of Locator Tool procedures.
Note: Regions drawn with a two-dimensional Region Tool (Rectangular, Ellipse, Trace, or
Auto-Trace) must be at least 2x2 in size to be valid in MetaFluor.
MetaFluor
540
Version 7.0
MetaFluor User’s Guide
Selecting a Region as the Active Region
To select a region as the active region, use the following procedure:
Step
1
Action
Place the pointer inside the desired region.
If you are selecting a line region, "inside" the
region is within five pixels or less from any
point on the line.
2
Press the left mouse button.
The region's outline will change from a solid
line to a dotted line to indicate that it is the
active region.
MetaFluor
541
Version 7.0
MetaFluor User’s Guide
Deselecting the Active Region
To deselect the active region, use the following procedure:
Step
Action
1
Place the pointer outside the active region.
2
Press the left mouse button.
The region's outline will change from a dotted
line to a solid line to indicate that it is no longer
active.
MetaFluor
542
Version 7.0
MetaFluor User’s Guide
Editing the Shape of a Region
To edit the shape of a region, use the following procedure:
Step
Action
1
Place the pointer inside the desired region.
2
Double-click the left mouse button.
Round region handles will appear.
3
To edit the region, drag the individual round
handles to the desired locations.
MetaFluor
543
Version 7.0
MetaFluor User’s Guide
Deleting a Region
To delete a region, use the following procedure:
Step
Action
1
Place the pointer inside the desired region.
2
Press the right mouse button and choose
Delete Region from the pop-up context menu
that appears.
OR
Hold down the [SHIFT] key and press the right
mouse button.
3
The region will be deleted.
MetaFluor
544
Version 7.0
MetaFluor User’s Guide
Moving the Pointer Using Keystrokes
To move the pointer using keystrokes, press the arrow keys on the keyboard to move the
pointer in the desired direction.
MetaFluor
545
Version 7.0
MetaFluor User’s Guide
Moving a Closed Region
To move a closed region, use the following procedure:
Step
Action
1
Place the pointer inside the desired region.
2
Drag the pointer using the left mouse button.
3
Release the mouse button when the pointer is
at the new location. The region outline will
move to the location.
MetaFluor
546
Version 7.0
MetaFluor User’s Guide
Moving a Line Region
To move a line region drawn with any of the line region tools, use the following
procedure:
Step
Action
1
With the Locator Tool, click the line region
once to make it the active region.
2
Place the pointer over the line.
3
Hold down the left button of your mouse and
drag the line to the desired position. Then
release the mouse button.
MetaFluor
547
Version 7.0
MetaFluor User’s Guide
Displaying a Region's X and Y Coordinates,
Width, and Height
To display a region's location, use the following procedure:
Step
Action
1
Place the pointer inside the desired region.
2
Press the left mouse button.
The Region Toolbar status line will display
"Region: (left, top)" to indicate the location of
the region's top left corner. If the region is
elliptical, the coordinates of its central point will
be displayed. If the region has an irregular
shape, its top left corner will be determined by
bounding the object with a rectangular box.
MetaFluor
548
Version 7.0
MetaFluor User’s Guide
Resizing a Rectangular or Elliptical Region
To resize a rectangular or elliptical region, use the following procedure:
Step
Action
1
Place the pointer above the edge or corner of
region's outline.
2
When the pointer changes to a double-headed
arrow cursor, drag the region outline. Regions
drawn with a two-dimensional Region Tool
(Rectangular, Ellipse, Trace, or Auto-Trace)
must be at least 2x2 in size to be valid in
MetaFluor.
Note: You will be able to resize the region only
in the direction indicated by the double arrows.
To stretch the region horizontally and vertically
simultaneously, the pointer must be over the
corner of the region outline so that the double
arrows are pointing diagonally.
3
Release the mouse button when the region is
the desired size.
Note: While you are resizing a region, you can
determine its size and location by looking at
the status line in the Region Toolbar; it will
display "Region: (left, top), (width, height)."
MetaFluor
549
Version 7.0
MetaFluor User’s Guide
Resizing or Reshaping a Line Region
To resize a line region drawn with any of the line region tools, use the following
procedure:
Step
Action
1
With the Locator Tool, click the line region
once to make it the active region.
2
Place the pointer over the line.
3
Double-click the line. Round handles will
appear at the ends of the line region. If the line
region consists of more than one segment,
nodes will appear at each vertex.
4
Place the pointer over the handle or node that
you want to move.
5
Hold down the left button of your mouse and
drag the handle or node to the desired
position. Then release the mouse button.
6
Repeat Steps 4 and 5 for each handle or node
that you wish to move.
MetaFluor
550
Version 7.0
MetaFluor User’s Guide
Rectangular Region Tool (Region Toolbar)
The Rectangular Region Tool is used to create and manipulate rectangular regions.
Use this tool to create closed regions in which all of the pixels within the boundaries of the
region outline are measured. When you select the Rectangular Region Tool, the pointer will
change to an arrow cursor with an attached "rectangle."
Click the Procedure button above to select from a list of Rectangular Region Tool procedures.
Note: Regions drawn with a two-dimensional Region Tool (Rectangular, Ellipse, Trace, or
Auto-Trace) must be at least 2x2 in size to be valid in MetaFluor.
MetaFluor
551
Version 7.0
MetaFluor User’s Guide
Creating a Rectangular Region
To create a rectangular region, use the following procedure:
Step
Action
1
Select the image window so that it is active,
and place the pointer at the desired location.
3
Press the left mouse button.
OR
Press [INS].
A rectangular region will appear.
MetaFluor
552
Version 7.0
MetaFluor User’s Guide
Creating and Resizing a Rectangular Region
To create and resize a rectangular region, use the following procedure:
Step
Action
1
Place the pointer at the desired location in the
active image window.
2
If you want to "lock" the Rectangular Region
Tool so as to create a perfectly square region
(i.e., X = Y), hold down the [ALT] key.
3
Drag the pointer downward and toward the
right using the left mouse button.
4
Release the mouse button when the region is
the desired size. A rectangular region will
appear.
Note: Regions drawn with a two-dimensional
Region Tool (Rectangular, Ellipse, Trace, or
Auto-Trace) must be at least 2x2 in size to be
valid in MetaFluor.
MetaFluor
553
Version 7.0
MetaFluor User’s Guide
Deleting Any Region, Made by Any Tool
To delete a region, use the following procedure:
Step
Action
1
Place the pointer inside the region's outline.
2
Press the right mouse button and choose
Delete Region from the pop-up context menu
that appears.
OR
Hold down the [SHIFT] key and press the right
mouse button.
3
The region will be deleted.
MetaFluor
554
Version 7.0
MetaFluor User’s Guide
Using the Locator Tool Without Switching Tools
To use the Locator Tool without switching tools, use the following procedure:
Step
1
Action
Press and hold the [CTRL] key down while
performing the desired Locator Tool task.
The pointer will change to the arrow pointer
used by the Locator Tool to indicate the
change in tool status.
MetaFluor
555
Version 7.0
MetaFluor User’s Guide
Ellipse Region Tool (Region Toolbar)
The Ellipse Region Tool is used to create and manipulate elliptical regions.
Use this tool to create closed regions in which all of the pixels within the boundaries of the
region outline are measured. When you select the Ellipse Region Tool, the pointer will change
to an arrow cursor with an attached "ellipse."
Click the Procedure button above to select from a list of Ellipse Region Tool procedures.
Note: Regions drawn with a two-dimensional Region Tool (Rectangular, Ellipse, Trace, or
Auto-Trace) must be at least 2x2 in size to be valid in MetaFluor.
MetaFluor
556
Version 7.0
MetaFluor User’s Guide
Creating an Elliptical Region
To create an elliptical region, use the following procedure:
Step
Action
1
Select the image window so that it is active
and place the pointer at the center of the
desired location (ellipses are initially drawn
from their center point, rather than the top left
corner).
2
Press the left mouse button.
OR
Press [INS].
An elliptical region will appear.
Note: Regions drawn with a two-dimensional
Region Tool (Rectangular, Ellipse, Trace, or
Auto-Trace) must be at least 2x2 in size to be
valid in MetaFluor.
MetaFluor
557
Version 7.0
MetaFluor User’s Guide
Creating and Resizing an Elliptical Region
To create and resize an elliptical region, use the following procedure:
Step
Action
1
Place the pointer at the desired location in the
active image window.
2
If you want to "lock" the Ellipse Region Tool
so as to create a perfectly circular region (i.e.,
X = Y), hold down the [ALT] key.
3
Drag the pointer downward and toward the
right using the left mouse button.
4
Release the mouse button when the region is
the desired size. An elliptical region will
appear.
Note: Regions drawn with a two-dimensional
Region Tool (Rectangular, Ellipse, Trace, or
Auto-Trace) must be at least 2x2 in size to be
valid in MetaFluor.
MetaFluor
558
Version 7.0
MetaFluor User’s Guide
Single Line Tool (Region Toolbar)
This tool is used to create single line regions.
Use this tool to create line regions that are of a one-pixel width and of any desired length. All
measurements will be made on only those pixels that are under the line. When you select the
Single Line Tool, the pointer will change to an arrow cursor with an attached line.
Click the Procedure button above to select from a list of Single Line Tool procedures.
MetaFluor
559
Version 7.0
MetaFluor User’s Guide
Starting the Single Line
To start a straight line with the Single Line Tool, use the following procedure:
Step
Action
1
Position the pointer at the desired location.
2
Press the left mouse button.
The line's starting point will appear, with a
rubber band line stretched between the
starting point and the current pointer position.
MetaFluor
560
Version 7.0
MetaFluor User’s Guide
Ending the Single Line
To end the straight line you are drawing with the Single Line Tool, use the following
procedure:
Step
Action
1
Move the pointer to the desired ending
location.
2
Press the left mouse button.
A solid, fixed line will appear.
MetaFluor
561
Version 7.0
MetaFluor User’s Guide
Multi-Line Tool (Region Toolbar)
This tool is used to create lines consisting of more than two or more straight-line
segments.
Use this tool to create multiple-point lines that are of a one-pixel width. All measurements will
be made on only those pixels that are under the line. When you select the Multi-Line Tool, the
pointer will change to an arrow cursor with an attached "multi-point line."
Click the Procedure button above to select from a list of Multi-Line Tool procedures.
MetaFluor
562
Version 7.0
MetaFluor User’s Guide
Starting a Multi-Line Region
To start a line consisting of more than two or more straight-line segments, use the
following procedure:
Step
Action
1
Select the image window so that it is active,
and place the pointer at the desired location.
2
Press the left mouse button.
The line's starting point will appear with a
rubber band line stretched between the
starting point and the current pointer position.
MetaFluor
563
Version 7.0
MetaFluor User’s Guide
Completing the First Segment of the Multi-Line
To complete the first segment of a multi-line region, use the following procedure:
Step
Action
1
Move the pointer and attached rubber band
line to the next point. (Do NOT hold down the
mouse button yet.)
2
Press (and RELEASE) the left mouse button.
The rubber band will freely follow the pointer to
its new location. A fixed line will appear when
the mouse button is clicked.
MetaFluor
564
Version 7.0
MetaFluor User’s Guide
Adding Additional Segments
To add more segments to the multi-line region, use the following procedure:
Step
Action
1
Move the pointer and attached rubber band
line to the next point. (Do NOT hold down the
mouse button yet.)
2
Press (and RELEASE) the left mouse button.
The rubber band line will freely follow the
pointer to its new location. A fixed line
attached to the previous segment will appear
for each segment you add.
3
Repeat Steps 1 and 2 for each segment you
want to add. A fixed line attached to the
previous segment will appear for each
segment you add.
MetaFluor
565
Version 7.0
MetaFluor User’s Guide
Ending the Last Line Segment
To end the last segment of the multi-line region, use the following procedure:
Step
Action
1
Move the pointer to the desired location.
2
Double-click the left mouse button.
3
MetaFluor will close the region automatically
so that the last point and the first point are
joined.
MetaFluor
566
Version 7.0
MetaFluor User’s Guide
Traced Line Tool (Region Toolbar)
This tool is used to create freehand lines.
Use this tool to make freehand line regions of a one-pixel width. All measurements will be
made on only those pixels that are under the line. When you select the Traced Line Tool, the
pointer will change to an arrow cursor with an attached "free-hand line."
Click the Procedure button above to select from a list of Traced Line Tool procedures.
MetaFluor
567
Version 7.0
MetaFluor User’s Guide
Starting a Hand-Traced Line
To start a hand-traced line with the Traced Line Tool, use the following procedure:
Step
Action
1
Select the image window so that it is active,
and place the pointer at the desired location.
2
Press the left mouse button.
OR
Press [INS].
The region's outline starting point will appear,
with a rubber band line stretched between the
starting point and the current pointer position.
MetaFluor
568
Version 7.0
MetaFluor User’s Guide
Adding a Point Using a Straight Line
To draw a straight line to the next point in a hand-traced region with the Trace Region
Tool, use the following procedure:
Step
Action
1
Move the pointer and attached rubber band
line to the next point. (Do NOT hold down the
mouse button yet.)
2
Press (and RELEASE) the left mouse button.
The rubber band will freely follow the pointer to
its new location. A fixed line will appear when
you press the mouse button.
MetaFluor
569
Version 7.0
MetaFluor User’s Guide
Ending the Hand-Traced Line
To end the hand traced line, use the following procedure:
Step
Action
1
Double-click the left mouse button.
2
MetaFluor will end the line.
MetaFluor
570
Version 7.0
MetaFluor User’s Guide
Auto-Trace Region Tool (Region Toolbar)
The Auto-Trace Region Tool is used to create regions by automatically tracing
objects.
Use this tool to create closed regions that delineate objects with well-defined edges. When
you select the Auto-Trace Region Tool, the pointer will change to an arrow cursor with an
attached "traced region."
Click the Procedure button above to select from a list of Auto-Trace Region Tool procedures.
Note: Regions drawn with a two-dimensional Region Tool (Rectangular, Ellipse, Trace, or
Auto-Trace) must be at least 2x2 in size to be valid in MetaFluor.
For best results, you should first configure this tool using the options in its dialog box.
MetaFluor
571
Version 7.0
MetaFluor User’s Guide
Configuring the Auto-Trace Region Tool
To configure the Auto-Trace Region Tool, use the procedure presented in the following
table:
Step
Action
1
Select the Auto-Trace Region Tool. The AutoTrace dialog box will appear.
2
From the Edge Detection group, select Dark to
Bright if your object is dark and your
background is bright.
OR
Select Bright to Dark if your object is bright
and your background is dark.
3
Select the desired type of edge smoothing
from the Edge Smoothing group:
None = no edge smoothing
Average = based on an average of the edge
vertices found by MetaFluor
Median = based on a median of the edge
vertices found by MetaFluor.
Intelligent = based on determining if a point’s
value is radically different from those of
neighboring vertices, and, if so, replacing that
value with one that is close to those of its
neighbors.
4
Select a value for Length that is greater than
the radius of the object (or one-half of the
length if it is of rectangular shape).
Note: It is important that you set the Length
value correctly. If the value is too large,
MetaFluor will include pixels that are not part
of the object in its search for edge vertices. If
the value is too small, MetaFluor will trace only
part of the object, or none of the object if it
cannot find edge vertices within the limits of
the length value.
5
Select the value for Angle to represent the
degrees between edge vertices. Select a
smaller number for small objects or highly
irregular objects.
6
Select a value for Threshold that will instruct
MetaFluor to consider a difference in gray
level of neighboring pixels that is greater than
the Threshold value to be an edge.
7
Select a value for the Width that will instruct
MetaFluor to consider only gray level shifts no
wider than this value to be an edge.
8
Select Use Threshold if you want MetaFluor to
use the threshold, set with the Threshold Tool
in the Image Window Toolbar, to assist it in
MetaFluor
572
Version 7.0
MetaFluor User’s Guide
finding the edge.
9
Once you have selected the necessary options
for the individual object, you can use the AutoTrace Tool.
10
To close the dialog box, click the Close button
in its upper right corner.
MetaFluor
573
Version 7.0
MetaFluor User’s Guide
Tracing an Object
To trace an object with the Auto-Trace Region Tool, use the procedure presented in the
following table:
Step
Action
1
Select the image window so that it is the active
window, and place the pointer over the center
of the object.
2
Press the left mouse button.
OR
Press [INS].
A region will appear which closely matches
what MetaFluor perceives as the edge of the
object.
Note: Regions drawn with a two-dimensional
Region Tool (Rectangular, Ellipse, Trace, or
Auto-Trace) must be at least 2x2 in size to be
valid in MetaFluor.
MetaFluor
574
Version 7.0
MetaFluor User’s Guide
Trace Region Tool (Region Toolbar)
The Trace Region Tool is used to create and manipulate hand-traced regions of
interest.
Use this tool to create hand-traced closed regions in which all of the pixels within the
boundaries of the region outline are measured. When you select the Trace Region Tool, the
pointer will change to an arrow cursor with an attached "hand-traced region."
Click the Procedure button above to select from a list of Trace Region Tool procedures.
Note: Regions drawn with a two-dimensional Region Tool (Rectangular, Ellipse, Trace, or
Auto-Trace) must be at least 2x2 in size to be valid in MetaFluor.
MetaFluor
575
Version 7.0
MetaFluor User’s Guide
Starting a Hand-Traced Region
To start a hand-traced region with the Trace Region Tool, use the following procedure:
Step
Action
1
Select the image window so that it is active,
and place the pointer at the desired location.
2
Press the left mouse button.
OR
Press [INS].
The region's outline starting point will appear,
with a rubber band line stretched between the
starting point and the current pointer position.
MetaFluor
576
Version 7.0
MetaFluor User’s Guide
Adding Points Using a Freehand Curve
To draw freehand curves with the Trace Region Tool, use the following procedure:
Step
Action
1
After starting the hand-traced region, drag the
pointer around the object you want to trace
(using the left mouse button).
2
MetaFluor will add a point wherever you drag
the pointer while holding down the mouse
button.
MetaFluor
577
Version 7.0
MetaFluor User’s Guide
Deleting the Last Added Point
To delete the last point that was added to a hand-traced region drawn with the Trace
Region Tool, use the following procedure:
Step
1
Action
Press the right mouse button.
OR
Press the [BACKSPACE] or [DEL] key.
2
MetaFluor will delete the last added point.
MetaFluor
578
Version 7.0
MetaFluor User’s Guide
Closing the Hand-Traced Region
To close a hand-traced region drawn with the Trace Region Tool, use the following
procedure:
Step
1
Action
Double-click the left mouse button.
OR
Press the [SPACEBAR] key.
2
MetaFluor will close the region automatically
so that the last point and the first point are
joined.
Note: Regions drawn with a two-dimensional
Region Tool (Rectangular, Ellipse, Trace, or
Auto-Trace) must be at least 2x2 in size to be
valid in MetaFluor.
MetaFluor
579
Version 7.0
MetaFluor User’s Guide
Using the Region Toolbar
MetaFluor
580
Version 7.0
MetaFluor User’s Guide
Opening the Region Toolbar
Step
Action
1
From the Graphs menu, choose Define
Regions for Measurement. The Select Source
Image for Editing dialog box will appear.
2
From the Image drop-down list, select the
image on which you want to define your
regions.
3
Choose OK. All other image windows will
close temporarily, and the Region Toolbar will
appear.
MetaFluor
581
Version 7.0
MetaFluor User’s Guide
Moving the Region Toolbar
Step
Action
1
Position the pointer over the toolbar title bar.
2
Click and hold the left mouse button while
dragging the toolbar to the new location.
3
Release the mouse button when the toolbar is
at the desired location.
MetaFluor
582
Version 7.0
MetaFluor User’s Guide
Closing the Region Toolbar
Step
1
Action
Click the Region Toolbar's Close button in the
upper right corner.
OR
Choose Done Editing Regions from the Edit
Regions dialog box.
2
The Region Toolbar and Edit Regions dialog
box will close, and all previously open image
windows will reappear.
MetaFluor
583
Version 7.0
MetaFluor User’s Guide
Changing the Color of a Region’s Outline
MetaFluor automatically assigns the color of a
region's outline unless the Use Same Color for New
Regions command is selected (enabled) in the Region
Toolbar configuration menu (the "Down Arrow" button).
However, you can change the color after the region
has been created.
Step
Action
1
Position the pointer over the desired region (or
within five pixels, if it is a line).
2
Press the right mouse button. A pop-up
context menu will appear.
3
Point to the Change Color command. A
cascading palette menu of color selections will
appear.
4
Choose the desired color from the menu. The
current color selection will be indicated with a
check mark.
5
When you release the mouse button, the
region outline will change to the new color,
and the context menu will close.
MetaFluor
584
Version 7.0
MetaFluor User’s Guide
Copying a Region Outline
You can copy a region outline so that you can use a
duplicate outline in another image. MetaFluor will retain
the X and Y coordinates of the region so that it can be
pasted in the same location as the region in the original
image. You can use this command to make a duplicate
outline for the same image, but you will need to move it
to the desired location.
Step
Action
1
Position the pointer over the desired region (or
within five pixels, if it is a line).
2
Press the right mouse button. A pop-up
context menu will appear.
3
Choose Copy Region from the menu.
4
Select the destination image window for the
outline copy so that its title bar is highlighted.
5
Right-click in the image. The context menu will
appear.
6
Choose Paste Region from the menu. The
copy of the outline will appear.
MetaFluor
585
Version 7.0
MetaFluor User’s Guide
Shrinking a Region Outline to Fit an Object
You can shrink a region created by the Rectangular,
Ellipse, or Trace Region Tools (which create closed
regions) to fit an object contained inside the region
within a thresholded image. Sections of the region
outline that are over background will shrink to find the
edge of the object. However, the position for sections
of the region outline that are over thresholded pixels
will not change. If there isn't an object inside the region,
the region outline will not change. If a threshold is not
set, this command assumes that any non-zero pixel is
object data.
Note: Regions drawn with a two-dimensional Region
Tool (Rectangular, Ellipse, Trace, or Auto-Trace) must
be at least 2x2 in size to be valid in MetaFluor.
Step
Action
1
Threshold the image if it not a binary image.
2
Select or create a region containing the entire
object. Avoid including parts of other objects in
the region. The region must be created using
the Rectangular, Ellipse, or Trace Region
Tool.
3
Position the pointer over the center of the
region.
4
Press the right mouse button. (The active
region tool can be the Locator, Rectangular,
Ellipse, or Trace Region Tool.) A pop-up
context menu will appear.
5
Choose Shrink to Fit from the context menu.
6
The region outline will shrink to form an outline
around the object.
MetaFluor
586
Version 7.0
MetaFluor User’s Guide
Shrinking a Region Outline Using a Three-Button
Mouse
If you have a three-button mouse, you can use a mouse
shortcut to shrink a new region created by the Rectangular,
Ellipse, or Trace Region Tools to fit an object contained
inside the region. This shortcut works just like the Shrink
to Fit command and requires a thresholded image. However,
the shortcut applies only to newly created regions.
Note: Regions drawn with a two-dimensional Region Tool
(Rectangular, Ellipse, Trace, or Auto-Trace) must be at least
2x2 in size to be valid in MetaFluor.
Step
Action
1
Threshold the image if it is not a binary image.
2
Create a region containing the entire object.
Avoid including parts of other objects in the
region. The region must be created using the
Rectangular, Ellipse, or Trace Region Tool.
3
Position the pointer over the center of the
region.
4
Press the middle mouse button. (The active
region tool must be the Rectangular, Ellipse,
or Trace Region Tool.)
5
The region outline will shrink to form an outline
around the object.
MetaFluor
587
Version 7.0
MetaFluor User’s Guide
Configuring the Default Behavior for Region Tools
You can configure the default behavior for tools either to
remain active or to revert back to the Locator Tool after
creating a region.
Step
Action
1
Click and hold the pointer on the Down Arrow
button in the Region Toolbar status bar. A pulldown menu will appear.
2
From the pull-down menu, choose Revert to
Locator Tool After Creating Region. A check
mark in front of this option will indicate that the
current tool will revert to the Locator Tool after
a region is created.
OR
If you want a tool to remain active until another
tool is selected, deselect Revert to Locator
Tool After Creating Region so that the check
mark is removed.
MetaFluor
588
Version 7.0
MetaFluor User’s Guide
Configuring the Default Color for Regions
MetaFluor automatically assigns the color of a region's
outline using randomly assigned colors. However, you
can change this behavior by specifying that a particular
color be used for all new regions.
Step
Action
1
Click and hold the pointer on the Down Arrow
button in the Region Toolbar status bar. A pulldown menu will appear.
2
Choose Use Same Color for New Regions
from the pull-down menu. A check mark in
front of this option will indicate that one color
will be used for all new regions.
OR
If you want region colors to be assigned
automatically, deselect Use Same Color for
New Regions so that the check mark is
removed.
3
If you enabled Use Same Color for New
Regions, click and hold the pointer on the
Down Arrow button again so that the pull-down
menu appears.
4
Choose Region Color from the pull-down
menu. A secondary menu will appear.
5
Select the desired color from the menu. It will
be highlighted with a dark border. The current
color for regions will be indicated with a check
mark.
MetaFluor
589
Version 7.0
MetaFluor User’s Guide
Locking Region Positions
Usually, you will want to be able to use the Locator Tool
to move regions. However, you can change this behavior
by specifying that the current region positions be locked.
Step
Action
1
Click and hold the pointer on the Down Arrow
button in the Region Toolbar status bar. A pulldown menu will appear.
2
Choose Lock Region Positions from the pulldown menu. A check mark in front of this
option will indicate that the region positions are
locked.
OR
If you do not want region positions to be
locked, deselect Lock Region Positions so that
the check mark is removed.
MetaFluor
590
Version 7.0
MetaFluor User’s Guide
Locking Region Sizes
Usually, you will want to be able to use the Locator Tool
to resize regions. However, you can change this behavior
by specifying that the current region sizes be locked. Once
region sizes are locked, new regions are drawn based upon
the default region size specified with the Set Default Region
Size command.
Note: Regions drawn with a two-dimensional Region Tool
(Rectangular, Ellipse, Trace, or Auto-Trace) must be at least
2x2 in size to be valid in MetaFluor.
Step
Action
1
Click and hold the pointer on the Down Arrow
button in the Region Toolbar status bar. A pulldown menu will appear.
2
Choose Lock Region Sizes from the pull-down
menu. A check mark in front of this option will
indicate that the region sizes are locked.
OR
If you do not want region sizes to be locked,
deselect Lock Region Sizes so that the check
mark is removed.
MetaFluor
591
Version 7.0
MetaFluor User’s Guide
Setting the Default Region Size
The default region size is used to specify the size of
rectangular and elliptical regions that are created when you
simply click in the image without resizing the region. If Lock
Region Sizes is enabled, new regions will be drawn based
upon the default region size specified with the Set Default
Region Size command.
Note: Regions drawn with a two-dimensional Region Tool
(Rectangular, Ellipse, Trace, or Auto-Trace) must be at least
2x2 in size to be valid in MetaFluor.
Step
Action
1
Click and hold the pointer on the Down Arrow
button in the Region Toolbar status bar. A pulldown menu will appear.
2
Choose Set Default Region Size from the pulldown menu. The Set Default Region Size
dialog box will appear.
3
Type the number of pixels for the default
horizontal and vertical size in the X Size and Y
Size text boxes, respectively.
4
Choose Close.
MetaFluor
592
Version 7.0
MetaFluor User’s Guide
Graphs
Some MetaFluor commands that display a graph use a standard, non-scrolling
graph window. Commands that use graphs with a variable, time-based X-axis,
however, typically use open-ended graph windows which are designed to be
interactive visual guides to the data currently being acquired.
All graphs in MetaFluor that use a standard, non-scrolling graph window can be configured in
a similar manner. You can configure titles, axis ranges and labels, tick marks, trace lines, and
element colors. You can also print the graph or copy it to the Clipboard. An example of this
type of graph is the one used for adjusting image contrast for an analog video camera.
Commands which acquire and measure data over time, frames, etc., use an open-ended
graph window that includes a scroll bar to accommodate the varying size of the X-axis. This
type of graph allows you to scale the Y-axis automatically. You can insert event marks with
your own text while acquiring the graph data. When you position the pointer over an event
mark or trace line, and then press and held down the left mouse button, a status line will be
displayed. If you click on an event mark, the event text will be displayed. Otherwise, data from
the closest point in the nearest trace line will be displayed. Like the graph trace line, the bullet
preceding the displayed data is color-coded to match the color of its region.
TIP: To bring otherwise obscured graph windows to the "top" of your workspace display,
choose the Bring Graphs to Front command from the Windows menu, or use its keyboard
shortcut, CTRL + G.
Note: The maximum number of measurements that can be displayed and stored in a scrolling
graph is 8,000 measurements. When this limit has been reached, measurements on the left
side of the graph will disappear as new measurements are made.
Standard Graph Windows
Configuring a Trace Line
Configuring Graph Titles
Configuring the X-Axis or Y-Axis
Configuring the Background
Printing a Graph
Copying a Graph to the Clipboard
Saving a Graph as a Bitmap
Scrolling Graph Windows
Configuring a Trace Line
Autoscaling the Y-Axis
Printing a Graph
Copying a Graph to the Clipboard
MetaFluor
593
Version 7.0
MetaFluor User’s Guide
Autoscrolling the Graph
MetaFluor
594
Version 7.0
MetaFluor User’s Guide
Using Shortcuts
MetaFluor
595
Version 7.0
MetaFluor User’s Guide
Keyboard Shortcuts
Commands that are frequently used in MetaFluor have keyboard shortcuts which activate the
command without opening its menu. Keyboard shortcuts are listed on the menu to the right of
the command. The keyboard shortcuts are also listed with command descriptions throughout
the online Help.
To use a keyboard shortcut, press and hold the first key and then press the second key listed.
If it is just one key, simply press the key listed.
EXAMPLE:
The shortcut for Clear Graphs is CTRL + C.
Press and hold the [CTRL] key, and then press the letter [C] on your keyboard. Finally,
release the [CTRL] key.
MetaFluor
596
Version 7.0
MetaFluor User’s Guide
Menu Shortcuts
Underlined letters in a menu command name represent a keyboard alternative to accessing
that menu item with a mouse. To open the menu and choose a command without using your
mouse, type in sequence:
[ALT] key, menu letter, and command letter
EXAMPLE:
To quit MetaFluor, you would type: [ALT], [F], [X].
Press and release the [ALT] key, then the [F] key, and finally the [X] key.
If a menu has two or more commands with the same letter underlined, MetaFluor will select
the first command that uses that keyboard letter. Subsequent presses of the same key will
select the following commands in the menu that use that letter. Commands are selected by
MetaFluor in the order they are listed on the menu.
MetaFluor
597
Version 7.0
MetaFluor User’s Guide
Intensity Modulated Display (IMD) Mode
The purpose of the IMD display is to display ratio images so that the areas of
interest are ratioed while the background areas are blank. The IMD display
accomplishes this without the need for thresholding the wavelength image.
Every pixel in the ratio image is generated by ratioing the corresponding pixel of the
Wavelength 1 image with that from the Wavelength 2 image (or Wavelength 4 with
Wavelength 5). The resulting ratio value is scaled between the minimum and maximum ratio
that you expect to obtain, and is then displayed. Typically, a pseudocolor look-up table is used
to map colors to the different ratio ranges. For example, if the minimum ratio is set at 0 and
the maximum ratio is set at 4, the bottom half of the pseudocolor display (colors ranging from
black and dark blue through cyan and green) will represent ratios between 0 and 2, while the
top half of the pseudocolor display (colors ranging from yellow through orange, red, and white)
will represent ratios from 2 to 4.
The drawback with the Pseudocolor display is that for pixels with a very low intensity, random
noise in the image will have a large effect on the resulting ratio. For example, there may be a
background area with intensities that are very close to zero. If imaged by an ideal imaging
sensor, the background might read out as gray level 5 on both the Wavelength 1 and the
Wavelength 2 image. The ratio for this would be 5/5, which is a ratio of 1. However, with a
noisy detector (as is often the case when imaging photon-limited specimens) there will be a
certain amount of random noise either increasing or decreasing the intensity of each pixel. In
this case, we might have an instance where the same pixel in Wavelength 1 is read as gray
level 8 (the actual value of 5 plus 3 noise gray levels) and the corresponding pixel in
Wavelength 2 might be read as gray level 2 (the actual value of 5 less 3 noise gray levels).
This would give us a ratio of 8/2, or 4. A ratio of 4, using the Pseudocolor scale described
above would appear as bright white, while the actual ratio of 1 for this pixel would appear as
blue. This large discrepancy is due to the effect of noise on the dim background pixels.
The IMD display accounts for this by using an ingenious technique devised by Dr. Roger Tsien
and associates. This technique divides the color scale into a distinct number of color hues.
Each color hue is further divided into intensities. For example, a typical division might divide
the color scale into eight color hues (purple, blue, cyan, blue-green, green, yellow, orange,
and red). Each of these color hues has a range of 32 intensities, ranging from dark to bright.
For instance, the green band will range from dark green (essentially black) to bright green.
The IMD display uses the ratio to determine the color hue, but uses the intensity from the
wavelength images to determine the intensity of the color hue. In the case initially presented,
the ratio of the two pixels would be a ratio of 4 and fall into the red hue. However, since the
intensity of the wavelengths was so low, the intensity of the red would be 0 and the result
would be a black pixel. This makes the background disappear from the image.
MetaFluor allows you to choose a tradeoff between color hues for ratios and intensity levels.
The number of color hues multiplied by the number of intensities must equal 256. In the
previous example, 8 * 32 = 256. You can have other combinations such as 16 hues of 16
intensities each, or 4 hues of 64 intensities each, and so on. You should specify the number of
hues that will match the number of different ratios you anticipate seeing. For instance, if all of
your data is clustered around a ratio of 1, you would set your minimum and maximum ratio to
be very close to 1 and set the number of hues to a low number (such as 2 or 4) and the
number of intensities would be correspondingly large. If you have a dynamic scene with a
large number of ratios, you will have to compromise with fewer intensities per ratio.
MetaFluor
598
Version 7.0
MetaFluor User’s Guide
MetaFluor also allows you to choose which wavelength image will be used to determine the
intensity component of the display. You can choose either wavelength image, or you can
choose to average the wavelength images and use that averaged value to determine the
intensity. Typically, you would choose the brightest image.
The IMD display mode operates independently of the bit-depth (bits per pixel) of the source
wavelength images. It depends primarily on the ratio, which is always a floating-point number
that will range between the minimum and maximum ratios that you have defined. The intensity
component is derived as a percentage of the intensity of the source image. If you have the
IMD display set to use 32 intensities, and the intensity component is coming from Wavelength
2, and Wavelength 2 is an 8-bit image (gray levels from 0 to 255), MetaFluor will map gray
levels 0 - 7 of the wavelength image as intensity level 0, gray levels 8 - 15 of the wavelength
image as intensity level 1, and so on. If the wavelength image is a 16-bit image, MetaFluor will
divide the range of intensities of the wavelength image by the number of IMD intensities to find
the intensity stepping factor. For example, if the wavelength image went from gray levels 200
to 1000, and the IMD display was set to use 32 intensity levels, gray levels 200 - 224 would
map to IMD intensity 0, gray levels 225 - 249 would map to IMD intensity 1, and so on.
If your computer monitor is set to 256 colors, you can use the palette control of the image
window (click the " P " button in the Image Window Toolbar) and set the palette entries on the
ratio image to 236--the maximum allowed. However, this will cause the other image windows
on the desktop to blank out. If you set your computer monitor display to 10-, 12-, or 24-bit
color, the ratio and other image windows will be displayed in their best possible format, with no
side effects. This configuration is recommended.
MetaFluor
599
Version 7.0
MetaFluor User’s Guide
List of Available Drop-ins
Drop-in
Name
Menu
Description
cond
Run
Experiment
Defines sets of experimental
conditions that can be used
to flag the experiment at
appropriate times. Tags
logged data.
dac
Analog
Analog measurements
option for electrophysiology,
calcium or O2 electrodes,
etc.
Dualview
Configure
Splits images acquired with
an image splitter into two
separate images for two
separate wavelengths.
importnd
Utilities
Imports a "multidimensional" sequence of
images into MetaFluor.
movie
Utilities
Builds and plays movies
from images on disk.
save8bit
Utilities
Saves 16-bit Wavelength
image files as 8-bit TIFF
files.
savecal
Calibration
Saves ratio or calibration
scales as *.gry files.
twaincfg
Utilities
Selects a Twain-compliant
device for image acquisition
and specifies whether to use
the device's user interface..
MetaFluor
600
Version 7.0
MetaFluor User’s Guide
Installing Drop-ins Using the Meta Imaging Series
Administrator
To install MetaFluor drop-ins using the Meta Imaging Series Administrator, complete the
following procedure:
Step
Action
1
Exit MetaFluor.
2
On your desktop, locate and double-click the
Meta Imaging Series 6.0 Icon, then doubleclick Meta Imaging Series Administrator.
OR
From the start button, locate and open
Programs>Meta Imaging Series 6.X >Meta
Imaging Series Administrator.
3
After the Meta Imaging Series Administrator
dialog box opens, press the F1 key to open
the Help file for information about installing
and removing drop-ins.
MetaFluor
601
Version 7.0
MetaFluor User’s Guide
MetaFluor
602
Version 7.0
MetaFluor User’s Guide
MetaFluor
603
Version 7.0
MetaFluor User’s Guide
Thresholds
Threshold levels are used to separate objects that you want to measure from their
background on the basis of differences of gray level. MetaFluor has two active
thresholding modes:
In the first mode ("On-Exclusive"), thresholding sets values between a defined set of low
and high threshold levels to zero, excluding areas containing pixels with those gray levels
or color values from measurement and/or analysis. Excluded areas will be displayed as
black. In this mode, only pixels with values below the low threshold or above the high
threshold will be measured.
In the second mode ("On-Inclusive"), thresholding sets values below the defined low
threshold and above the defined high threshold to zero. In this mode, only pixels with
values between the upper and lower threshold levels will be measured. Again, excluded
areas will be displayed as black. Typically, the low threshold is adjusted so that the
background area is excluded in one or both wavelength images. The high threshold is
often used to exclude bright regions, such as cell nuclei. By excluding these portions of
the image, it becomes easier to interpret the events of interest that are happening in the
specimen.
Note: Thresholding only changes the display of the image and how it is measured; it
does not affect actual image gray level information or the data that are saved.
The Monochrome display mode is a black and white grayscale display. The Pseudocolor
display contains the same grayscale levels as in monochrome display, but arbitrary
colors are assigned to assist you in distinguishing similar grayscale levels.
The brightness and contrast options allow you to adjust the digital contrast of an image.
The digital contrast affects the image intensity values that are shown in the image
window, not the image data. If you are working with 16-bit images, you should adjust the
contrast using the Scale 16-Bit Images command rather than with the digital contrast
options.
The brightness option allows you to adjust the overall brightness of an image.
The contrast option allows you to expand the range of grayscale levels displayed for an
image. As a result, contrast reduces the number of grayscale levels that you will see in
the image at one time (the number of grayscale levels actually available stays the same),
but increases the perceived contrast of the image.
MetaFluor
604
Version 7.0
MetaFluor User’s Guide
Export Log Data - Dialog Box Options
Application
Specifies the application for the DDE link. If several versions of an application are listed,
select the one that matches the version of the application you plan to use. The
application's default settings for the other options will be displayed when you have
selected the desired application. If your application is not listed, select Other Application
from the drop-down list.
Sheet Name
Specifies the name of the worksheet that you want to use in the DDE-linked spreadsheet
program.
Starting Row
Specifies the first row number you want to use for logging data. Must match the
numerical or alphabetical format used by the application.
Starting Column
Specifies the first column number you want to use for logging data. Must match the
numerical or alphabetical format used by the application.
Application Name
This option appears only if you have selected Other Application as the DDE-linked
application. This option is defined by the application receiving the data. You will need to
contact the application's technical support staff to obtain this information. This entry
typically is a single word that refers to the software.
EXAMPLE: EXCEL.
Topic Name
This option appears only if you have selected Other Application as the DDE-linked
application. This option is defined by the application receiving the data. You will need to
contact the spreadsheet program developer's technical support staff to obtain this
information. For spreadsheet programs, it is the name of the worksheet in which the data
will be placed.
EXAMPLE: SHEET1.
Item Name
This option appears only if you have selected Other Application as the DDE-linked
application. This option is defined by the application receiving the data and specifies
where the data are to be sent. You will need to contact the application's technical support
staff to obtain this information. MetaFluor recognizes two special symbols in this text
string: "<r>" which is replaced by the current row number/letter and "<c>" which is
replaced by the current column number/letter.
EXAMPLE: R<r>C<c> for an application which uses the format of R1C1 or RAC1.
OK
Instructs MetaFluor to open a DDE link to an open spreadsheet application, using the
specified worksheet name, starting row, and starting column.
Cancel
Cancels the command.
MetaFluor
605
Version 7.0
MetaFluor User’s Guide
Default
Resets the text in the Sheet Name, Starting Row, and Starting Column text boxes to the
default settings for the selected application.
MetaFluor uses a device called a Bounding Rectangle when keeping
track or making measurements of the coordinates of irregularly shaped
regions. This is done by placing an imaginary (that is, not actually drawn)
rectangle over the region outline. The sides of the rectangle are perfectly
vertical and horizontal, and the smallest rectangle possible is used that still
circumscribes all of the outermost reaches of the irregular region outline. This
Bounding Rectangle is used for handling the irregular region’s coordinates by
determining the upper, leftmost point of the rectangle, just as though an actual
rectangular region was present.
MetaFluor
606
Version 7.0
MetaFluor User’s Guide
Selecting the Drive
Click the Look In or Save In drop-down list box (which version you see will depend on whether
you are loading or saving a file) at the top of the dialog box to open its drop-down list. If you
don't see the desired drive letter and name, drag the scroll box until you see it in the dropdown list. Click anywhere on the drive name so that it is highlighted.
MetaFluor
607
Version 7.0
MetaFluor User’s Guide
Selecting the File's Directory
If you don't see the icon for the desired file in the currently displayed folder, click the Up One
Level icon button, which has the icon of a manila folder with a superimposed arrow pointing
up. This will bring you up one level in the directory structure. You can repeat this step, if
necessary, and can even use it to select a different drive. If you need to go down a level, find
the icon for the pertinent subfolder in the collection of currently displayed icons, and then
choose Open. The DOS single period (" . ") and double period (". .") can be typed in the File
Name text box to specify directories that are secondary to the currently selected directory or
that are secondary to the current directory's parent directory, respectively. If you need to
create a new folder (directory), choose the Create New Folder icon button, which looks like a
manila folder with rays of light emanating from it. Then type a name for the new folder in the
text box which appears next to the new folder's icon.
MetaFluor
608
Version 7.0
MetaFluor User’s Guide
Selecting the File Type
If there many files in the folder, you may want to limit the
display of files in the File Name list to one particular type. Click the Down Arrow for the Files of
Type drop-down list box to open its pull-down list. If you don't see the desired file type, drag
the scroll box until you see it in the list. Click anywhere on the file type name so that it is
highlighted.
When you are saving images, you will need to select a file type. However, for many types of
files in MetaFluor, the default file type associated with that kind of file will be selected for you
already.
MetaFluor
609
Version 7.0
MetaFluor User’s Guide
Selecting the File
Click once on the icon for the desired file to display its name in
the File Name text box.
When you are saving files, you should type a new name in the File Name text box, unless you
want to select an existing name from the list box and overwrite that file.
MetaFluor
610
Version 7.0
MetaFluor User’s Guide
Typical Dialog Box Options
Type of
Option
Purpose
Selection Procedure
Command
buttons
Initiates an
immediate action.
Dimmed buttons
indicate
commands that
are not currently
available.
Choose command
button.
Command
buttons
with ellipsis
(. . .)
Opens a
secondary dialog
box.
Choose command to
open next dialog box.
More >>
buttons
Expands dialog
box.
Choose command
button to select from
additional options.
Less <<
buttons
Condenses dialog
box to original
size.
Choose command
button to close extra
options.
Text box
Allows user to
supply information
or choice.
Type requested text
at flashing insertion
point. Use the
[Backspace] or [Del]
key to delete text.
List box
Displays a list of
choices that
doesn't fit into a
dialog box.
Click scroll bars with
pointer until desired
item appears in list.
Click an entry to
highlight it. You can
use cursor keys to
advance list until the
item Is highlighted.
Dropdown/pulldown lists
Displays only the
current selection
available in a list.
If there are many
choices, a scroll
bar will be
displayed.
Click the arrow at the
right of the box to
open the list. Select
the option in the
same manner as a
list box.
Radio
buttons
Displays mutually
exclusive options.
Select the desired
option. The circle will
fill when it is selected.
Selecting a new
option clears the
MetaFluor
611
Version 7.0
MetaFluor User’s Guide
previous selection.
Check
boxes
MetaFluor
Displayed next to
options that are
not mutually
exclusive.
612
Select or clear the
desired boxes or
associated text.
Options that are
selected will contain
a check mark inside
the check box.
Version 7.0
MetaFluor User’s Guide
Configuring a Trace Line
To configure the trace line, use the following procedure:
Step
Action
1
Using the left mouse button, double-click the
pointer on or within five pixels of the trace line.
The Configure Trace dialog box will appear.
Note the sample trace line displayed on the
lower right side of the dialog box.
2
Configure the appearance of the trace line
using Trace Style, Mark Style, Line Style, and
Width:
Trace Style enables/disables the connection of
trace points from one point to another.
Mark Style selects the style of markers used.
Line Style specifies the type of line used.
Width specifies the pixel width of the line.
3
If you want to change the color of the trace
line, select Change Color. The Color dialog
box will appear. Select a color from the Basic
Color group and choose OK.
4
If you want to change the color of the interior
of the graph, select Set Interior Color. The
Color dialog box will appear. Select a color
from the Basic Color group and choose OK.
5
Use Range to set the minimum change in pixel
intensity needed before MetaFluor updates a
graph for a live or stack image window. Set to
0 for continuous updating. Set to 10 for timely
updating with little or no flicker. Avoid large
values such as 100.
6
Select Apply to All Traces to apply the same
option settings to all traces if more than one
trace is available.
7
Choose OK when you have finished.
Return to Graphs and Topic Menu
MetaFluor
613
Version 7.0
MetaFluor User’s Guide
Autoscaling the Y-Axis
To configure MetaFluor to scale the Y-axis range automatically,
use the following procedure:
Step
Action
1
Click the Down Arrow in the lower left corner
of the graph window to open the pull-down
menu.
2
Choose AutoScale Y Axis. A check mark will
appear next to the menu entry, and the
scrolling graph's Y-axis will be scaled
automatically.
Return to Graphs and Topic Menu
MetaFluor
614
Version 7.0
MetaFluor User’s Guide
Configuring Graph Titles
The graph title and the X-axis and Y-axis titles can be
configured using the same configuration procedure.
To configure any of the three titles, use the following
procedure:
Step
1
Action
Double-click the pointer on the desired title in
the graph window using the left mouse button.
OR
Click the Down Arrow in the lower left corner
of the graph window to open the pull-down
menu. Choose Title, X Title or Y Title from the
menu.
2
The Configure Title dialog box will appear.
3
Type a new title name in the Title text box.
4
If you want to change the color of the title,
choose Change Color. The Color dialog box
will appear. Select a color from the Basic Color
group and choose OK.
5
Choose OK when you have finished.
Return to Graphs and Topic Menu
MetaFluor
615
Version 7.0
MetaFluor User’s Guide
Configuring the X-Axis or Y-Axis
The graph's X-axis and Y-axis can be configured using
the same configuration procedure. To configure either axis,
use the following procedure:
Step
1
Action
Double-click the pointer on the desired axis in
the graph window using the left mouse button.
OR
Click the Down Arrow in the lower left corner
of the graph window to open the pull-down
menu. Choose X Axis or Y Axis from the
menu.
2
The Configure Axis dialog box will appear.
3
Use Minimum Value and Maximum Value to
select the minimum and maximum gray values
to be graphed.
4
Select the number of labeled tick marks along
the axis using # Major Tick Marks. This
number must be divisible into the number of
gray levels to be graphed.
AND
Select the number of plain tick marks between
the major tick marks using # Minor Tick Marks.
5
Select the number of digits of the largest value
to be graphed (the maximum value) using #
Digits.
6
To change the axis color, choose Change
Color. The Color dialog box will appear. Select
a color from the Basic Color group and choose
OK.
7
Choose OK when you have finished.
Return to Graphs and Topic Menu
MetaFluor
616
Version 7.0
MetaFluor User’s Guide
Configuring the Background
To configure the background, use the following procedure:
Step
1
Action
Double-click the pointer anywhere in a corner
of the background in the graph window using
the left mouse button.
OR
Click the Down Arrow in the lower left corner
of the graph window to open the pull-down
menu. Choose Background from the menu.
2
The Configure Plot dialog box will appear.
Note the sample background displayed on the
right side of the dialog box.
3
To change the color of one of the graph's
elements, select Background, Border, Major
Ticks, or Minor Ticks. The Color dialog box will
appear. Select a color from the Basic Color
group and choose OK.
4
Select the desired format for the graph using
the Plot Format drop-down list. Linear is
usually a good choice.
5
Choose OK when you have finished.
Return to Graphs and Topic Menu
MetaFluor
617
Version 7.0
MetaFluor User’s Guide
Printing a Standard Graph
MetaFluor can print a copy of a standard graph to the
default printer selected by the Windows Print Manager.
To print a copy of a graph, use the following procedure:
Step
Action
1
Click the Down Arrow in the lower left corner
of the graph window to open the pull-down
menu. Choose Print from the menu.
2
A print message dialog box will appear. Select
Yes if you want to use a white background
with black graphics for printing.
OR
Select No if you want to print the graph using
its existing background and graphics colors.
3
MetaFluor will display a Print dialog box
indicating that it is ready to print the graph to
the default printer. Choose OK to print the
graph.
Return to Graphs and Topic Menu
MetaFluor
618
Version 7.0
MetaFluor User’s Guide
Printing a Scrolling Graph
MetaFluor can print a copy of a scrolling graph to the
default printer selected by the Windows Print Manager.
To print a copy of a graph, use the following procedure:
Step
Action
1
Click the Down Arrow in the lower left corner
of the graph window to open the pull-down
menu. Choose Print from the menu. The Print
Setup dialog box will appear.
2
Select the desired printer from the Printer
group. Choose OK when you have finished.
3
MetaFluor will display a Print dialog box
indicating that it is ready to print the graph to
the default printer. Choose OK to print the
graph.
Return to Graphs and Topic Menu
MetaFluor
619
Version 7.0
MetaFluor User’s Guide
Copying a Graph to the Clipboard
MetaFluor can copy a graph to the Clipboard for pasting
into other applications. To copy a graph, use the following
procedure:
Step
Action
1
Click the Down Arrow in the lower left corner
of the graph window to open the pull-down
menu. Choose Copy to Clipboard from the
menu.
2
MetaFluor will copy the graph window to the
Clipboard.
3
Paste the copied graph into the desired
application using its Paste command (most
programs support the keyboard shortcut,
CTRL + V).
Return to Graphs and Topic Menu
MetaFluor
620
Version 7.0
MetaFluor User’s Guide
Saving a Graph as a Bitmap
MetaFluor can save a graph as a bitmap for use in other
applications. The bit-depth of the saved .bmp image will
depend on the depth of your video display: if you are using
a depth of 8 bits (256 levels) or less, the graph image will be
saved as an 8-bit image. If your display has a depth greater
than 8 bits, the graph will be saved as a 24-bit image.
To save a graph as a bitmap, use the following
procedure:
Step
Action
1
Click the Down Arrow symbol in the lower left
corner of the graph window to open the pulldown menu. Choose Save as Bitmap from the
menu. The Select Save File dialog box will
appear.
2
Type the desired file name in the File Name
text box. If necessary, use the Save In dropdown list box or Up One Level button to
change the location for the file.
3
Choose Save. MetaFluor will display a
message when the graph has been saved.
Choose OK to confirm the message.
Return to Graphs and Topic Menu
MetaFluor
621
Version 7.0
MetaFluor User’s Guide
Configuring a Trace Line
To configure the trace line, use the following procedure:
Step
Action
1
Double-click the pointer on or within five pixels
of the trace line with the left mouse button.
2
The Set Trace Style dialog box will appear.
Note the sample trace line displayed at the
bottom of the dialog box.
3
Select the desired pixel width of the trace line
using Line Width.
4
Select the type of line used to display the trace
line using Line Style.
5
Select the style of markers used to denote the
points on the trace line using Mark Style.
6
If you want to change the color of the trace
line, choose Color. The Color dialog box will
appear. Select a color from the Basic Color
group and choose OK.
7
If you want to apply the same option settings
to all traces if more than one trace is available,
select Make These Changes to All Graph
Traces.
8
Choose OK when you have finished.
Return to Graphs and Topic Menu
MetaFluor
622
Version 7.0
MetaFluor User’s Guide
Autoscrolling the Graph
A scrolling graph can be set to autoscroll so that the
newest data being plotted are always visible. You can
enable or disable this feature at any time. To enable or
disable the autoscroll feature, use the following procedure:
Step
Action
1
Select the check box (unlabeled) located on
the right side of the horizontal scroll bar, so
that it is filled in.
2
Start graphing. The graph will automatically
scroll so that the most recent data is displayed
on the right side of the graph.
3
To disable the autoscroll feature, clear the
check box. The graph will only scroll if you
scroll it manually using the vertical scroll bar.
Return to Graphs and Topic Menu
MetaFluor
623
Version 7.0
MetaFluor User’s Guide
Hiding the Histogram Labels
To hide the grayscale and area values displayed in the
histogram, use the following procedure:
Step
Action
1
Select the Settings menu from the Histogram
menu bar.
2
Choose Labels from the menu so that its
check mark is cleared.
Return to Histogram Tool and Topic Menu
MetaFluor
624
Version 7.0
MetaFluor User’s Guide
Using Show Highlight Bars
When you are working with a binary (1-bit) image, the red
and blue Highlight Bars will need to be hidden. The default
is for this setting to be enabled so that the highlight bars
can be seen while working with 8-bit and 16-bit images.
To hide the red and blue Highlight Bars in the histogram
for a binary image, use the following procedure:
Step
Action
1
Select the Settings menu from the Histogram
menu bar.
2
Choose Show Highlight Bars from the menu
so that its check mark is cleared.
3
The Highlight Bars will be hidden.
Return to Histogram Tool and Topic Menu
MetaFluor
625
Version 7.0
MetaFluor User’s Guide
Highlighting Under Bars
Highlight Under Bars highlights the pixels in the image
which have the gray value selected by the bar in the
histogram. For example, if gray level 50 is selected by
the blue Highlight Bar, all pixels in the image which have
a gray level of 50 will be marked with a blue overlay.
To enable Highlight Under Bars so that you can see
the overlays, use the following procedure:
Step
Action
1
Select the Settings menu from the Histogram
menu bar.
2
Choose Highlight Under Bars from the menu.
A check mark will appear next to the item,
indicating that it is enabled.
3
As you slide the red or blue Highlight Bar, the
overlay will change to reflect the value
selected in the histogram. Red and blue lines
will appear in the Contrast Slider to indicate
the value that you have selected in the
histogram.
Note: If you do not have the palette set to 236
entries, the overlay may "disappear." This is
because the limited palette does not include
the gray level you selected in the histogram.
Return to Histogram Tool and Topic Menu
MetaFluor
626
Version 7.0
MetaFluor User’s Guide
Highlighting Between Bars
Highlight Between Bars highlights all pixels in the image
that have grayscale values that fall in the range between
the blue and red Highlight Bars. Pixels will be marked
with a purple overlay. The overlay will extend to those
pixels marked by the bars if Highlight Under Bars is
disabled. Otherwise, pixels with those precise gray
levels will not be marked with the overlay.
To enable Highlight Between Bars, use the following
procedure:
Step
Action
1
Select the Settings menu from the Histogram
menu bar.
2
Choose Highlight Between Bars from the
menu. A check mark will appear next the item,
indicating that it is enabled.
3
As you slide the red and blue Highlight Bars,
the overlay will change to reflect the values
selected in the histogram. A purple line will
appear in the Contrast Slider to indicate the
values that you have selected in the
histogram.
Return to Histogram Tool and Topic Menu
MetaFluor
627
Version 7.0
MetaFluor User’s Guide
Turning On Area as a Percentage
MetaFluor will display the image area with pixels that have
gray levels that fall in the range between the red and blue
Highlight Bars. The area can be given either as an absolute
number of pixels or as a percentage of total pixels.
To enable Area as Percentage, use the following procedure:
Step
Action
1
Select the Settings menu from the Histogram
menu bar.
2
Choose Area as Percentage from the menu. A
check mark will appear next to the item,
indicating that it is enabled.
Return to Histogram Tool and Topic Menu
MetaFluor
628
Version 7.0
MetaFluor User’s Guide
Turning On Apply LUT to Graph
Apply LUT to Graph applies the image's look-up table (LUT)
when graphing the histogram. This means that commands
that change the LUT (such as Stretch LUT or contrast
adjustment) will be reflected accurately in the histogram.
Apply LUT to Graph should be chosen whenever you
adjust the contrast.
Note: This command is intended for use with monochrome
images. The grayscale levels from the green channel of the
LUT will be those that are graphed using this feature. Since
the three channels are identical in a monochrome image,
all grayscale levels will be represented in the histogram.
Step
Action
1
Select the Settings menu from the Histogram
menu bar.
2
Choose Apply LUT to Graph from the menu. A
check mark will appear next to the item,
indicating that it is enabled.
Return to Histogram Tool and Topic Menu
MetaFluor
629
Version 7.0
MetaFluor User’s Guide
Scaling Between Bars
Sometimes a histogram's scaling may not be ideal for your
purposes. For example, an image can contain a large number
of pixels with gray value 0, causing a tall "spike" in the histogram
at gray value 0. To accommodate this "spike" within the Y-axis,
the range might become so extended that the grayscale values
that you really want to study are not well-represented.
Scale Between Bars rescales the histogram graph so that
the grayscale value with the most pixels between the bars
becomes the peak gray value. To apply Scale Between
Bars, use the following procedure:
Step
Action
1
Move the red and blue Highlight Bars to
bracket the gray values of interest.
2
Select the Settings menu from the Histogram
menu bar.
3
Choose Scale Between Bars from the menu. A
check mark will appear next to the item,
indicating that it is enabled.
Note: Rescaling is active only when Scale
Between Bars is chosen. If you move the bars
while Scale Between Bars is chosen, the scale
of the graph will be updated to reflect the new
peak gray value. (The Peak Gray Value label
at the top of the Y-axis will reflect this change.)
Return to Histogram Tool and Topic Menu
MetaFluor
630
Version 7.0
MetaFluor User’s Guide
Stretching an Image's LUT
Some images do not have a brightness range that extends
through the full range of gray levels available in the histogram
display. Stretch LUT allows you to expand the brightness
range of the image by selecting a range of grayscale values
and "stretching" the actual gray levels to cover the entire
range of possible values.
The same number of gray levels missing before the stretch
will still be missing, but the values will be spread evenly
through the entire histogram. Because this changes the
look-up table values but not the actual gray level values,
a pixel that is gray level 100 will still be gray level 100 after
this command is applied.
Step
Action
1
Move the red and blue Highlight Bars to
bracket the gray values of interest.
2
Select the Commands menu from the
Histogram menu bar.
3
Choose Stretch LUT.
4
To revert back to the original LUT values,
select the Contrast Tool and choose Reset
Contrast from the pop-up menu that appears.
Return to Histogram Tool and Topic Menu
MetaFluor
631
Version 7.0
MetaFluor User’s Guide
Scaling 16-Bit Images
The Scale Image command is the same as the Scale
16-Bit Images command. A 16-bit image consists of
65536 possible gray levels but, due to experimental
conditions, much of your data may reside within a
narrow range of gray values. The Scale 16-Bit Images
command allows you to scale 16-bit images to a selected
range of 256 gray levels, thereby increasing the apparent
contrast in the displayed image. This command will not
affect measurements; its purpose is to give you control
over the brightness and contrast in the image display.
Step
Action
1
Adjust the blue Highlight Bar in the histogram
to the darkest gray level you want to use for
the images (the same as using Low Scale in
the Scale 16-Bit Image dialog box).
2
Adjust the red Highlight Bar in the histogram to
the brightest gray level you want to use for the
images (the same as using High Scale in the
Scale 16-Bit Image dialog box).
3
Select the Commands menu from the
Histogram menu bar.
4
Choose Scale Image. The image will be
rescaled.
Return to Histogram Tool and Topic Menu
MetaFluor
632
Version 7.0
MetaFluor User’s Guide
Setting the Histogram's X-Axis
Set X Axis sets the X-axis scaling of the histogram graph
to the range defined by the blue and red Highlight Bars.
To use Set X Axis, use the following procedure:
Step
Action
1
Move the blue Highlight Bar to the location in
the graph that you want to use as the left edge
of the rescaled histogram.
2
Move the red Highlight Bar to the location in
the graph that you want to use as the right
edge of the rescaled histogram.
3
Select the Commands menu from the
Histogram menu bar.
4
Choose Set X Axis. The graph will be
rescaled.
Return to Histogram Tool and Topic Menu
MetaFluor
633
Version 7.0
MetaFluor User’s Guide
Resetting the Histogram's X-Axis
Set X Axis sets the X-axis scaling of the histogram graph
to the range defined by the blue and red Highlight Bars.
To use Set X Axis, use the following procedure:
Step
Action
1
Select the Commands menu from the
Histogram menu bar.
2
Choose Reset X Axis. The graph's X-axis
scaling will be restored.
Invert
Inverting a look-up table remaps the addresses in a look-up
table so that the lowest and highest gray values are switched
as shown in the following table.
When you invert the look-up table of an image containing a
dark background and bright objects, the background will
become bright and the objects will be dark.
Value in
Original Table
MetaFluor
Value in
Inverted Table
0
255
1
254
2
253
3
252
4
251
...
...
251
4
252
3
253
2
254
1
255
0
634
Version 7.0
MetaFluor User’s Guide
Using the Contrast Tool and the Contrast Slider
Auto Enhance allows MetaFluor to adjust the contrast by performing
a stretch on only those grayscale levels that are contained in the image's histogram.
Reset Contrast resets the contrast to the default settings of
Contour = OFF, Invert = OFF, Quantization = 255, Brightness = 50,
and Contrast = 50.
MetaFluor
635
Version 7.0
MetaFluor User’s Guide
Adding a Point Using a Straight Line
To add a straight-line segment to a hand-traced line, use the following procedure:
Step
Action
1
Move the pointer and attached rubber band
line to the next point. (Do NOT hold down the
mouse button yet.)
2
Press (and RELEASE) the left mouse button.
The rubber band line will follow the pointer to
its new location. A fixed line will appear when
you press the mouse button.
MetaFluor
636
Version 7.0
MetaFluor User’s Guide
Adding Points Using a Freehand Curve
To continue a hand-traced line with a freehand curve, use the following procedure:
Step
Action
1
After starting the hand-traced line, drag the
pointer around the object that you want to
trace (using the left mouse button).
2
MetaFluor will add a point wherever you drag
the pointer.
MetaFluor
637
Version 7.0
MetaFluor User’s Guide
Deleting the Last Added Point
To delete the last point added to a hand-traced line, use the following procedure:
Step
1
Action
Press the right mouse button.
OR
Press the [BACKSPACE] or [DEL] key.
2
MetaFluor will delete the last added point.
MetaFluor
638
Version 7.0
MetaFluor User’s Guide
Locator Tool
This is the default tool in the Region Toolbar. It is used
to select, move, resize, edit, and delete regions.
Rectangular Region Tool
This tool is used to create and manipulate rectangular regions.
Unlike a line tool, the regions that this tool creates are closed regions
in which all of the pixels within the boundaries of the region outline
are measured. When the Rectangular Region Tool is selected,
the pointer will change to an arrow with an attached rectangle.
Ellipse Region Tool
This tool is used to create and manipulate elliptical regions.
Unlike a line tool, the regions that this tool creates are closed regions
in which all of the pixels within the boundaries of the region outline
are measured. When the Ellipse Region Tool is selected, the pointer
will change to an arrow with an attached ellipse.
Trace Region Tool
This tool is used to create and manipulate hand-traced regions of interest.
Unlike a line tool, the regions that this tool creates are closed regions
in which all of the pixels within the boundaries of the region outline
are measured. When the Trace Region Tool is selected, the pointer
will change to an arrow with an attached hand-traced region.
Single Line Tool
This tool is used to create single lines. The regions that this tool makes
are of a one-pixel width, and all measurements will be made on only
those pixels that are under the line. When the Single Line Tool is selected,
the pointer will change to an arrow with an attached line.
Multi-Line Tool
This tool is used to create multiple-point lines. The regions that this tool makes
are of a one-pixel width, and all measurements will be made on only those pixels
that are under the line. When the Multi-Line Tool is selected, the pointer will change
to an arrow with an attached multi-point line.
Traced Line Tool
This tool is used to create freehand lines. The regions that this tool makes
are of a one-pixel width, and all measurements will be made on only those
pixels that are under the line. When the Traced Line Tool is selected, the pointer
will change to an arrow with an attached free-hand line.
Auto-Trace Region Tool
This tool is used to create regions by automatically tracing objects.
It works best on objects which are clearly singular objects with
well-defined edges. When the Auto-Trace Region Tool is selected,
the pointer will change to an arrow with an attached traced region.
MetaFluor
639
Version 7.0
MetaFluor User’s Guide
A section of an image designated for image operations.
All such operations occur within a region when it is selected.
Also referred to as an "ROI."
MetaFluor
640
Version 7.0
MetaFluor User’s Guide
Preparing for Image Acquisition
To prepare for image acquisition, use the following procedure:
Step
Action
1
From the Run Experiment menu, choose
Experiment Control Panel. The Experiment
Control Panel dialog box will appear.
2
Focus the microscope using the Focus
command.
3
If you want to use background subtraction
and/or shading correction, acquire the
appropriate reference images and enable
Subtract Backgrounds and Shading Correction
using the Reference Images command.
4
Configure the desired wavelength, binning,
exposure time, acquisition region options
using the Configure Acquisition command.
5
If you want to save images, ratios, or log data,
open the appropriate file using the Open Save
Images File, Open Save Ratios File, or
Open Measurements File commands.
Note: The appropriate command will be
opened automatically if Save Images, Save
Ratios, or Log Data is selected but a file has
not yet been opened.
6
If you plan to log data, you may want to enable
Log Data in the Experiment Control Panel now
so that the location, size, and area of the
regions are logged at the start of the log file.
Do not select Save Images or Save Ratios in
the Experiment Control Panel yet.
7
Use the Define Regions for Measurement
command to define the desired regions of
interest (necessary for measurements).
8
From the Experiment Control Panel, choose
Set Timelapse. The Set Timelapse dialog box
will appear.
Select the timelapse interval and the
measurement units using Timelapse Interval.
Select 0 for no timelapse.
Select the number of acquisitions to acquire
using Number of Acquisitions. Select 0 if you
want the acquisition to continue until you
choose Pause Acquisition.
Choose Close to return to the Experiment
Control Panel.
MetaFluor
641
Version 7.0
MetaFluor User’s Guide
Running the Experiment
To acquire images and/or data, use the following procedure:
Step
Action
1
From the Run Experiment menu, choose
Experiment Control Panel. The Experiment
Control Panel will appear.
2
Choose F4: Acquire or press the [F4] function
key. MetaFluor will start image acquisition.
3
Whenever you want to save ratios or images,
select Save Images or Save Ratios to enable
saving. Clear the Save Images or Save Ratios
check boxes when you want to stop saving
wavelength or ratio images.
EXAMPLE:
You can enable and disable Save Images so
that images are saved from cycles 3 - 10 but
not save images from cycles 1, 2, and 11.
4
You can enable or disable Log Data at any
point during acquisition.
5
Mark events or move regions as necessary
during the experiment.
6
The status line will report "Acquiring
Wavelength X," "Transmitting Wavelength X,"
"Ratioing images," or "Next acquire in XX ms."
If the acquisition time selected is shorter than
the time required to complete acquisition
tasks, the next acquisition will start after the
previous one was finished.
7
Press the [F2] key on the keyboard or choose
F2: Pause to stop the acquisition at any time.
MetaFluor
642
Version 7.0
MetaFluor User’s Guide
Histogram of Scaled 16-Bit Image
The darkest and brightest 0.1% of the pixels in the image are excluded,
and the scaling will be based on the values of the lowest and highest
remaining grayscale values.
MetaFluor
643
Version 7.0
MetaFluor User’s Guide
Scaling Example
Consider a CCD camera with a 12-bit chip. It generates images with intensity ranges that can
fall anywhere between gray levels 0 and 4096. If you scaled the entire range of the chip, you
would take the range, which would be (4096 - 0) = 4096, and divide that by 256. This results in
16 data intensity levels per displayed intensity level. This means that each span of 16 gray
levels coming from the chip would be represented on the monitor by a single gray level. Thus,
gray levels 0 - 15 on the chip would appear as gray level 0 (black) on the monitor, levels 16 31 on chip would be gray level 1 on the monitor, and so on up to gray levels 4080 - 4095 on
the chip, which are displayed as gray level 255 (white) on the monitor.
Usually, however, the entire dynamic range of the chip is not represented in the acquired data.
For example, the camera may have a bias level of around 70, which means that no pixel
would have a grayscale value less than 70. You may be imaging a faint signal whose brightest
value is 500. If we used 70 as the start of the scaling and 500 as the end of the scaling, the
range would be 500 - 70 = 430 levels, and dividing this by 256 results in 1.7 data intensity
levels per displayed intensity level. Thus, every 1.7 gray levels on the chip, starting from gray
level 70, would be represented by a different intensity level on the computer screen. Gray
levels 70 and 71 would be 0 (black) on the monitor, level 72 would be gray level 1, levels 73
and 74 would be gray level 2, and so on, up to gray levels 498 and 499, shown as gray level
255 (white) on the monitor.
Autoscaling finds the darkest and the brightest pixels in the image. These values are then
used as the scaling values. Autoscaling lets you see the full dynamic range of the 16-bit
image, with equal contrast for all of its gray shades.
However, if you are acquiring two or more wavelengths, you may need to compare the
wavelength images visually. If you want to do so, you should not use Autoscale All. This is
because one image may have very dim gray levels, and the other(s) may have very bright
gray levels, but they will look the same after they have each been independently autoscaled.
MetaFluor
644
Version 7.0
MetaFluor User’s Guide
Index
16-bit images
saving as 8-bit
327
scaling
210, 211
16-bit images: 210, 327
A
Acquire Calibration Standards command 358, 359, 361
Acquire Stream command
278, 279
acquisition
acquiring a single image
200
analog measurements
509
configuring illumination
122
configuring save intervals
133
enabling/disabling display of individual images 133
stopping acquisition 198
stream acquisition
273, 278
acquisition:
122, 133, 198, 200, 273, 278, 509
Add Sequence Journals - Dialog Box Options
422
Align Wavelengths
283, 285
Align Wavelengths
Dialog Box Options 285
Aligning Wavelengths 284
Analog Async Status command 489, 509, 510, 511
Analog Contrast234
Analog Display command
489, 506, 507, 508
analog measurements 489, 490, 512, 515
Annotation window
closing
478
opening
475
Annotation window:
475, 478
annotations
475, 478
Archive Experiment command 90, 91, 92
Arrange Windows command
480, 481
asynchronous acquisition
509
Auto Enhance 536
Auto-Execute Journals command
413, 414, 415
Auto-Trace Region Tool 580, 581, 583
AVI files
saving movies as
311
B
background subtraction 243, 247
Borland Quattro Pro
62
Bring Dialogs to Front command 484, 485
Bring Graphs to Front command 486, 487
Bring Images to Front command 482, 483
Build INF File command 314, 315, 316, 317, 318, 319, 320
MetaFluor
645
Version 7.0
MetaFluor User’s Guide
C
Calibrating the Z-Axis 157
calibration
358, 363, 367, 370, 373, 379, 382, 385
Calibration
158
Z-Axis
158
Calibration Map command
382, 383, 384
Calibration Preferences 103, 104, 110
calibration tables
388
Changing the Color of a Region s Outline
593
Clear Graphs command 306, 307
Clear Measurement Regions and Graphs command
308, 309
clock 202
Close Annotation command
478, 479
Close Experiment command
52, 53
Close Measurements File command
69, 70
Close Notebook command
473, 474
Close Save Images File command
75, 76
Close Save Ratios File command
80, 81
Close Sequence Status command
463, 464
Close Status Window command 468, 469
closing MetaFluor
119
Closing the Region Toolbar
592
Closing the Sequence Status Window 464
Command Bar
showing or hiding
456
compressing an experiment
90
conditions
defining
286
tagging data with
289
Conditions command 289, 290, 291
conditions:
286, 289
Configure Acquisition command 122, 123, 125, 127, 129, 132
Configure Analog Measurements command
489, 490, 491, 492, 494, 495, 496, 497, 498,
499, 500, 502, 503, 504, 505
Configure Dual View
159
Configure Dual View - Dialog Box Options
161
Configure Experiment command 133, 135, 137
Configure Graphs command
301, 302, 304
Configure Illumination 173
Configure Illumination - Dialog Box Options
176
Configure Intensifier Gain Control command
333, 334, 335
Configure Paths command
116, 117, 118
Configure Ratios command
139, 140, 141, 143, 144, 145, 146, 147, 148, 149, 150, 151, 617
Configuring Dual View 160
Configuring Equation Calibration in situ 364
Configuring Quick Equation Calibration in vitro 368
Configuring the Default Behavior for Region Tools
597
Configuring the Default Color for Regions
598
Configuring Titration Calibration in situ 371
Configuring Titration Calibration in vitro 374
Configuring Titration Calibration in vitro Using Reference Images 376
contrast
adjusting for video cameras 234
increasing contrast in 16-bit images 210
Contrast Slider 536, 538
MetaFluor
646
Version 7.0
MetaFluor User’s Guide
Contrast Tool 536, 537
contrast:
210, 234
Control Panel 180, 187, 195, 219, 222
Controlling
153
Controlling Z position 153, 155
Dialog options
155
Controlling Z Position 154
Convert Data File to Text File command 489, 515, 516, 517
Convert PI MultiViewer Images command
346, 347, 350, 351, 352, 353
Copying a Region Outline
594
Create Journal command
395, 396, 398
Create Journal Toolbar command
435, 436, 438, 439
D
data logging
closing a log file
69
configuring 133
opening a log file
58
viewing a data log
66
data logging: 58, 66, 69, 133
DDE 61, 62
decompressing an experiment 93
default paths
configuring 116
defaults
returning system settings to 114
Define Regions for Measurement command
258, 293, 294, 295, 299
Delete Images command
322, 323, 324
dialog boxes
484, 523
Digital Camera Preferences
103, 104, 107
digital cameras 354
display
configuring 133
Display Mode Tool
531, 532, 533, 534, 535, 538, 551
drivers
Twain
354
video 354
drivers: 354
Dual View
159
Configuring 159
E
Edit Conditions command
286, 287, 288
Edit Journal command 401, 402, 404, 405, 406, 407
Edit Journal Toolbar command 440, 441, 443
Ellipse Region Tool
565, 566, 567
equation
367
Equation Calibration command 363, 364, 366
Equation Calibration in situ - Dialog Box Options 366
Equation Calibration in vitro
367
Equation Calibration in vitro - Dialog Box Options
Event Mark Hotkeys command 268, 269
Event Marks command 260, 261, 263, 265, 266
Events List
260, 270, 272
Excel 61
MetaFluor
647
369
Version 7.0
MetaFluor User’s Guide
Exit command 119, 120
exiting MetaFluor
119
Experiment Control Panel command
focusing images on an external monitor with data images displayed on the computer's monitor
235, 238
focusing images with both the focus and data images displayed on the computer's monitor
226, 229
playback mode
195, 196, 197
using a digital camera with an external video monitor 180, 185, 188, 194, 739, 740
using a digital camera with the computer's monitor
180, 182, 188, 190, 739, 740
using a video camera with the computer's monitor
186, 187, 222, 224, 234
video camera with external monitor 219, 220, 232, 237
Experiment Control Panel command:
180, 182, 185, 186, 187, 188, 190, 194, 195, 196, 197,
219, 220, 222, 224, 226, 229, 232, 234, 235, 237, 238, 739, 740
experiments
closing
52
compressing 90
decompressing compressed experiments
93
displaying information for the current experiment
54
opening stored experiments 49
running
187, 740
starting new experiments
47
experiments: 47, 49, 52, 54, 90, 93, 187, 740
Export Log Data
628
Extract Archived Files command 93, 94, 95
F
filter wheels
122
Fix Contrast
536
FlashPoint cameras
354
Focus control 153
focusing
182, 183, 185, 220, 226, 227, 228, 235, 237
Focusing Preferences 113
G
General Preferences
103, 104, 106
Get Info command
54, 55, 56
graphs
analog measurements
506
bringing to front
486
clearing and closing 308
clearing without closing
306
configuring 301
overview
602
showing or hiding intensity and ratio graphs 458
graphs: 301, 306, 308, 458, 486, 506, 602
grayscale
displaying the value of the pixel under the cursor
selecting number of levels for display 539
grayscale:
330, 539
330
H
Hide Journal Toolbar command 451, 452
hiding image windows 133
Histogram Tool 529, 530
MetaFluor
648
Version 7.0
MetaFluor User’s Guide
I
ICCD 333, 336, 340, 343
Icon Toolbar
454, 524
illumination
configuring 122
measuring a spectral response
169
Illumination
173
Configuring 173
Illumination command 174, 175
illumination:
122, 169
Image Display Controls command
using an external video monitor
163, 165, 239
using the computer's monitor 162, 164, 167, 240
Image Display Controls command:
162, 163, 164, 165, 167, 239, 240
Image Window Toolbar 526
Image Window Tools
Contrast Slider
526, 536
Contrast Tool 526, 536
Display Mode Tool
526, 531
Histogram Tool
526, 529
Palette Tool 526, 539
Threshold Slider
542
Threshold Tool
542
Threshold Tool
526
Zoom Tool 526, 527
Image Window Tools: 526, 527, 529, 531, 536, 539, 542
Image-1/FL
314, 391
images
arranging in a single row
480
bringing to front
482
deleting
322
importing
346
playing back ratio images in a movie 311
printing
96
renaming
122
saving the last acquired images
206
scaling 16-bit images 210
showing or hiding image windows
133
images: 96, 122, 133, 206, 210, 311, 322, 346, 480, 482
IMD
162, 163, 606, 607
Import Image-1/FL CAL File command 391, 392, 393
Import N-Dimensional Imaging Sequence command
325, 326
importing
Bio-Rad confocal TCSM images
314
image stacks 314
Image-1/FL *.CAL files
391
Image-1/FL images 314
MetaGFP images
314
RGB TIFF images
314
sequentially named images 314
importing:
314, 391
INF files
71, 75, 314
Initialize to Defaults command 114, 115
installing drop-ins
611
Installing Drop-ins Using the Meta Series Administrator 611
MetaFluor
649
Version 7.0
MetaFluor User’s Guide
intensified CCDs
333, 336, 340, 343
Intensity Modulated Display
606
J
Journal Functions
36
Journal Toolbar Shortcuts command
447, 448
journals
Auto-Execute Journals
413, 416
creating
395
editing
401
running
410
Sequence Journals 418, 423, 425
toolbars
435, 440, 444, 447, 449, 450, 451
Trigger Journals
427, 431, 433
journals:
395, 401, 410, 413, 416, 418, 423, 425, 427, 431, 433, 435, 440, 444, 447, 449,
450, 451
K
keyboard shortcuts
604
L
line regions
creating
568, 571
List of Available Drop-ins
610
Load Journal Toolbar command 444, 445, 446
Load Protocol File command
82, 83, 84
Locator Tool
549, 550, 552, 553, 554, 555, 556, 557, 558, 559, 563, 564
Locking Region Positions
599
Locking Region Sizes 600
Log Now command
208, 209
logging data
logging the current data
208
look-up table 162, 163, 531, 606
lossary of terms 30
Lotus 1-2-3
62
LUT
162, 163, 531, 606
M
Manually Configuring Titration Calibration in vitro375
map
382, 385
Matrox LC Board Preferences 103, 104
Measure Spectra command
169, 170, 172
measurements files
closing
69
opening
58
viewing
66
measurements files:
58, 66, 69
measurements graphs 301
menu shortcuts 605
Meta Imaging Series Administrator
610
MetaDevices 122
MetaGFP
314
MicroCal Origin 62
monochromators
122
monochrome 531
MetaFluor
650
Version 7.0
MetaFluor User’s Guide
Move All Regions command
280, 281, 282
movies 311
Moving the Region Toolbar
591
Multi-Line Tool 571, 572, 573, 574, 575
MultiViewer
346
N
New Experiment command
Notebook
closing
473
opening
470
Notebook:
470, 473
47, 48
O
One Acquisition command
201
One Acqusition command
200
Open Annotation command
475, 476, 477
Open Experiment command
49, 50, 51
Open Measurements File command
58, 59, 60, 61, 62, 63, 65, 628
Open Notebook command
470, 471, 472
Open Save Images File command
71, 73, 74
Open Save Ratios File command
77, 78, 79
Open Sequence Status command
460, 461, 462
Open Status Window command 465, 466, 467
Opening the Region Toolbar
590
P
Palette Tool
539, 540
paths
configuring 116
PI MultiViewer 346
PI Video ICCD Settings command
343, 344, 345
PKUNZIP
93
PKZIP 90
Play Movie from Disk command 311, 313
Playback Preferences 103, 104, 111, 112
Preferences command 103, 104, 105, 107, 108, 109, 110, 111, 112, 113
Print Image command 96, 97, 98, 100, 101
Print Options 101
printing 96
Printing an Image While Defining Regions
297
protocol files
loading
82
saving
85
protocol files: 82, 85
pseudocolor
531
Q
Quattro Pro
62
Quench Calibration command
379, 380, 381
R
ratio files
ratio images
configuring
MetaFluor
77, 80
139, 140, 141, 143, 144, 145, 146, 147, 148, 149, 617
651
Version 7.0
MetaFluor User’s Guide
ratio limits
162, 163
Rectangular Region Tool
560, 561, 562
Reference Images command
computer window display
247, 248, 250, 252, 253
external monitor display
243, 244, 245, 246
Reference Images command: 243, 244, 245, 246, 247, 248, 250, 252, 253
Region Toolbar 546
Region Tools
Auto Trace Region Tool
580
Auto-Trace Region Tool
546
Ellipse Region Tool 546, 565
Locator Tool 547, 549
Multi-Line Tool
546, 571
Rectangular Region Tool
546, 560
Single Line Tool
546, 568
Trace Region Tool
546, 584
Traced Line Tool
546, 576
Region Tools: 546, 549, 560, 565, 568, 571, 576, 580, 584
regions
clearing
308
creating line regions 568, 571
defining for measurement
293
deleting
553, 563
displaying location data
557
editing shape 552
making active 550
moving all regions simultaneously
280
moving closed regions
555
moving line regions 556
resizing closed regions
558
resizing line regions 559
selecting a region for saving 255
regions: 255, 280, 293, 308, 550, 552, 553, 555, 556, 557, 558, 559, 563, 568, 571
Replay Stored Data command 489, 512, 513, 514
replaying stored experiments
49
Reset Contrast 536
Run Journal command 410, 411, 412
Run Sequence command
425, 426
S
Save as 8-Bit Image command 327, 328, 329
Save Calibration Maps command
385, 386, 387
Save Calibration Table command
388, 389, 390
Save Last Acquired Images command 206, 207
Save Protocol File command
85, 86, 87, 88
saving
configuring save intervals
133
ratio image files
77
ratio images 133
terminating ratio image saving 80
terminating wavelength image saving 75
wavelength image files
71
wavelength images 133
saving: 71, 75, 77, 80, 133
Scale 16-Bit Images command 210, 212, 213
Scale Bar Preferences 103, 104, 109
MetaFluor
652
Version 7.0
MetaFluor User’s Guide
scanners
354
Select Save Region command 255, 256, 259, 298
Select Video/Camera for Acquisition command 102, 216, 217
Selecting a Region for Acquisition
131
Sequence Journals command 418, 419, 421
Sequence Status window
closing
463
opening
460
Sequence Status window:
460, 463
Set Camera Level and Gain command 340, 341, 342
Set Intensifier Gain command 336, 337, 338
Set Timelapse 204
Setting Default Region Size
601
shading correction
243, 247
shortcuts
Event Marks hotkeys 268
journal toolbar
447
keyboard
604
menu 605
shortcuts:
268, 447, 604, 605
Show Event List command
270, 271
Show Journal Toolbar command449, 450
Show or Hide Command Bar command 456, 457
Show or Hide Graphs command 458, 459
Show or Hide Toolbar command 454, 455
showing image windows133
Shrinking a Region Outline to Fit an Object
595
Shrinking a Region Outline Using a Three-Button Mouse 596
shutters 122
Single Line Tool568, 569, 570
spectral response
169
Spot cameras 354
Spot Measurements command 330, 331, 332
spreadsheets
exporting data to
58
standards
358
starting new experiments
47
Status window
closing
468
opening
465
Status window: 465, 468
Stop Acquisition command
198, 199
stream acquisition
273, 278
Stream Setup command273, 274, 276
T
tables
calibration
388
Threshold Slider
542, 543
Threshold Tool 542, 543
thresholding
162, 163
titration 373
Titration Calibration in situ
370
Titration Calibration in situ - Dialog Box Options 372
Titration Calibration in situ command
372
Titration Calibration in vitro
373
MetaFluor
653
Version 7.0
MetaFluor User’s Guide
Titration Calibration in vitro - Dialog Box Options 377
Titration Calibration in vitro command 375, 376
toolbars
Icon Toolbar 454, 524
Image Window Toolbar
526
journal
435, 440, 444, 447, 449, 450, 451
Region Toolbar
546, 547
toolbars:
435, 440, 444, 447, 449, 450, 451, 454, 524, 526, 546
tools
Auto Trace Region Tool
580
Contrast Slider
536
Contrast Tool 536
Display Mode Tool
531
Ellipse Region Tool 565
Histogram Tool
529
Locator Tool 549
Multi-Line Tool
571
Palette Tool 539
Rectangular Region Tool
560
Single Line Tool
568
Threshold Slider
542
Threshold Tool
542
Trace Region Tool
584
Traced Line Tool
576
Zoom Tool 527
tools: 527, 529, 531, 536, 539, 542, 549, 560, 565, 568, 571, 576, 580, 584
Trace Region Tool
578, 584, 585, 586, 587, 588
Traced Line Tool
576, 577, 579, 689, 690, 691
Trigger Journals command
427, 428, 430
Twain Configure command
354, 355, 356
Twain driver
354
U
Updates History command
519, 520, 521
Use Auto-Execute Journals command 416, 417
Use Sequence Journals command
423, 424
Use Trigger Journals command 431, 432
V
Video Camera Preferences
103, 104, 108
video cameras 354
video devices
switching
102
View Measurements command 66, 67, 68
W
Wait for Trigger command
wavelength
122
Wavelengths 283, 284
Aligning
283, 284, 285
433, 434
Z
Z Axis Calibration
Z position
154
Controlling 154
MetaFluor
156
654
Version 7.0
MetaFluor User’s Guide
Z Position Control
153, 155
Z-Axis 157
Calibration 157
Z-Axis Calibration - Dialog Box Options 158
Zero Clock command 202, 203
Zoom Tool
527, 528
MetaFluor
655
Version 7.0
MetaFluor User’s Guide
MetaFluor
Version 7.0