1
CHAPTER 15. GENERAL SEQUENCE ANALYSES
261
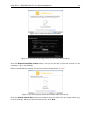
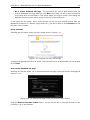
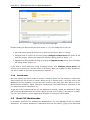
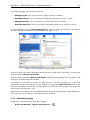
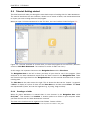
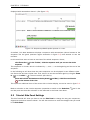
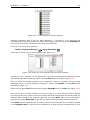
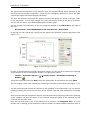
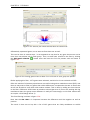
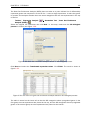
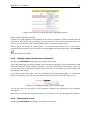
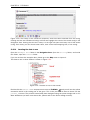
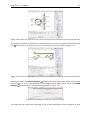
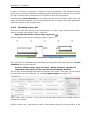
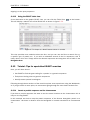
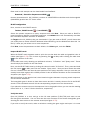
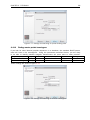
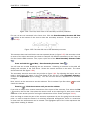
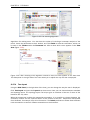
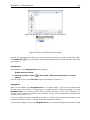
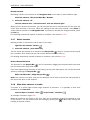
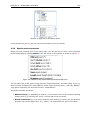
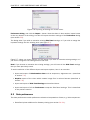
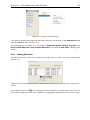
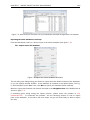
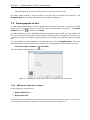
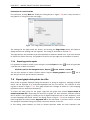
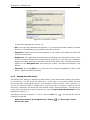
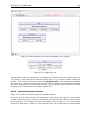
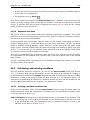
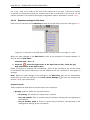
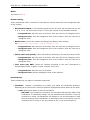
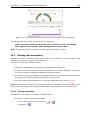
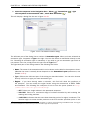
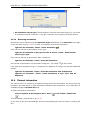
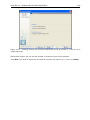
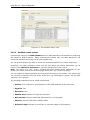
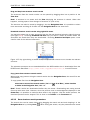
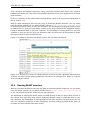
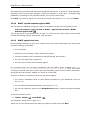
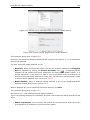
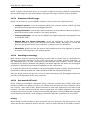
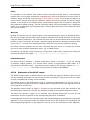
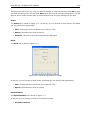
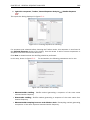
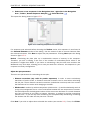
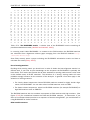
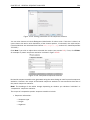
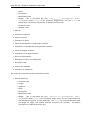
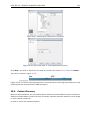
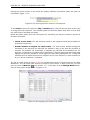
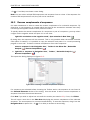
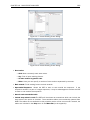
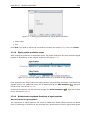
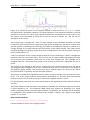
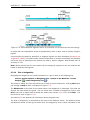
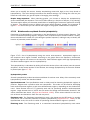
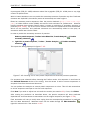
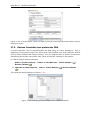
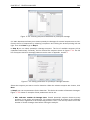
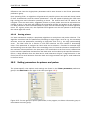
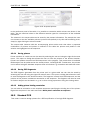
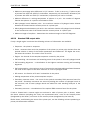
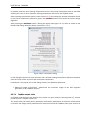
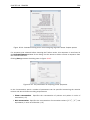
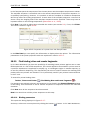
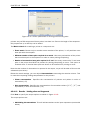
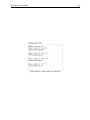
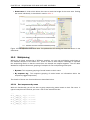
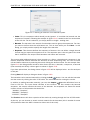
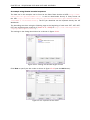
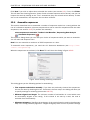
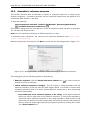
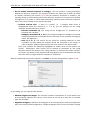
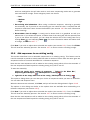
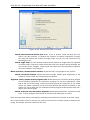
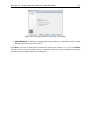
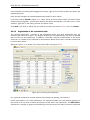
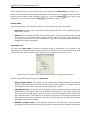
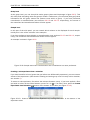
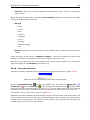
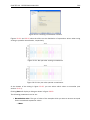
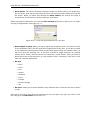
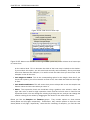
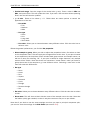
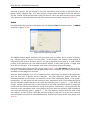
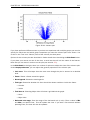
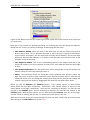
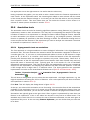
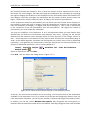
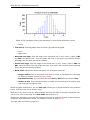
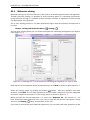
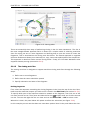
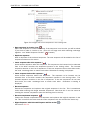
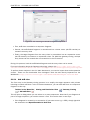
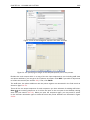
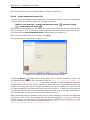
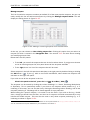
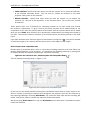
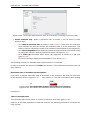
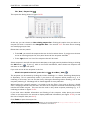
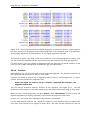
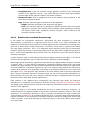
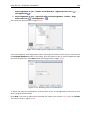
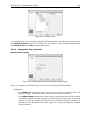
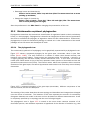
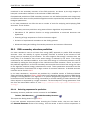
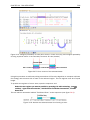
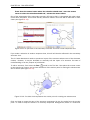
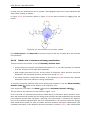
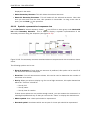
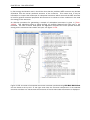
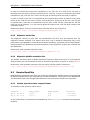
Figure 15.15: Setting parameters for the sequence statistics.
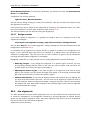
You can also choose to include Background distribution of amino acids. If this box is ticked, an
extra column with amino acid distribution of the chosen species, is included in the table output.
(The distributions are calculated from UniProt www.uniprot.org version 6.0, dated September
13 2005.)
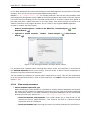
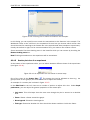
Click Next if you wish to adjust how to handle the results (see section 9.2). If not, click Finish.
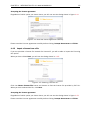
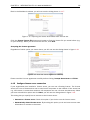
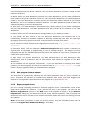
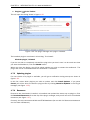
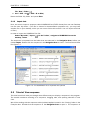
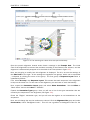
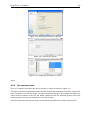
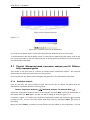
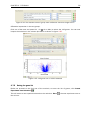
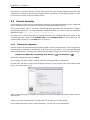
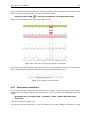
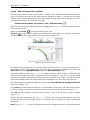
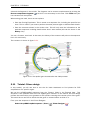
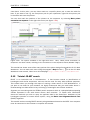
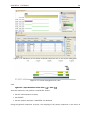
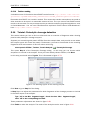
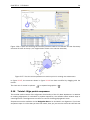
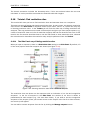
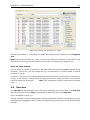
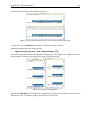
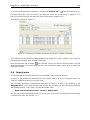
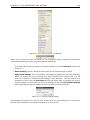
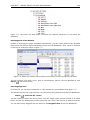
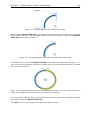
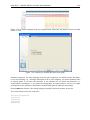
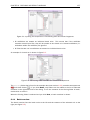
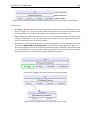
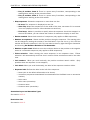
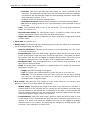
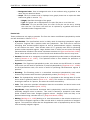
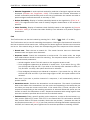
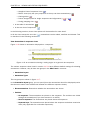
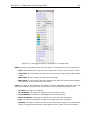
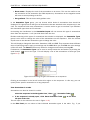
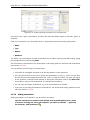
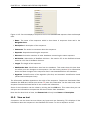
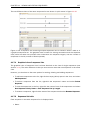
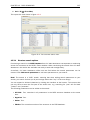
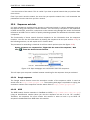
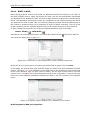
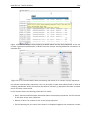
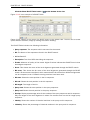
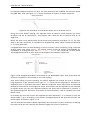
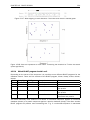
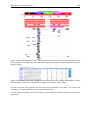
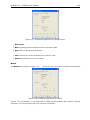
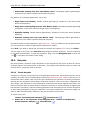
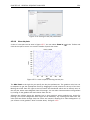
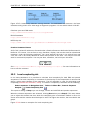
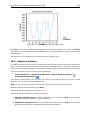
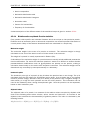
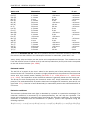
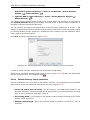
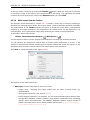
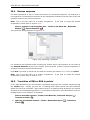
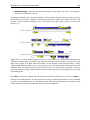
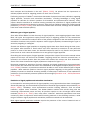
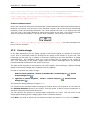
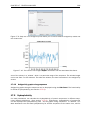
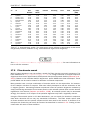
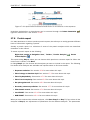
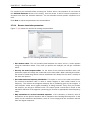
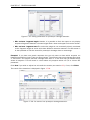
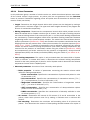
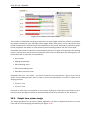
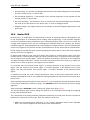
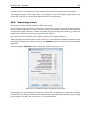
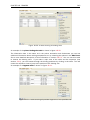
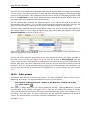
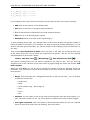
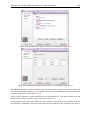
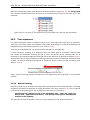
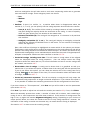
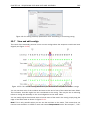
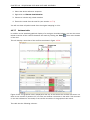
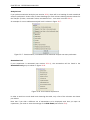
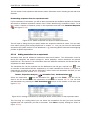
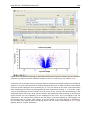
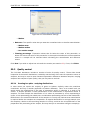
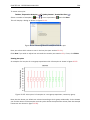
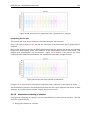
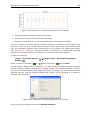
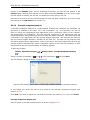
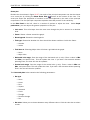
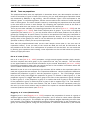
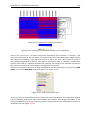
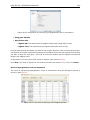
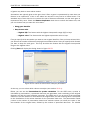
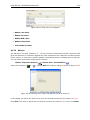
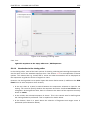
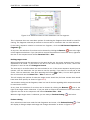
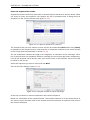
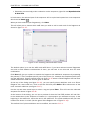
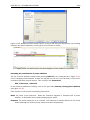
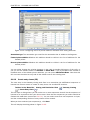
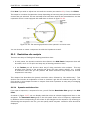
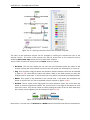
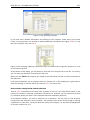
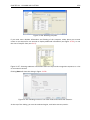
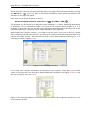
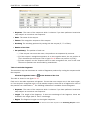
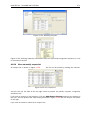
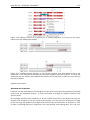
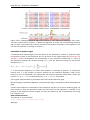
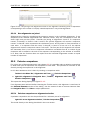
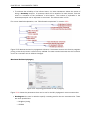
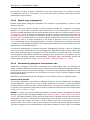
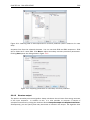
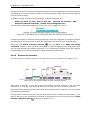
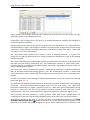
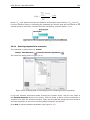
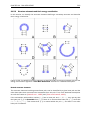
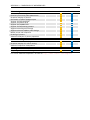
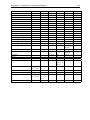
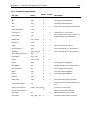
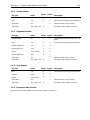
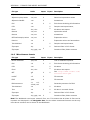
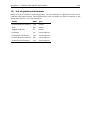
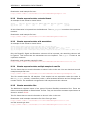
An example of protein sequence statistics is shown in figure 15.16.
Figure 15.16: Comparative sequence statistics.
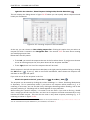
Nucleotide sequence statistics are generated using the same dialog as used for protein sequence
statistics. However, the output of Nucleotide sequence statistics is less extensive than that of
the protein sequence statistics.
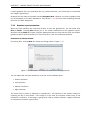
Note! The headings of the tables change depending on whether you calculate 'individual' or
'comparative' sequence statistics.
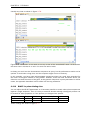
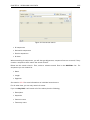
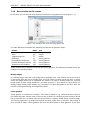
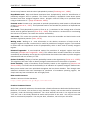
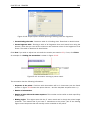
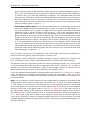
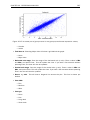
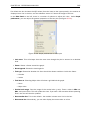
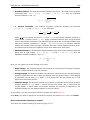
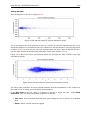
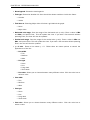
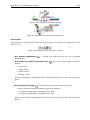
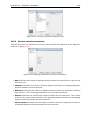
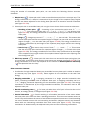
The output of comparative protein sequence statistics include:
• Sequence information:
Sequence type
Length
Organism