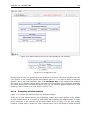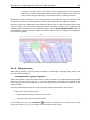
1
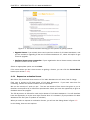
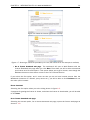
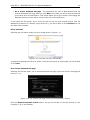
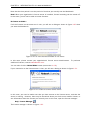
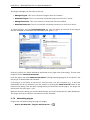
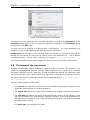
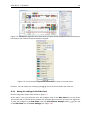
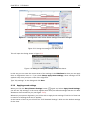
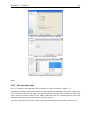
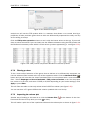
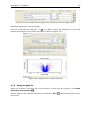
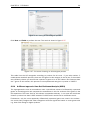
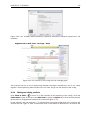
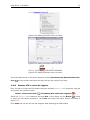
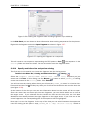
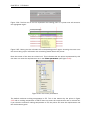
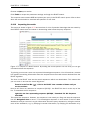
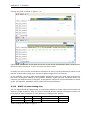
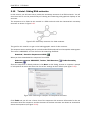
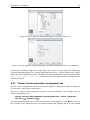
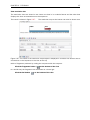
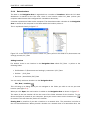
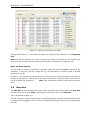
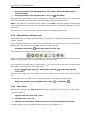
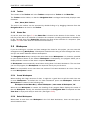
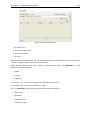
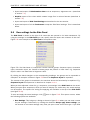
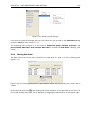
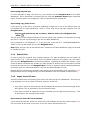
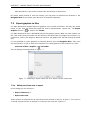
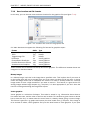
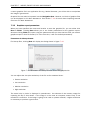
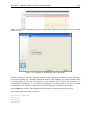
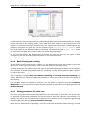
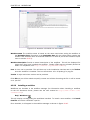
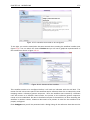
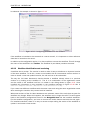
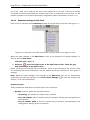
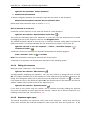
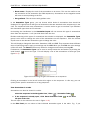
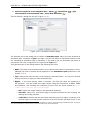
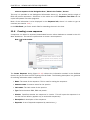
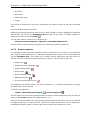
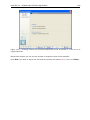
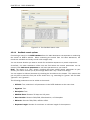
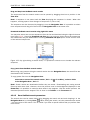
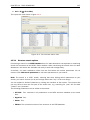
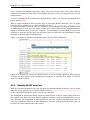
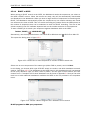
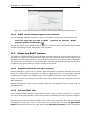
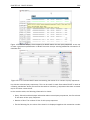
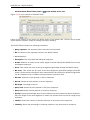
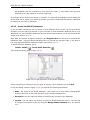
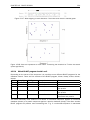
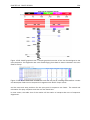
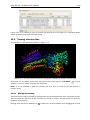
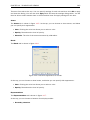
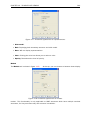
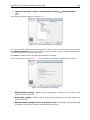
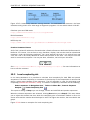
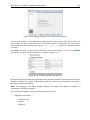
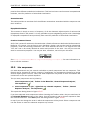
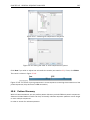
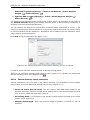
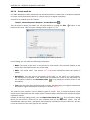
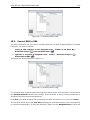
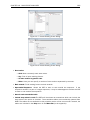
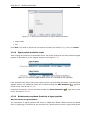
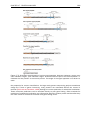
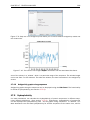
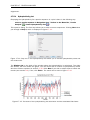
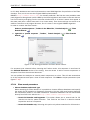
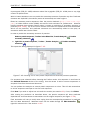
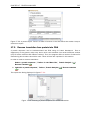
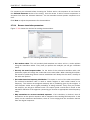
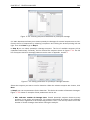
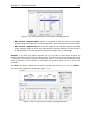
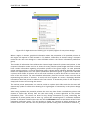
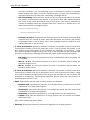
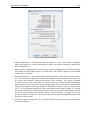
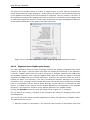
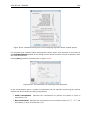
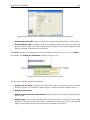
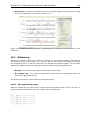
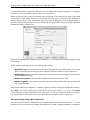
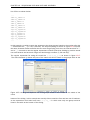
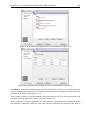
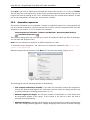
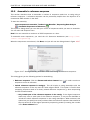
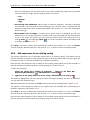
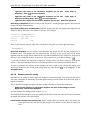
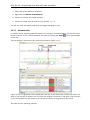
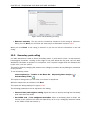
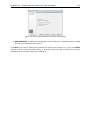
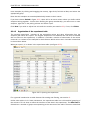
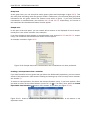
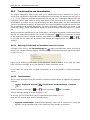
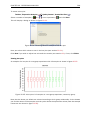
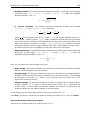
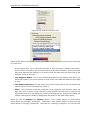
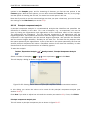
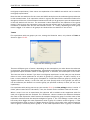
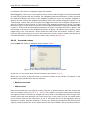
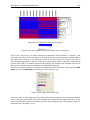
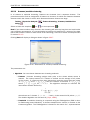
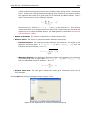
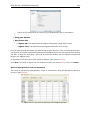
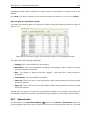
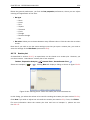
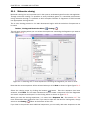
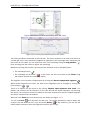
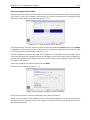
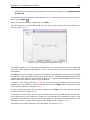
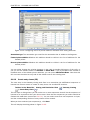
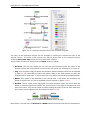
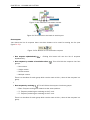
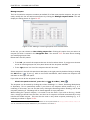
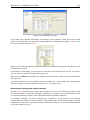
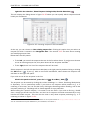
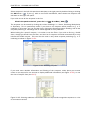
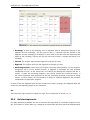
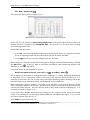
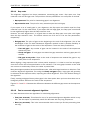
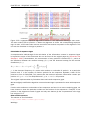
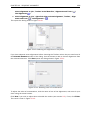
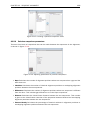
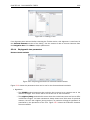
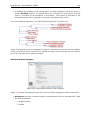
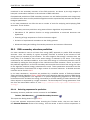
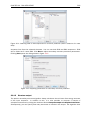
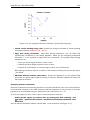
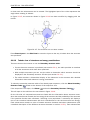
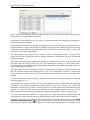
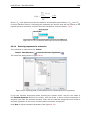
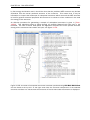
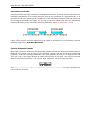
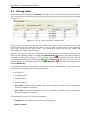
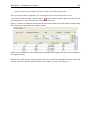
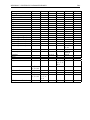
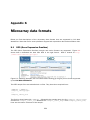
CHAPTER 20. EXPRESSION ANALYSIS
380
more samples (by clicking and dragging the mouse), right-click (Ctrl-click on Mac) and select the
appropriate group.
Note that the samples are sorted alphabetically based on their names.
If you have chosen Paired in figure 20.2, there will be an extra column where you define which
samples belong together. Just as when defining the group membership, you select one or more
samples, right-click in the pairing column and select a pair.
Click Next if you wish to adjust how to handle the results (see section 9.2). If not, click Finish.
20.1.3
Organization of the experiment table
The resulting experiment includes all the expression values and other information from the
samples (the values are copied - the original samples are not affected and can thus be deleted
with no effect on the experiment). In addition it includes a number of summaries of the values
across all, or a subset of, the samples for each feature. Which values are in included is described
in the sections below.
When you open it, it is shown in the experiment table (see figure 20.5).
Figure 20.5: Opening the experiment.
For a general introduction to table features like sorting and filtering, see section C.
Unlike other tables in CLC Main Workbench, the experiment table has a hierarchical grouping of
the columns. This is done to reflect the structure of the data in the experiment. The Side Panel is
divided into a number of groups corresponding to the structure of the table. These are described