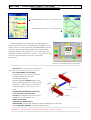
1
MEP-10A
-
Pedaling Efficiency Meter
model
10A.
Rev. June 30, 2010
Page 1 of 25
Patents MI2009U000328 and MI2009A001568
Studio A.I.P.
www.aip-mep.com
MEP system permits continuous survey of different parameters
concerning right crank arm (R with spider) and left crank arm(L)
and works out these values:
Rp and Lp FORCES (Newton) pushing downward and pulling
-
upward the crank,with percentage UP/DOWN ratio indication
involving the act of pushing and pulling on pedals.
POSTURE (OFFSET or distance from center position), l for the
-
left, r for the right pedals. These two quantities indicates the
variation of thrust positions throughout pedal spindle, in
different effort conditions.
POWER (Watt) developped on the single crank arm and on the
-
crankset
WORK (kCal) generated during a ride
-
View of the assembled crankset, with forces and offsets highlighted --Æ
These innovative parameters, concerning
the two strain gaged crank arms, are correlated with other usual
external parameters, such as:
-
HEART RATE ( HR ) in beat per minute
-
SPEED(km/h)
-
CADENCE (RPM)
-
Other data available from smartphones (e.g. GPS position)
SMARTPHONE displays all these values in different display modes. It is possible
to:
-
Keep all parameters information under control ( MAIN display mode)
-
Make real time performance analysis and record acquired data for further
analysis on computer ( GRAPH e STATISTIC display mode)
Å--
SMARTPHONE possible screenful, e.g. MAIN display mode
MEP software has been entirely developed by Studio A.I.P.srl
It is an open ended system with modular structure. As a
consequence Studio A.I.P can improve display functions and modes on customer request.
You can effect different settings by pushing [ Next ] and [ Start/Stop ] touchscreen buttons , such as:
-
Change display mode (see underneath for examples)
-
Record all your trip data, in addition with PHOTOS, TECNICAL OR PERSONAL NOTES, all of which gathered
together in acquisition files.
MEP-10A
-
Pedaling Efficiency Meter
model
10A.
Rev. June 30, 2010
Page 2 of 25
Patents MI2009U000328 and MI2009A001568
Å-- SMARTPHONE possible screenful, e.g STATISTIC mode
SMARTPHONE possible screenful, e.g. GRAPH mode
--
Æ
Besides displaying and recording data on SMARTPHONE, our
software allows more accurate and detailed data management on PC
or Mac. In this way it can communicate with SMARTPHONE; moreover,
it could be used as a direct data acquisition from the Bluetooth®
transmitter located in the crankset. E.g. you could think about the
possibility of keeping a notebook on a team car. This is useful to give
on-line real-time information to the cyclist regarding his
performances.
An example of COMPUTER displaying cyclist diagram
=======================================================================
MEP System (In the beside picture a disassembled
components view concerning the gage system) consist of:
-
Nr.2 CRANK ARMS, Left and Right,
cranklenght from 170 to 180 mm. With plugand-play connectors and electronic
strumentation integrated.
-
Separate detachable SPIDER,enabling a wide
variety of chainring patterns to be used with the
same crank. In other words, it is removable to
fit different BCDs (110, 130, 135 etc., 4 o 5
arms)
-
SPLINED BOTTOM BRACKET with Studio
A.I.P. proprietary spline interface
standard, has integrated connectors, and it’s
available in common standard size.
-
HEART RATE STRAP
-
CADENCE and SPEED sensors
-
SMARTPHONE, including MEP software, located on handlebar grip or bike stem.
-
220VAC BATTERY CHARGER
(A complete charge in 3Hrs)
=====================================================================
IMPORTANT:
Each MEP system is numbered thus assuring complete traceability.
======================================================================
MEP-10A
-
Pedaling Efficiency Meter
model
10A.
Rev. June 30, 2010
Page 3 of 25
Patents MI2009U000328 and MI2009A001568
User manual
User manual .........................................................................................................................................3
Intended product use description .....................................................................................................4
First start – MEP setup on smartphone ...........................................................................................5
Start up and shut off procedures ..................................................................................................8
Heart rate icon, speed icon, GPS tracking icon, data transmission icon,battery levels icon and
Bluetooth ® transmission icon - on MAIN page. .......................................................................8
MAIN screen – main features ......................................................................................................9
MEP stats 10s screen – main features........................................................................................12
MEP graph screen – general description....................................................................................13
MEP4 user screen.......................................................................................................................15
Special settings - passwords...........................................................................................................17
MEP-10A set up on bike................................................................................................................18
Laboratory tests - reliability...........................................................................................................25
General informations......................................................................................................................25
MEP-10A
-
Pedaling Efficiency Meter
model
10A.
Rev. June 30, 2010
Page 4 of 25
Patents MI2009U000328 and MI2009A001568
Intended product use description
MEP-10A is a new power meter system completely designed and manufactured in Italy by
Studio A.I.P.
“Studio A.I.P. srl” is an engineering test house and development laboratory whose interests
range in many fields including: surgical tooling for dentistry, R&D testing for aerospace and
automotive manufacturers and research projects within nuclear, civil and mechanical engineering.
The experience and knowledge gained through these activities is what we now use in development
of test procedures and products for the bicycle industry.
MEP-10A is essentially made up of #2 crank arms (left and right), #1 bottom bracket
spindle, #1 spider, #1 Garmin elastic strap Heart Rate sensor (Garmin p/n 010-10997-00), #1
Garmin GSC 10 Speed/Cadence Bike Sensor (Garmin p/n 010-10644-00), #1 smartphone as head
unit (with its original kit manufacturer) and a battery recharger to be inserted in the left crank arm.
After an Italian based cycling research centre contacted us for help in taking three
dimensional measurements of pedaling forces throughout the entire pedal revolution, we developed
an instrumented chainset to satisfy their clients request. But rather than simply creating a tool, we
also studied its application, pin-pointing the data which coaches and riders found most useful. With
this information in hand, the design of the MEP crank system began. At the known state of the art,
we developed an innovative device to measure cyclist significative parameters and how this power
generates on the bike.
Users can substitute their standard cranksets with MEP-10A system taking care of choosing
the right spider and/or spindle at order phase* with regards to bike owned (road bike, TT bike,
MTB), BCD or bolt circle diameter and bottom bracket shell width.*
Actually, “Studio A.I.P.srl” only furnishes the 24mm diameter spindle without Bottom
Bracket bearings. The BB bearing market is wide and almost everyone can choose its personal BB
bearing item.
Custom chainrings can be set in place on the spider. We put into evidence that different
BCD are available now in the market, so spider choice must be accurate. Spider/chainrings interface
is crucial in determining which spider to order for your MEP-10A system.
Smarphones are not water proof nor splash proof guaranteed (in this case please refer to
manufacturers notes). The other MEP-10A components are designed to accomplish IP54
specifications. By the way, MEP-10A system typical outdoor utilization is in sunny or at least dry
days without atmospherical precipitations. The smartphone operating system is a Windows
Mobile® which receives, in real time, data from the crankset. Generally speaking, every Windows
Mobile® smartphone with Bluetooth® data transmission can operate in MEP-10A system.
The smartphone is kept tightly in place on the stem or the handlebar by “Studio A.I.P.srl”
exclusive holder. A “quick release” system allows a stable and safe smartphone retain during
normal conditions use and, at the same time, a fast Smartphone release at the end of the day.
For operative and installation instructions please refer to “MEP-10A system assembly
instructions”.
MEP-10A
-
Pedaling Efficiency Meter
model
10A.
Rev. June 30, 2010
Page 5 of 25
Patents MI2009U000328 and MI2009A001568
First start – MEP setup on smartphone
Warning: it is necessary to read Preliminary operations before switching on MEP-10A
system for the first time.
At first start up smartphone enables the
MEP software automatic launch .
A first screen appears to User. It displays
several icons and functions whose features will
be described later on in Chapter “MEP software
– system description and main features”.
Aiming to guarantee maximum rider
performances, it is important to make some
custom settings on MEP-10A system just before
riding the bike.
Fundamental paramenters are under
password status because it restricts any changes
in settings. Password must be inserted after Next
button has been pushed for 5 sec. A touchscreen
keyboard allows numerical value to be inserted.
The MEP setup window appears as in the
following figure (see below).
The table underneath shows the meaning of every symbol used in MEP setup window.
MEP-10A
-
Pedaling Efficiency Meter
model
10A.
Rev. June 30, 2010
Page 6 of 25
Patents MI2009U000328 and MI2009A001568
Symbol
1
mmR
2
3
4
5
mmL
KEYB off
V1 - V3
V2 - V4
6
7
8
9
10
11
12
OZR
OZL
WDmm
OFFmm
PLmm
SECsv
CADext
13
14
15
16
17
18
19
20
21
SENS
MEDfi
Km
Cd
Vel
HR
VBt
Demo
Bx-Bg-Dv
Meaning
distance (in mm) at which the Right pedaling force is applied along
the pedal axle, measured from OFFmm
distance (in mm) at which the Left pedaling force is applied along the
pedal axle, measured from OFFmm
Pushing this button cause the keyboard to disappear
forces R/L (Right/Left) in Newton
Torsional Moment R/L in Nmm
Offset (in BIT) to accomplish zero pass of Right torsional moment
line
Offset (in BIT) to accomplish zero pass of Left torsional moment line
Wheel diameter in mm (default value 672mm)
Center pedal offset, it defines offset ZERO values (default 50mm)
Crank arms lenght (in mm)
Data rate savings (from 1 to 1000, def. 5sec)
Tick in square box to achieve data from External sensor (GARMIN)
Cadence sensor: 0 = Int; 1= Int. Invert; 2=Soft. Mode1; 3= Soft.
Mode2
Mean or smoothing filter
Total km ridden
cadence (rpm)
speed (km/h)
heart rate (bpm)
MEP Battery level (charge in percentage)
Tick in square box to enable “Demo mode”
Debug data (only for Studio AIP internal purposes)
Table parameters form 8 to 14 have to be defined by custom under Password level. Studio
A.I.P. provide default values for these parameters, whose values appear in the upper table. Click on
the parameter to be modified and set a new value by the touch screen keyboard. The following are
parameters meanings:
• WDmm is wheel (plus tire!) diameter expressed in mm; it’s necessary to calculate
speed;
• OFFmm defines zero point value as distance from the point of force application on
pedal to its clamping end in the crankarm;
• PLmm is crank lenght value (in mm) to insert in accordance with the real value (you
can easily rotate the dodecagon to get your favourite crank length from 170 to
180mm);
• SECsv is related to recording data rate on file; it is strongly recommended to keep
this value proportional to recording time (e.g. low values with tests lasting several
minutes, and higher values for hours-lasting tests)
• CADext Tick in square box to achieve data from External sensor (GARMIN); when
this cadence sensor is correctly set up, you’ll receive and visualize data from it;
• SENS shows how to elaborate cadence: 0 and 1 give internal cadence as read by the
right crank arm; 2 and 3 (set as default) give cadence as result of calculations – that
is distance between two following force peaks;
• MEDfi introduce a mean filter. By setting 1 you’ll get data for every single pedal
stroke; by increasing this value, readings will be affected by a MEDfi (value) filter.
This parameter only affects PMED quantity on MAIN and MEP4 user pages.
Once custom setup has been completed, “KEYB off” button will cause the keyboard to
disappear.
MEP-10A
-
Pedaling Efficiency Meter
model
10A.
Rev. June 30, 2010
Page 7 of 25
Patents MI2009U000328 and MI2009A001568
Moreover, you can tick in DEMO square box to enable “Demo mode”: WARNING – all
data read and displayed in this mode are fake!
In addition to this, user can reset total ridden km by keeping pushed “User button” (total km
in MEP-STATs 10s screen will be reset).
The remaining parameters cannot be modified by end-user; user can only see these
parameters on screen.
To exit “MEP setup window” user need to keep Next button pushed for 5 sec. Then you’ll
be back to Main page.
MEP-10A
-
Pedaling Efficiency Meter
model
10A.
Rev. June 30, 2010
Page 8 of 25
Patents MI2009U000328 and MI2009A001568
MEP software – description and main features
MEP smartphone software allows users to visualize and interact with forces developped
throughout the entire pedal stroke. Studio A.I.P. design team chose to use a proprietary application
running on a Windows enabled Smart Phone as the MEP rider interface. The three analysis screens
of the smart phone application give detailed numerical and graphical displays of current
performance data, graphical history of key values and detailed graphs of force and power
throughout a single pedal stroke.
Raw power and offset data is then beamed to a smart phone running AIP’s proprietary
application via Bluetooth® while data from HR sensor and cadence/velocity sensor is sent by
ANT+ protocol though wireless transmitters located in the right crank.
Start up and shut off procedures
1. Switch on the smartphone and wait until MEP automatic application starts up
2. Start to pedal in order to activate MEP cranks’transmission data.
3. If the “MEP DISCONNECTED” message pops up no data has been transmitted to
the smartphone receiver. The just press “YES-Retry”.
4. Press X icon (upper right screen portion)or LINK BT icon to shut down.
Alternatively, hold on/off smartphone button to shut down.
Heart rate icon, speed icon, GPS tracking icon, data transmission icon,battery levels icon and Bluetooth
® transmission icon - on MAIN page.
HRM
SPEED
GPS
ACQ
BATT
LINK BT
The above icons show effectiveness in quantity transmission between the cranks and the
smartphone. Starting from the left side, we see:
HRM - receiving data from Heart rate sensor
SPEED – data from wheel speed sensor
GPS – Global postioning system data acquired.
ACQ – icon blinking as a new data session starts
BATT – battery charge levels (dark green relative to Smartphone one, light green for MEP
Crankset battery)
LINK BT – live data transmission is on (via Bluetooth®).
Lack of one or more of these icons means relative sensor absence (e.g. no HRM icon means
lack of HR elastic strap), otherwise there could be some kind of connection problems (e.g.
electromagnetic fields interferences, noise).
It is necessary to see SPEED, LINK BT, BATT (above min level battery) and ACQ icons in
order to get MEP-10A system working correctly.
MEP-10A
-
Pedaling Efficiency Meter
model
10A.
Rev. June 30, 2010
Page 9 of 25
Patents MI2009U000328 and MI2009A001568
MAIN screen – main features
Few moments after smartphone has been run – please refer to Start up and shut off
procedures for more details– MAIN screen is the first page to appear.
•
POWER bar graphs
The first graphs in the upper part of the screen are POWER bar graphs.
The red bars within are proportional to amount of power developed by each leg. Left bar is
relative to left leg power measurement, right one is realtive to right leg power measurement. Below
each bar graph you can see power numerical value (in Watts).
At center of the window the numerical value (in big size font) expresses total power in
Watts: it is the summation of left and right maximum powers throughout the pedal stroke. Total
Watts read correspond to total power generated by an entire pedal stroke if MEDfi =1; otherwise, if
MEDfi>1, then Total Watts is the average power generated throughout the number MEDfi pedal
strokes.
MEP-10A
•
-
Pedaling Efficiency Meter
10A
model
.
Rev. June 30, 2010
Patents MI2009U000328 and MI2009A001568
Page 10 of 25
POSTURE bar graphs
POSTURE bar graphs are located just below POWER bar graphs.
These two horizontal bar graphs are relative to offsets from ideal thrust position, that is the
most efficient point in which force is applied to pedal. We remind final users that it is a matter for
biomechanicists and phisiologists to determine this “ideal thrust position”. As a consequence, center
pedal offset or ideal thrust position is an user defined value. (look at “First start – MEP setup on
smartphone” to set it ).
Looking at POSTURE bar graphs in more details, on one hand bars become red as force is
applied externally towards ideal thrust point. In other words, rider approximately pushes on pedals
with the external part of his feet. On the other hand, bars become blue when force is applied
internally to ideal thrust point. Eventually, bar collapses into a (no color) line when rider pushes (or
pulls) exactly on the ideal thrust center. The farther thrust position moves from ideal thrust position,
the wider the bar becomes in size.
In addition to this, these distances (in mm) are shown just below these two bar graphs.
•
%UP/DOWN ratio bar graphs
The last graphs, starting from the upper part of the screen, are %UP/DOWN ratio bar
graphs. These graphs show how riders push and pull on right and left pedals throughout an entire
pedal stroke.
As always, bar graphs are two (one relative to left crankarm forces’ratio, the second one to
right crankarm forces’ ratio) and they represents the ratio between maximum pulling force (i.e. max
force read from bottom dead center –BDC- approximately 6 o'clock to top dead center – TDCapproximately 12 o'clock) and maximum pushing force (i.e. max force read from TDC to BDC).
Studio AIP especially created these two bargraphs to increase athlete legs’ performances during the
“pulling phase”.
A green bar has been assigned to positive up/down ratio, thus putting into evidence rider’s
progresses in the pulling phase (in other words, green bar corresponds to positive contribution in
power generation during the pulling phase); on the contrary, red bar is relative to negative pulling
force, thus a force that actually dissipates rider’s energies.
Besides these graphs, there are two blue separated numerical values relative to max forces
read in the last pedal stroke. These dimensional values (expressed in Newtons) are the real forces
involved throughout pedal stroke; in fact, black values within bar graphs are non-dimensional or
percentage values.
•
BUTTONS and standard data
Looking at the bottom portion of the screen, there are several important data that can be
compared with power development and characterization. These 4 instantaneous quantities are
realtive to rider’s activity on pedals; we get in this order: HR (Heart rate, number of heartbeats per
minute, bpm), Kmh (instantaneous speed in km/h), Cad (cadence, number of revolutions of the
crankset per minute), and Alt (altitude) or elevation, the height above sea level.
There are 2 buttons beside those 4 istantaneous quantities. We remind that Smartphone has a
touchscreen, therefore it’s possible to touch softly buttons by finger, or in case, by stylus pression.
Consequently, To move to next page, just push Next button.
In addition to this, a 5 second prolonged pression on Next button involves a smart yellow
window to pop up.
MEP-10A
-
Pedaling Efficiency Meter
10A
model
.
Rev. June 30, 2010
Patents MI2009U000328 and MI2009A001568
Page 11 of 25
Start/Stop button allow User to start or stop saving data during a session. Typically, by
holding it for roughly 3 sec. data storage begins. On the contrary, just hold on pressure on this
button for 3 sec. to stop data storage. A new file has just been created. It is a csv file with this
following aspect:
S_xxxxxx_yy-yy:
S = session file
xxxxxx = date (dd-mm-yy)
yy-yy = time (hh-mm) at which data storage begins
MEP-10A
-
Pedaling Efficiency Meter
10A
model
.
Rev. June 30, 2010
Patents MI2009U000328 and MI2009A001568
Page 12 of 25
MEP stats 10s screen – main features
The second page in order of appearance is MEP stats 10s screen.
Every 10 secs quantities in this page get refreshed. Starting from the top left corner of page
we see:
•
•
•
•
•
Energy consumption – amount of Kcal consumed by the rider since data storage
(start/stop button on main page) has begun. In this graph we see energy consumption
increments at 10 sec intervals.
Average power – Watt generated at bottom bracket spindle. In this graph we see
energy consumption increments at 10 sec intervals.
Average speed – in Km/h updated every 10s.
Elapsed time since data storage has begun (hh:mm:ss).
Distance covered: partial, since data storage (Start/Stop button) and total.
Moreover, in bottom part of the page we measure the same quantities as in first Main
screen. The only difference is Reset button in place of the Start/stop one. Hold soft finger pressure
on Reset button to set to zero Kcal, POW, Kmh, ELT and partial Km quantities.
MEP-10A
-
Pedaling Efficiency Meter
10A
model
.
Rev. June 30, 2010
Patents MI2009U000328 and MI2009A001568
Page 13 of 25
MEP graph screen – general description
The third screen to appear to User is MEP graph screen. Let’s see it in details.
In this screen page the rider’s last entire pedal stroke appears. To get the most out of riders
cycling, we need to analyze pedal stroke and identify the weak spots, therefore we have to be
concerned about this page. There's more involved with efficient pedaling than just pushing
downward with a lot of force!
The graph is refreshed at every single entire pedal stroke. Visulization begins with right
crank arm at 12 o’clock (TDC) or, in other words, right pedal in its highest possible point. As you
can note in the figure above, force developed on right pedal is shown with a blue line, while force
developed on the left one with a red line.
User can always switch to PowerArea mode in which it is possible to evaluate how rider’s
pedaling technique affects total power generation throughout entire pedal stroke. Please note that
this is not the average power seen in MAIN and STATS 10s screen pages. Looking at Power Area
mode, users can appreciate how total (Left and right together) power has been generated throughout
a single pedal stroke.
It’s ever possibile to go back to Force L+R mode by pushing ForceL+R button.
In addition to this, by pushing “Camera” icon User can switch to camera mode and take a
picture of the panorama or place in which he stands at that moment and where he records force
profile throughput the single pedal stroke. At a first finger pressure a viewer appears on screen.
Then, pressing twice, user can shoot the photo.
Press once Save button to record data from force and power profile relative to a single pedal
stroke in that precise moment. It is a csv file with this following aspect:
T_xxxxxx_yy-yy-yy
T = single turn file (single pedal stroke, left and right legs)
xxxxxx = date (dd-mm-yy)
yy-yy-yy = time (hh-mm-ss) at which data is collected
MEP-10A
-
Pedaling Efficiency Meter
10A
model
.
Rev. June 30, 2010
Patents MI2009U000328 and MI2009A001568
Page 14 of 25
User can access data stored either via Bluetooth® or USB cable and ActiveSync
connection. Data are stored in folder: My Documents/Mep/Dati on Smartphone hard disk.
(Bluetooth® settings on Windows Mobile 6.1+ smartphones : PAIRING code = 0000 Com Port =
6 ).
MEP-10A
-
Pedaling Efficiency Meter
10A
model
.
Rev. June 30, 2010
Patents MI2009U000328 and MI2009A001568
Page 15 of 25
MEP4 user screen
This screen has been especially studided for MEP “on the road” users. Rider’s attention
must be focused on max. 3-4 quantities at a time.
In the figure below, we can see a visualization of this screen.
Note that each window has several quantities to compare and it’s ever possible to choose the
ones that are right for you. With a soft touch on the screen, user can determine which quantities to
visulize.
In the next paragraphs we will thoroughly discover each window.
•
POWER window
In the upper part of the screen we see Power Window. Visualization choice is limited to
single pedal stroke total power PTOT and average power PMED (set MEDfi parameter to compute an
average on chosen amount of pedal strokes, please refer to MEP setup paragraph for more details).
As always, Power is measured in Watts.
MEP-10A
•
-
Pedaling Efficiency Meter
10A
model
.
Rev. June 30, 2010
Patents MI2009U000328 and MI2009A001568
Page 16 of 25
L&R MEP quantities window
In this section of the screen, so called “Left and Right quantities window”, we can see
istantaneous quantities relative to user efforts’ nature and quality on the pedals, acting on both Left
(L) and Right (R) pedal.
Possible choice is among these parameters (in the order):
• FL e FR: active forces (component of real force acting on pedal, perpendicular to
crankarm symmetry plane) generating motion (expressed in Newton)
• PL e PR: peak power generated by Left and Right legs (Watt)
• OFL e OFR: offsets (in mm), distance from ideal thrust center to crankarm. Ideal
thrust center can be user defined (please refer to paragraph First start – MEP setup
on smartphone).
• UDL e UDR: ratio between maximum pulling force (i.e. max force read from bottom
dead center –BDC- approximately 6 o'clock to top dead center – TDCapproximately 12 o'clock) and maximum pushing force (i.e. max force read from
TDC to BDC) throughout a single complete pedal stroke.
User can determine which quantity to visualize among these 4 couples just shown. Therefore, it’s
possible to monitor omogeneous quantities: forces, power contributions, distances or ratios.
•
Standard quantities window
The last box in the screen can show:
• Cad: cadence (rpm)
• Km/h: istantaneous speed (in Km/h)
• HR: hearth rate (whether hearth rate sensor is on)
• Alt: altitude, received from smartphone GPS integrated sensor.
• Kcal: energy consumed by the rider since data storage has begun.
Ultimately, in the lowest part of the screen there are some fixed (not user definable)
parameters as total distance covered (km) and elapsed time (hh:mm:ss) since data storage begun
(for more details, look at Main Screen – main features paragraph).
MEP-10A
-
Pedaling Efficiency Meter
10A
model
.
Rev. June 30, 2010
Patents MI2009U000328 and MI2009A001568
Page 17 of 25
Special settings - passwords
MAIN screen is the first page to appear. From MAIN screen it is possible to access to several
special hidden windows/pages under password. By holding Next button pushed for 5 secs., user can
access to these special settings pages.
In the yellow box below, user can insert the right password by using onscreen keyboard.
Insert:
•
- user can set to zero eventual parasitic loads on both crankarms. Warning:
this procedure must be accomplished by qualified users only , SEE BELOW*. As a
matter of fact, all force readings (e thus power readings intimately correlated to
forces) will be further on affected by this zero setting. This must be considered an
exceptional procedure only to be executed with MEP cranks experiencing heavy
shocks or stresses.
•
1122 - it is so possible to get “GPS tracking” positioning data acquisition (only
available with integrated GPS antenna Smartphones)
1111
*While inserting “zero load password”, it is necessary to tightly keep the bike as steady as
possible with MEP already set up in place, and MEP system kept in vertical position (one crankarm
pointing to 6 o’clock, the other one at 12 o’clock). In addition to this, it is fundamental that
crankarms withstand no costraint or load (i.e. avoid to lay weights on the two crankarms except for
two set up bike pedals). Be sure that both crankarms are parallel to the ground: only at this point it
is possible to set residual loads to zero!
•
3333
- it is possible to adjust User settings. Please refer to First start – MEP setup
on smartphone paragraph for further details.
MEP-10A
-
Pedaling Efficiency Meter
10A
model
.
Rev. June 30, 2010
Patents MI2009U000328 and MI2009A001568
Page 18 of 25
MEP-10A set up on bike
MEP-10A system is, as described in introductory chapter “Intended product use
description”, essentially made up of #2 crank arms (left and right), #1 bottom bracket spindle, #1
spider, #1 Garmin elastic strap Heart Rate sensor (Garmin p/n 010-10997-00), #1 Garmin GSC 10
Speed/Cadence Bike Sensor (Garmin p/n 010-10644-00), #1 smartphone as head unit (with its
original kit manufacturer) and a battery recharger to be inserted in the left crank arm.
Let’s look at the mounting procedure to assemble mechanical components of MEP system
(i.e. the two crankarms, bottom bracket spindle and the spider). In the next few lines a procedure is
shown to replace original customer crankset with MEP system’one.
In the following picture there are all mechanical MEP-10A components with #3 M5x20 hex
socket cap screws and #2 M6x40 hex socket cap screws which keep all components tight to one
another and to the bike. In the upper right hollow of the case there is the battery charger for crankset
battery (to be inserted into left crank arm). Just below the battery charger we see the Studio AIP
patented X10A Smartphone holder.
Figure 1 – MEP mech. components
In figure 1 center there is a 5 arms spider (in this case with typical Shimano 130mm BCD)
with #3 M5x20 hex socket cap screws already inserted into holes. These screws keep the spider
tightened to right crank arm.
In figure 2, let’s pay attention to right crank arm assembly on spider: it will be necessary to
screw these 3 bolts till pre-set torque (see table below). Looking at the right crank arm, we see 2
pins leaning out from it. Users have to match these pins with the two corresponding holes into the
spider. Once the spindle will be set in place into right crank arm (please see following paraghaphs)
and M6 screw tightened (important issue!) to ensure crank arm-spindle assembly, then it will be
possible to screw the 3 M5 bolts till pre-set torque value.
MEP-10A
-
Pedaling Efficiency Meter
10A
model
.
Rev. June 30, 2010
Patents MI2009U000328 and MI2009A001568
Table 1 – Use torque wrench to ensure bolts and screws
Screw
M5
Figure 2 – Spider set up on right or driving crank arm
Figure 3 – Spindle set up on driving crank arm
Tightening torque (Nm)
8
Page 19 of 25
MEP-10A
-
Pedaling Efficiency Meter
10A
model
.
Rev. June 30, 2010
Patents MI2009U000328 and MI2009A001568
Page 20 of 25
Once spider has been set up on right crank arm, it is necessary to connect the BB spindle via
a one-way-fit spline into the splined hollow of right crank arm. The splined connection between the
crank and axle component cannot be assembled or incorrectly aligned, protecting the integrated
connectors from damage caused by incorrect assembly. Therefore we have both a mechanical and
electronical mounting, in which male pins in crank match their female housing in the spindle
connector. This electronic connection is fundamental to guarantee power supply to the crankset and,
at the same time, data trasmission to electronic device (smartphone or pc). All electronics are
protected from moisture by full contact seals ensuring trouble-free operation whatever the weather.
Figure 4 – Chainrings mounting on spider arms.
Chainrings mounting (2 or 3 units) is one of the two connection phases between bike and
MEP system, thus this operation might be delicate. When the order was made, customer specified
BCD (bolt circle diameter, relative to chainrings); care must be taken to precisely match chainrings
and spider as in figure 4. Once chainrings are set up in place, screw tightly those 5 bolts to get a
steady connection.
Number of chainrings, kind, chainring size can be chosen by Customer. The only parameter
to look after is BCD.
Table 2 - Use torque wrench to ensure bolts and screws
Vite
M6
Tightening torque (Nm)
14
MEP-10A
-
Pedaling Efficiency Meter
10A
model
.
Rev. June 30, 2010
Patents MI2009U000328 and MI2009A001568
Page 21 of 25
Figure 5 - Bloccaggio pedivella destra su perno centrale
To ensure a steady assembly between crank arm and spindle, it is necessary to insert the M6
hex socket cap screw into the lateral hollow in the crank arm (see fig. 5). Then the screw have to be
tightened (clockwise) till pre-set torque (see table 2). At this point the #3 M5 hex socket cap screws
(joining right crank arm to spider) must be firmly tightened as well (see table 1).
Once steps from Fig. 1 to 5 have been accomplished, MEP assembly can be mounted on the
bike. Bike’s look in BB shell zone with external BB bearings is shown in figure 6 below.
Figure 6 – Bike’s look in BB shell zone just before MEP set up in place
MEP-10A
-
Pedaling Efficiency Meter
10A
model
.
Rev. June 30, 2010
Patents MI2009U000328 and MI2009A001568
Page 22 of 25
In fig. 6 it’s possible to notice a carbon bike frame with external BB bearings (with 24mm
ID internal diameter). A so looking frame is suitable to house a MEP-10A system.
Figure 7 – MEP system into BB shell with external BB bearings
In figure 7 MEP system (so far comprising spider, right crank arm, Customer chainrings
and spindle all tightened together) is shown mounted on the bike. To do so, it’s necessary to insert
MEP-10A
-
Pedaling Efficiency Meter
10A
model
.
Rev. June 30, 2010
Patents MI2009U000328 and MI2009A001568
Page 23 of 25
the free end of the spindle into BB shell with external bearings (please keep in mind that BB cups
must have a 24mm internal diameter on both faces to house MEP spindle). Depending both on BB
shell width (common values from 68 to 73mm) and on cups width, it might be necessary to put
some spacers or OR along the spindle between crank arms and cups to avoid annoying axial
clearance.
Working on the left side of the bike frame, there’s still one last operation to be made to
fulfill MEP system assembly. Please carefully catch and insert left crank arm into free side of the
spindle leaning out BB shell. Insertion is completed when left crank arm is fully in contact with the
spindle. In this way the remainig M6 hex screw can be inserted and tightened till pre-set torque.
(Please refer to table 2 to tightening torque value).
MEP-10A system assembly is now completed.
MEP-10A
-
Pedaling Efficiency Meter
10A
model
.
Rev. June 30, 2010
Patents MI2009U000328 and MI2009A001568
Page 24 of 25
Figure 8 – Left crank arm inserted, MEP system fully assembled
Please remember:
1. to screw Customer pedals into crank arms’threaded hole before start using MEP
system. (9/16” UN right-side hole is right-hand threaded, vice-versa for the left one)
2. to engage every link of the chain as it passes over on the chainring!
MEP-10A
-
Pedaling Efficiency Meter
10A
model
.
Rev. June 30, 2010
Patents MI2009U000328 and MI2009A001568
Page 25 of 25
Laboratory tests - reliability
MEP-10A system must undertake a lot of laboratory tests. According to UNI EN 14766 par.
4.13.7 (mountain bike), UNI EN 14781 par. 4.12.7 (racing) e UNI EN 14764 par. 4.13.7 (city bike
and trekking), MEP system successfully passed through all these fatigue tests.
General informations
All general and technical infos contained in this manual are stricltly effective for MEP-10A
system. They are continuously kept up to date by Studio AIP technicians and engineers and are
subjected to changes without prior notice Therefore, Studio A.I.P.srl declines any responsibility for
differences in this present user manual from real system.
For further and more updated informations on MEP system, including PC and smartphone
software, we kindly invite you to visit our web site: www.aip-mep.com