1
User’s Reference Manual
Half Frame Plots
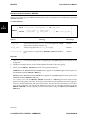
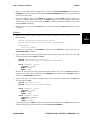
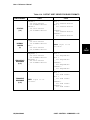
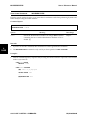
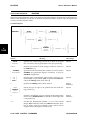
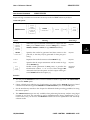
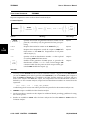
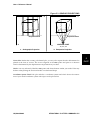
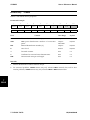
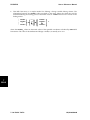
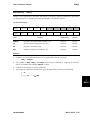
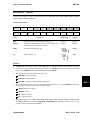
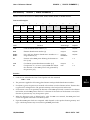
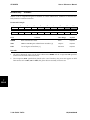
When you request half frame plots, each frame has a slightly different form:
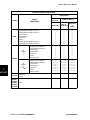
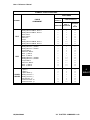
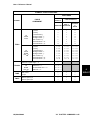
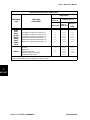
grid_id(top_resp_code,bot_resp_code)
or
elem_id(top_resp_code,bot_resp_code)
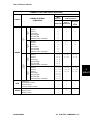
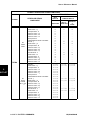
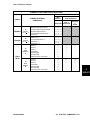
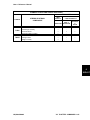
where, as before, the grid_id or elem_id specifies the GRID point or element from which response data will be obtained. Now, however, there are two resp_codes; one that will be plotted
on the top half frame, and one that will be printed on the bottom half frame. If some GRID point or
element responses are not to be plotted in one of the half frames, then the resp_code is omitted as
in:
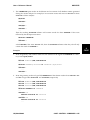
101(T1,),201(T2,T3)
or
55(,3),56(3,7)
Note that the comma must always be present in the resp_code list.
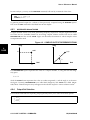
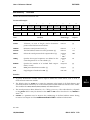
CORRELATION Plots
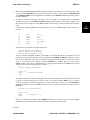
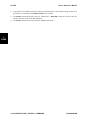
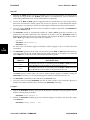
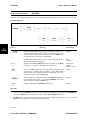
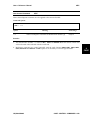
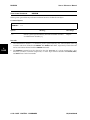
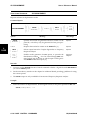
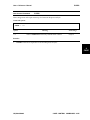
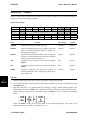
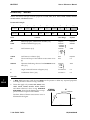
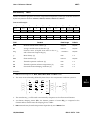
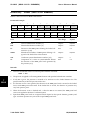
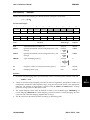
Recall that when you create correlation plots you are plotting one response quantity against another. Therefore, you must specify the X-axis and Y-axis response quantities. This is done using:
grid_or_elem_id_1(top_resp_code_1,bot_resp_code_1) VS
grid_or_elem_id_2(top_resp_code_2,bot_resp_code_2)
6
XYPLOT
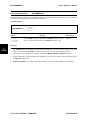
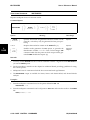
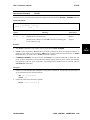
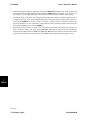
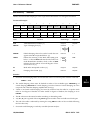
The resp_codes must match the type of the response that you requested for the X-axis and Y-axis
in the XYPLOT command. For eaxmple, to plot the T1 displacement of GRID 101 against the T2
displacement of GRID 201, you could request:
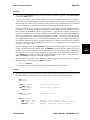
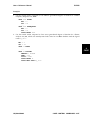
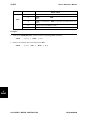
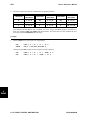
XYPLOT CORRELATION DISP VS DISP / 101(T1) VS 201(T1)
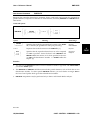
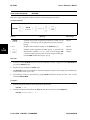
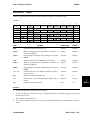
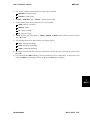
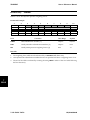
All rules regarding whole and half frame plots also apply to the CORRELATION plots.
6-10 X-Y PLOTTER COMMANDS
UAI/NASTRAN