1
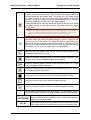
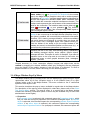
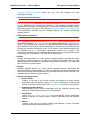
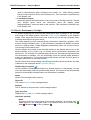
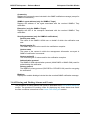
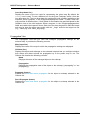
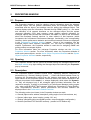
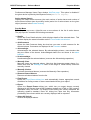
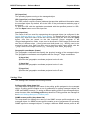
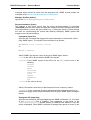
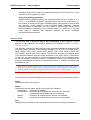
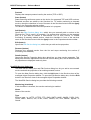
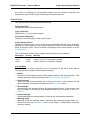
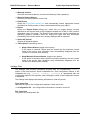
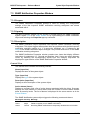
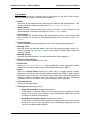
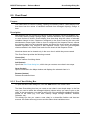
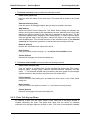
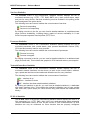
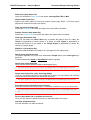
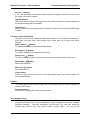
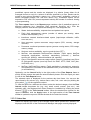
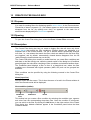
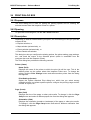
MG-SOFT Net Inspector — Reference Manual Client Preferences Dialog Box Show memory usage in status bar (checkbox) If this checkbox is checked, the main window status bar displays the amount of memory used and the total amount of memory available to the Net Inspector Client. Show only one object properties window (checkbox) If this checkbox is checked, only one object Properties window can be open at a time. Otherwise, more than one Properties window can be displayed at the same time, each showing properties of a different object. Show server localization (code page) in status bar (checkbox) If this checkbox is checked, the main window status bar indicates the code page the Net Inspector Server which the Client is connected to is using, i.e., “EN” for English (US), or “SL” for Slovenian. Note that this determines the set of characters that can be used in Net Inspector Client and in the file system on which Net Inspector runs (characters used for naming folders and files). Characters from the English code page can be used regardless of the Net Inspector Server localization (code page used), while international characters can be used only if the server uses the corresponding code page. For example, if localization is “SL”, only characters from the Slovenian and English code page may be used. 8 Show warning when input characters do not match server code page (checkbox) If this checkbox is checked, a warning message box is displayed if you attempt to input characters not found in the English (US) code page or the code page used by Net Inspector Server (if different from English (US)). Show warning when disabling objects (checkbox) If this checkbox is checked, a warning message box is displayed when you disable (stop monitoring) managed objects. The warning message notifies you that by disabling objects, their alarm information may be lost. Show link traffic (checkbox) If this checkbox is checked, the thickness and color of lines connecting managed objects automatically change, visualizing the current connection status (up or down) and traffic (data throughput and interface in/out utilization). The width of a connection line automatically increases with increasing connection data throughput (bitrate) and its color automatically changes from black to pale red with increasing link utilization. If a link is down, the color of the connection line is pure red. The status and traffic is shown only for connections between those objects that support SNMP MIB-II Interfaces table and for which the endpoint interfaces are known. Displaying the status and traffic can also be enabled or disabled by enabling or disabling the Interface nodes option available in the Graphics toolbar. Maximum value for connection traffic: X Mbps (input line) Integer value that defines the maximum link speed in the monitored network (e.g., 100 Mbps or 1000 Mbps, …). For example, if this value is set to 100 Mbps, the thickest connection line will be displayed when the corresponding traffic (either inbound or outbound data throughput) reaches 80 Mbps. Max. number of events/alarm per page in Search tab (input line) Integer value that defines the maximum number of events or alarms per page shown in the Search tab in the Events window. 216