1
CodeWarrior Development Studio for
Power Architecture Processors
Targeting Manual
Document Number: CWPADBGUG
Rev. 10.5.0, 06/2015
CodeWarrior Development Studio for Power Architecture Processors Targeting Manual, Rev. 10.5.0,
06/2015
2
Freescale Semiconductor, Inc.
Contents
Section number
Title
Page
Chapter 1
Introduction
1.1
Release notes...................................................................................................................................................................19
1.2
Contents of this manual.................................................................................................................................................. 19
1.3
Accompanying documentation....................................................................................................................................... 20
1.4
PowerPC Embedded Application Binary Interface........................................................................................................ 21
1.5
CodeWarrior Development Studio tools.........................................................................................................................22
1.6
1.5.1
Eclipse IDE........................................................................................................................................................ 22
1.5.2
C/C++ compiler..................................................................................................................................................23
1.5.3
Assembler...........................................................................................................................................................23
1.5.4
Linker................................................................................................................................................................. 24
1.5.5
Debugger............................................................................................................................................................ 24
1.5.6
Main standard libraries.......................................................................................................................................25
1.5.7
CodeWarrior Profiling and Analysis tools.........................................................................................................25
CodeWarrior IDE............................................................................................................................................................26
1.6.1
Project files........................................................................................................................................................ 27
1.6.2
Code editing....................................................................................................................................................... 27
1.6.3
Compiling...........................................................................................................................................................27
1.6.4
Linking............................................................................................................................................................... 28
1.6.5
Debugging.......................................................................................................................................................... 28
Chapter 2
Working with Projects
2.1
CodeWarrior Bareboard Project Wizard.........................................................................................................................29
2.1.1
Create a CodeWarrior Bareboard Project Page..................................................................................................30
2.1.2
Processor Page................................................................................................................................................... 31
2.1.3
Debug Target Settings Page............................................................................................................................... 32
2.1.4
Build Settings Page............................................................................................................................................ 34
2.1.5
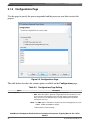
Configurations Page........................................................................................................................................... 35
CodeWarrior Development Studio for Power Architecture Processors Targeting Manual, Rev. 10.5.0,
06/2015
Freescale Semiconductor, Inc.
3
Section number
2.1.6
2.2
2.3
2.4
Title
Page
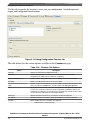
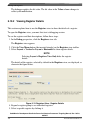
Trace Configuration Page.................................................................................................................................. 37
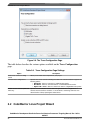
CodeWarrior Linux Project Wizard................................................................................................................................38
2.2.1
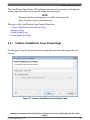
Create a CodeWarrior Linux Project Page.........................................................................................................39
2.2.2
Processor Page................................................................................................................................................... 40
2.2.3
Build Settings Page............................................................................................................................................ 42
2.2.4
Linux Application Page..................................................................................................................................... 43
Creating projects............................................................................................................................................................. 45
2.3.1
Creating CodeWarrior Bareboard Application Project...................................................................................... 45
2.3.2
Creating CodeWarrior Bareboard Library Project.............................................................................................49
2.3.3
Creating CodeWarrior Linux Application Project............................................................................................. 51
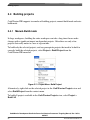
Building projects.............................................................................................................................................................54
2.4.1
Manual-Build mode........................................................................................................................................... 54
2.4.2
Auto-Build mode................................................................................................................................................55
2.5
Importing Classic CodeWarrior Projects........................................................................................................................ 56
2.6
Deleting Projects.............................................................................................................................................................56
Chapter 3
Build Properties
3.1
Changing Build Properties..............................................................................................................................................59
3.2
Restoring Build Properties..............................................................................................................................................60
3.3
Build Properties for Power Architecture.........................................................................................................................60
3.3.1
CodeWarrior Build Tool Settings...................................................................................................................... 62
3.3.1.1
PowerPC CPU....................................................................................................................................63
3.3.1.2
Debugging.......................................................................................................................................... 64
3.3.1.3
Messages............................................................................................................................................ 65
3.3.1.4
PowerPC Linker................................................................................................................................. 65
3.3.1.4.1
Input................................................................................................................................ 66
3.3.1.4.2
Link Order.......................................................................................................................67
3.3.1.4.3
General............................................................................................................................68
3.3.1.4.4
Output............................................................................................................................. 68
CodeWarrior Development Studio for Power Architecture Processors Targeting Manual, Rev. 10.5.0,
06/2015
4
Freescale Semiconductor, Inc.
Section number
3.3.1.5
3.3.1.6
3.3.1.7
Title
PowerPC Compiler............................................................................................................................ 70
3.3.1.5.1
Preprocessor....................................................................................................................71
3.3.1.5.2
Input................................................................................................................................ 71
3.3.1.5.3
Warnings......................................................................................................................... 73
3.3.1.5.4
Optimization................................................................................................................... 74
3.3.1.5.5
Processor......................................................................................................................... 75
3.3.1.5.6
C/C++ Language.............................................................................................................77
PowerPC Assembler.......................................................................................................................... 79
3.3.1.6.1
Input................................................................................................................................ 80
3.3.1.6.2
General............................................................................................................................81
PowerPC Disassembler...................................................................................................................... 81
3.3.1.7.1
3.3.1.8
Disassembler Settings..................................................................................................... 82
PowerPC Preprocessor....................................................................................................................... 83
3.3.1.8.1
3.3.2
Page
Preprocessor Settings...................................................................................................... 83
GCC Build Tool Settings................................................................................................................................... 84
3.3.2.1
Architecture........................................................................................................................................87
3.3.2.2
PowerPC Linker................................................................................................................................. 88
3.3.2.3
3.3.2.2.1
General............................................................................................................................88
3.3.2.2.2
Libraries.......................................................................................................................... 89
3.3.2.2.3
Miscellaneous................................................................................................................. 90
3.3.2.2.4
Shared Library Settings...................................................................................................90
3.3.2.2.5
PowerPC Environment....................................................................................................91
PowerPC Compiler............................................................................................................................ 91
3.3.2.3.1
Preprocessor....................................................................................................................92
3.3.2.3.2
Symbols.......................................................................................................................... 92
3.3.2.3.3
Includes........................................................................................................................... 93
3.3.2.3.4
Optimization................................................................................................................... 94
3.3.2.3.5
Debugging.......................................................................................................................95
3.3.2.3.6
Warnings......................................................................................................................... 95
CodeWarrior Development Studio for Power Architecture Processors Targeting Manual, Rev. 10.5.0,
06/2015
Freescale Semiconductor, Inc.
5
Section number
Title
3.3.2.3.7
3.3.2.4
General............................................................................................................................97
PowerPC Preprocessor....................................................................................................................... 98
3.3.2.5.1
3.3.2.6
Miscellaneous................................................................................................................. 96
PowerPC Assembler.......................................................................................................................... 97
3.3.2.4.1
3.3.2.5
Page
Preprocessor Settings...................................................................................................... 98
PowerPC Disassembler...................................................................................................................... 99
3.3.2.6.1
Disassembler Settings..................................................................................................... 99
Chapter 4
Debug Configurations
4.1
Using Debug Configurations Dialog Box.......................................................................................................................101
4.1.1
Main................................................................................................................................................................... 102
4.1.2
Arguments.......................................................................................................................................................... 105
4.1.3
Debugger............................................................................................................................................................ 106
4.1.3.1
Debug................................................................................................................................................. 108
4.1.3.2
EPPC Exceptions............................................................................................................................... 109
4.1.3.3
Download........................................................................................................................................... 111
4.1.3.4
PIC..................................................................................................................................................... 113
4.1.3.5
System Call Services..........................................................................................................................114
4.1.3.6
Other Executables.............................................................................................................................. 116
4.1.3.7
Symbolics...........................................................................................................................................117
4.1.3.8
OS Awareness.................................................................................................................................... 119
4.1.4
Trace and Profile................................................................................................................................................ 121
4.1.5
Source.................................................................................................................................................................123
4.1.6
Environment.......................................................................................................................................................124
4.1.7
Common.............................................................................................................................................................125
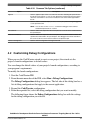
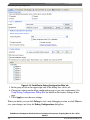
4.2
Customizing Debug Configurations............................................................................................................................... 127
4.3
Reverting Debug Configuration Settings........................................................................................................................129
CodeWarrior Development Studio for Power Architecture Processors Targeting Manual, Rev. 10.5.0,
06/2015
6
Freescale Semiconductor, Inc.
Section number
Title
Page
Chapter 5
Working with Debugger
5.1
Debugging a CodeWarrior project..................................................................................................................................132
5.2
Consistent debug control.................................................................................................................................................132
5.3
Connection types.............................................................................................................................................................133
5.4
5.5
5.3.1
CCSSIM2 ISS.................................................................................................................................................... 133
5.3.2
Ethernet TAP......................................................................................................................................................135
5.3.3
Gigabit TAP + Trace..........................................................................................................................................137
5.3.4
Gigabit TAP....................................................................................................................................................... 140
5.3.5
Simics.................................................................................................................................................................143
5.3.6
TCF.................................................................................................................................................................... 144
5.3.7
USB TAP........................................................................................................................................................... 146
5.3.8
CodeWarrior TAP.............................................................................................................................................. 149
JTAG diagnostics tests....................................................................................................................................................151
5.4.1
Power at probe test............................................................................................................................................. 152
5.4.2
IR scan test......................................................................................................................................................... 152
5.4.3
Bypass scan test................................................................................................................................................. 153
5.4.4
Arbitrary TAP state move test........................................................................................................................... 154
5.4.5
Reading JTAG IDCODEs test........................................................................................................................... 154
Editing remote system configuration.............................................................................................................................. 154
5.5.1
Initialization tab................................................................................................................................................. 155
5.5.2
Memory tab........................................................................................................................................................ 156
5.5.3
Advanced tab......................................................................................................................................................158
5.6
Memory translations....................................................................................................................................................... 158
5.7
CodeWarrior Command-Line Debugger........................................................................................................................ 159
5.8
Working with Breakpoints..............................................................................................................................................162
5.8.1
Setting Breakpoints............................................................................................................................................ 163
5.8.2
Setting Hardware Breakpoints........................................................................................................................... 165
5.8.2.1
Using IDE to Set Hardware Breakpoints........................................................................................... 166
CodeWarrior Development Studio for Power Architecture Processors Targeting Manual, Rev. 10.5.0,
06/2015
Freescale Semiconductor, Inc.
7
Section number
5.8.2.2
5.8.3
5.8.4
5.9
Title
Page
Using Debugger Shell to Set Hardware Breakpoints.........................................................................166
Removing Breakpoints.......................................................................................................................................166
5.8.3.1
Remove Breakpoints using Marker Bar.............................................................................................167
5.8.3.2
Remove Breakpoints using Breakpoints View.................................................................................. 167
Removing Hardware Breakpoints...................................................................................................................... 167
5.8.4.1
Remove Hardware Breakpoints using the IDE.................................................................................. 168
5.8.4.2
Remove Hardware Breakpoints using Debugger Shell......................................................................168
Working with Watchpoints............................................................................................................................................. 169
5.9.1
Setting Watchpoints........................................................................................................................................... 169
5.9.2
Removing Watchpoints......................................................................................................................................171
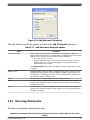
5.10 Working with Registers.................................................................................................................................................. 172
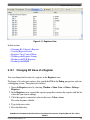
5.10.1 Changing Bit Value of a Register...................................................................................................................... 173
5.10.2 Viewing Register Details................................................................................................................................... 174
5.10.2.1 Bit Fields............................................................................................................................................ 175
5.10.2.2 Changing Bit Fields........................................................................................................................... 176
5.10.2.3 Actions............................................................................................................................................... 177
5.10.2.4 Description......................................................................................................................................... 178
5.10.3 Registers View Context Menu........................................................................................................................... 179
5.10.4 Working with Register Groups.......................................................................................................................... 180
5.10.4.1 Adding a Register Group................................................................................................................... 180
5.10.4.2 Editing a Register Group....................................................................................................................181
5.10.4.3 Removing a Register Group...............................................................................................................182
5.10.5 Working with TLB Registers............................................................................................................................. 182
5.10.5.1 Viewing TLB Registers in Registers View........................................................................................183
5.10.5.2 Reading TLB Registers from Debugger Shell................................................................................... 185
5.10.5.3 Initializing TLB Registers..................................................................................................................187
5.10.5.4 TLB Register Details......................................................................................................................... 188
5.10.5.4.1 e500 Registers.................................................................................................................188
5.10.5.4.2 e500v2 Registers.............................................................................................................190
CodeWarrior Development Studio for Power Architecture Processors Targeting Manual, Rev. 10.5.0,
06/2015
8
Freescale Semiconductor, Inc.
Section number
Title
Page
5.10.5.4.3 e500mc Registers............................................................................................................ 193
5.10.5.4.4 e5500 Registers...............................................................................................................196
5.10.5.4.5 e6500 Registers...............................................................................................................198
5.10.6 Working with IMMR......................................................................................................................................... 201
5.11 Viewing memory............................................................................................................................................................ 201
5.11.1 Adding Memory Monitor...................................................................................................................................202
5.12 Viewing Cache................................................................................................................................................................205
5.12.1 Cache View........................................................................................................................................................ 205
5.12.2 Cache View Toolbar Menu................................................................................................................................ 206
5.12.3 Components of Cache View.............................................................................................................................. 208
5.12.4 Using Debugger Shell to View Caches..............................................................................................................208
5.12.5 Debugger Shell Global Cache Commands.........................................................................................................209
5.12.6 Debugger Shell Cache Line Commands............................................................................................................ 210
5.12.7 Processor-Specific Cache Features.................................................................................................................... 211
5.13 Changing Program Counter Value..................................................................................................................................213
5.14 Hard resetting..................................................................................................................................................................213
5.15 Setting Stack Depth.........................................................................................................................................................214
5.16 Import a CodeWarrior Executable file Wizard...............................................................................................................214
5.16.1 Import a CodeWarrior Executable file Page...................................................................................................... 215
5.16.2 Import C/C++/Assembler Executable Files Page.............................................................................................. 215
5.16.3 Processor Page................................................................................................................................................... 216
5.16.4 Linux Application Launch Configurations Page............................................................................................... 216
5.16.5 Debug Target Settings Page............................................................................................................................... 217
5.16.6 Configurations Page........................................................................................................................................... 218
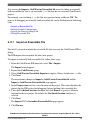
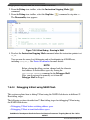
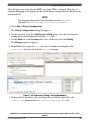
5.17 Debugging Externally Built Executable Files.................................................................................................................218
5.17.1 Import an Executable File.................................................................................................................................. 219
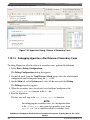
5.17.2 Edit the Launch Configuration...........................................................................................................................222
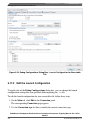
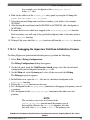
5.17.3 Specify the Source Lookup Path........................................................................................................................ 223
5.17.4 Debug Executable File....................................................................................................................................... 226
CodeWarrior Development Studio for Power Architecture Processors Targeting Manual, Rev. 10.5.0,
06/2015
Freescale Semiconductor, Inc.
9
Section number
Title
Page
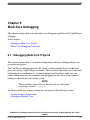
Chapter 6
Multi-Core Debugging
6.1
6.2
Debugging Multi-Core Projects......................................................................................................................................227
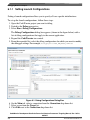
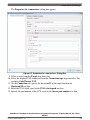
6.1.1
Setting Launch Configurations.......................................................................................................................... 227
6.1.2
Debugging Multiple Cores.................................................................................................................................231
Multi-Core Debugging Commands.................................................................................................................................234
6.2.1
Multi-Core Commands in CodeWarrior IDE.....................................................................................................234
6.2.2
Multi-Core Commands in Debugger Shell........................................................................................................ 236
Chapter 7
Debugging Embedded Linux Software
7.1
Debugging a Linux Application......................................................................................................................................239
7.1.1
Install CodeWarrior TRK on Target System..................................................................................................... 240
7.1.2
Start CodeWarrior TRK on Target System........................................................................................................240
7.1.2.1
TCP/IP Connections...........................................................................................................................241
7.1.2.2
Serial Connections............................................................................................................................. 242
7.1.3
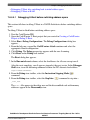
Create a CodeWarrior Download Launch Configuration for the Linux Application........................................ 243
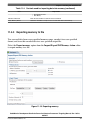
7.1.4
Specify Console I/O Redirections for the Linux Application............................................................................246
7.1.5
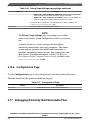
Configure Linux Process Signal Policy............................................................................................................. 247
7.1.6
7.1.5.1
Signal Inheritance.............................................................................................................................. 248
7.1.5.2
Default Signal Policy......................................................................................................................... 248
7.1.5.3
Modifying Signal Policy.................................................................................................................... 248
Debug the Linux Application.............................................................................................................................250
7.2
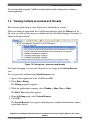
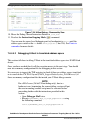
Viewing multiple processes and threads.........................................................................................................................251
7.3
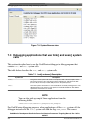
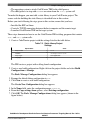
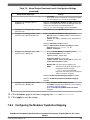
Debugging applications that use fork() and exec() system calls.....................................................................................252
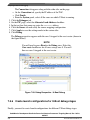
7.4
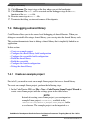
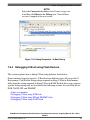
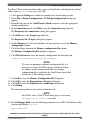
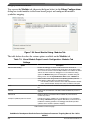
Debugging a shared library.............................................................................................................................................262
7.4.1
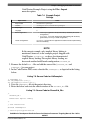
Create an example project..................................................................................................................................262
7.4.2
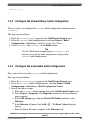
Configure the shared library build configuration...............................................................................................265
7.4.3
Configure the executable build configuration....................................................................................................265
7.4.4
Build the shared library......................................................................................................................................266
CodeWarrior Development Studio for Power Architecture Processors Targeting Manual, Rev. 10.5.0,
06/2015
10
Freescale Semiconductor, Inc.
Section number
7.5
7.6
Title
Page
7.4.5
Build the executable...........................................................................................................................................266
7.4.6
Configure the launch configuration................................................................................................................... 267
7.4.7
Debug the shared library.................................................................................................................................... 270
Preparing U-Boot for debugging.................................................................................................................................... 272
7.5.1
Install BSP..........................................................................................................................................................273
7.5.2
Configure U-Boot and build U-Boot images with CodeWarrior debugger support.......................................... 274
7.5.3
Configure hardware to use U-Boot image......................................................................................................... 275
7.5.4
Create a CodeWarrior project to debug U-Boot................................................................................................ 275
7.5.5
Specify launch configuration settings................................................................................................................ 276
7.5.6
Create launch configurations for U-Boot debug stages..................................................................................... 278
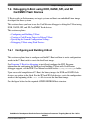
Debugging U-Boot using NOR, NAND, SPI, and SD Card/MMC Flash Devices........................................................ 280
7.6.1
Configuring and Building U-Boot..................................................................................................................... 281
7.6.1.1
Writing configuration words in U-Boot code.................................................................................... 283
7.6.2
Creating a CodeWarrior Project to Debug U-Boot............................................................................................ 284
7.6.3
Specifying the Launch Configuration Settings.................................................................................................. 285
7.6.4
Debugging U-Boot using Flash Devices............................................................................................................287
7.6.4.1
Points to remember............................................................................................................................ 287
7.6.4.2
Debugging U-Boot using NOR flash................................................................................................. 289
7.6.4.3
7.6.4.4
7.6.4.2.1
Debugging U-Boot before switching address space....................................................... 289
7.6.4.2.2
Debugging U-Boot in translated address space.............................................................. 290
7.6.4.2.3
Debugging U-Boot after switching back to initial address space................................... 293
7.6.4.2.4
Debugging U-Boot in RAM............................................................................................294
Debugging U-Boot using SPI and SD/MMC flash............................................................................ 295
7.6.4.3.1
Debugging U-Boot before switching address space....................................................... 296
7.6.4.3.2
Debugging U-Boot in translated address space.............................................................. 297
7.6.4.3.3
Debugging U-Boot after switching back to initial address space................................... 300
7.6.4.3.4
Debugging U-Boot in RAM............................................................................................301
Debugging U-Boot using NAND flash.............................................................................................. 302
7.6.4.4.1
Debugging U-Boot before switching address space....................................................... 303
CodeWarrior Development Studio for Power Architecture Processors Targeting Manual, Rev. 10.5.0,
06/2015
Freescale Semiconductor, Inc.
11
Section number
7.7
Title
Page
7.6.4.4.2
Debugging U-Boot in translated address space.............................................................. 304
7.6.4.4.3
Debugging U-Boot after switching back to initial address space................................... 306
7.6.4.4.4
Debugging U-Boot in RAM............................................................................................308
Debugging the Linux Kernel.......................................................................................................................................... 309
7.7.1
Setting Up the Target Hardware........................................................................................................................ 310
7.7.1.1
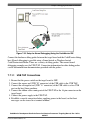
USB TAP Connections...................................................................................................................... 311
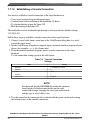
7.7.1.2
Establishing a Console Connection....................................................................................................311
7.7.2
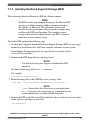
Installing the Board Support Package (BSP)..................................................................................................... 312
7.7.3
Configuring the Build Tool................................................................................................................................314
7.7.4
Configuring the Linux Kernel............................................................................................................................314
7.7.5
Creating a CodeWarrior Project using the Linux Kernel Image........................................................................316
7.7.5.1
7.7.6
Updating the Linux Kernel Image..................................................................................................... 318
7.7.5.1.1
Cache Symbolics Between Sessions is Enabled............................................................. 318
7.7.5.1.2
Cache Symbolics Between Sessions is Disabled............................................................ 318
Configuring the kernel project for debugging....................................................................................................319
7.7.6.1
Configuring a Download Kernel Debug Scenario............................................................................. 319
7.7.6.2
Configuring an Attach Kernel Debug Scenario................................................................................. 320
7.7.6.3
Setting up RAM disk..........................................................................................................................323
7.7.6.4
7.7.6.3.1
Flattened Device Tree Initialization................................................................................324
7.7.6.3.2
Regular Initialization...................................................................................................... 325
Using Open Firmware Device Tree Initialization method.................................................................326
7.7.6.4.1
Obtaining a DTS File...................................................................................................... 326
7.7.6.4.2
Editing the DTS File....................................................................................................... 328
7.7.6.4.3
Compiling the DTS file...................................................................................................329
7.7.6.4.4
Testing a DTB File..........................................................................................................330
7.7.6.4.5
Modifying a DTS file......................................................................................................330
7.7.7
Debugging the kernel to download the kernel, RAM disk, and device tree...................................................... 331
7.7.8
Debugging the kernel based on MMU initialization..........................................................................................332
7.7.8.1
Debugging the Kernel before the MMU is Enabled.......................................................................... 333
CodeWarrior Development Studio for Power Architecture Processors Targeting Manual, Rev. 10.5.0,
06/2015
12
Freescale Semiconductor, Inc.
Section number
7.7.9
7.8
7.9
Title
Page
7.7.8.2
Debugging the Kernel while the MMU is being Enabled..................................................................334
7.7.8.3
Debugging the Kernel after the MMU is Enabled............................................................................. 335
Debugging the kernel by attaching to a running U-Boot................................................................................... 338
Debugging Loadable Kernel Modules............................................................................................................................ 340
7.8.1
Loadable Kernel Modules - An Introduction..................................................................................................... 340
7.8.2
Creating a CodeWarrior Project from the Linux Kernel Image.........................................................................341
7.8.3
Configuring the Modules' Symbolics Mapping................................................................................................. 343
Debugging Hypervisor Guest Applications.................................................................................................................... 345
7.9.1
Hypervisor - An Introduction.............................................................................................................................345
7.9.2
Prerequisites for Debugging a Guest Application..............................................................................................346
7.9.3
Adding CodeWarrior HyperTRK Debug Stub Support in Hypervisor for Linux Kernel Debugging............... 346
7.9.3.1
Enabling HyperTRK Debug Support Directly in Build Tool............................................................ 347
7.9.3.2
Applying New HyperTRK Patches from CodeWarrior Install Layout..............................................347
7.9.3.3
Modifying and Building the HyperTRK Manually............................................................................348
7.9.4
Preparing Connection to P4080DS Target.........................................................................................................348
7.9.5
Debugging AMP/SMP Guest Linux Kernels Running Under Hypervisor........................................................ 349
7.9.5.1
Prerequisites....................................................................................................................................... 349
7.9.5.2
Creating an Attach Launch Configuration to Debug a Linux Partition after Kernel Boot................ 350
7.9.5.3
Creating a Download Launch Configuration to Debug a Linux Partition from an Entry Point or a
User-Defined Function.......................................................................................................................353
7.10 Debugging the P4080 Embedded Hypervisor.................................................................................................................356
7.10.1 Debugging Hypervisor During the Boot and Initialization Process.................................................................. 359
7.10.1.1 Debugging Hypervisor from the Entry Point..................................................................................... 359
7.10.1.2 Debugging Hypervisor from Relocation Till Release of Secondary Cores....................................... 362
7.10.1.3 Debugging Hypervisor after Release of Secondary Cores.................................................................364
7.10.1.4 Debugging the Hypervisor Partitions Initialization Process.............................................................. 365
7.10.1.5 Debugging the Hypervisor Partitions Image Loading Process.......................................................... 366
7.10.1.6 Debugging All Cores when Starting the Guest Applications............................................................ 366
7.10.1.7 Debugging the Hypervisor Partition Manager................................................................................... 366
CodeWarrior Development Studio for Power Architecture Processors Targeting Manual, Rev. 10.5.0,
06/2015
Freescale Semiconductor, Inc.
13
Section number
Title
Page
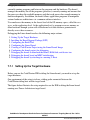
7.11 User Space Debugging with On-Chip Debug.................................................................................................................367
7.11.1 Attaching Core to the Debug Application..........................................................................................................369
7.11.2 Debugging the Application from the main() Function.......................................................................................370
Chapter 8
JTAG Configuration Files
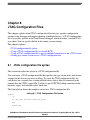
8.1
JTAG configuration file syntax...................................................................................................................................... 371
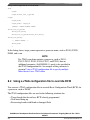
8.2
Using a JTAG configuration file to override RCW........................................................................................................ 372
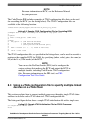
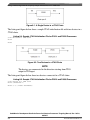
8.3
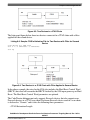
Using a JTAG configuration file to specify multiple linked devices on a JTAG chain................................................. 373
8.4
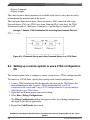
Setting up a remote system to use a JTAG configuration file........................................................................................ 376
Chapter 9
Target Initialization Files
9.1
Using target initialization files........................................................................................................................................379
9.2
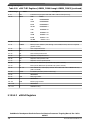
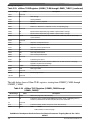
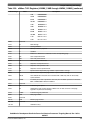
Target initialization commands.......................................................................................................................................381
9.2.1
.cfg target initialization commands.................................................................................................................... 382
9.2.1.1
alternatePC......................................................................................................................................... 382
9.2.1.2
ANDmem.l......................................................................................................................................... 383
9.2.1.3
ANDmmr........................................................................................................................................... 384
9.2.1.4
IncorMMR......................................................................................................................................... 384
9.2.1.5
ORmem.l............................................................................................................................................ 385
9.2.1.6
reset.................................................................................................................................................... 385
9.2.1.7
run...................................................................................................................................................... 386
9.2.1.8
setCoreID........................................................................................................................................... 386
9.2.1.9
resetCoreID........................................................................................................................................ 387
9.2.1.10 sleep................................................................................................................................................... 387
9.2.1.11 stop..................................................................................................................................................... 388
9.2.1.12 writemem.b........................................................................................................................................ 388
9.2.1.13 writemem.w........................................................................................................................................388
9.2.1.14 writemem.l......................................................................................................................................... 389
9.2.1.15 writemmr............................................................................................................................................ 390
CodeWarrior Development Studio for Power Architecture Processors Targeting Manual, Rev. 10.5.0,
06/2015
14
Freescale Semiconductor, Inc.
Section number
Title
Page
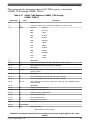
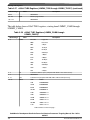
9.2.1.16 writereg.............................................................................................................................................. 391
9.2.1.17 writereg64.......................................................................................................................................... 391
9.2.1.18 writereg128........................................................................................................................................ 392
9.2.1.19 writereg192........................................................................................................................................ 393
9.2.1.20 writespr...............................................................................................................................................394
9.2.2
.tcl target initialization commands..................................................................................................................... 394
Chapter 10
Memory Configuration Files
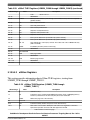
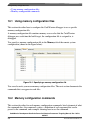
10.1 Using memory configuration files.................................................................................................................................. 398
10.2 Memory configuration commands..................................................................................................................................398
10.2.1 autoEnableTranslations...................................................................................................................................... 399
10.2.2 range...................................................................................................................................................................400
10.2.3 reserved.............................................................................................................................................................. 400
10.2.4 reservedchar....................................................................................................................................................... 401
10.2.5 translate.............................................................................................................................................................. 402
Chapter 11
Working with Hardware Tools
11.1 Flash programmer........................................................................................................................................................... 403
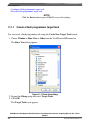
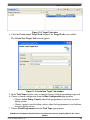
11.1.1 Create a flash programmer target task............................................................................................................... 404
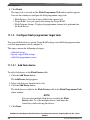
11.1.2 Configure flash programmer target task............................................................................................................ 406
11.1.2.1 Add flash device.................................................................................................................................406
11.1.2.2 Specify target RAM settings.............................................................................................................. 407
11.1.2.3 Add flash programmer actions........................................................................................................... 407
11.1.2.3.1 Erase/Blank check actions.............................................................................................. 408
11.1.2.3.2 Program/Verify actions...................................................................................................409
11.1.2.3.3 Checksum actions........................................................................................................... 410
11.1.2.3.4 Diagnostics actions......................................................................................................... 411
11.1.2.3.5 Dump Flash actions........................................................................................................ 412
11.1.2.3.6 Protect/Unprotect actions................................................................................................412
CodeWarrior Development Studio for Power Architecture Processors Targeting Manual, Rev. 10.5.0,
06/2015
Freescale Semiconductor, Inc.
15
Section number
Title
Page
11.1.2.3.7 Secure/Unsecure actions................................................................................................. 413
11.1.2.3.8 Duplicate action.............................................................................................................. 414
11.1.2.3.9 Remove action................................................................................................................ 414
11.1.3 Execute flash programmer target task................................................................................................................414
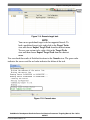
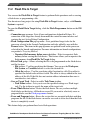
11.2 Flash File to Target......................................................................................................................................................... 415
11.2.1 Erasing flash device........................................................................................................................................... 417
11.2.2 Programming a file.............................................................................................................................................417
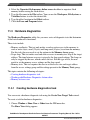
11.3 Hardware diagnostics......................................................................................................................................................418
11.3.1 Creating hardware diagnostics task....................................................................................................................418
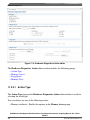
11.3.2 Working with Hardware Diagnostic Action editor............................................................................................ 419
11.3.2.1 Action Type........................................................................................................................................420
11.3.2.2 Memory Access..................................................................................................................................421
11.3.2.3 Loop Speed........................................................................................................................................ 421
11.3.2.4 Memory Tests.................................................................................................................................... 422
11.3.2.4.1 Walking Ones..................................................................................................................423
11.3.2.4.2 Address........................................................................................................................... 424
11.3.2.4.3 Bus noise.........................................................................................................................424
11.3.2.4.4 Address lines...................................................................................................................424
11.3.2.4.5 Data lines........................................................................................................................ 425
11.3.3 Memory test use cases........................................................................................................................................426
11.3.3.1 Use Case 1: Execute host-based Scope Loop on target..................................................................... 426
11.3.3.2 Use Case 2: Execute target-based Memory Tests on target...............................................................426
11.4 Import/Export/Fill memory.............................................................................................................................................427
11.4.1 Creating task for import/export/fill memory......................................................................................................427
11.4.2 Importing data into memory.............................................................................................................................. 429
11.4.3 Exporting memory to file................................................................................................................................... 431
11.4.4 Fill memory........................................................................................................................................................432
CodeWarrior Development Studio for Power Architecture Processors Targeting Manual, Rev. 10.5.0,
06/2015
16
Freescale Semiconductor, Inc.
Section number
Title
Page
Chapter 12
Making a Custom MSL C Library
12.1 Source library modifications...........................................................................................................................................436
12.1.1 Files modified.................................................................................................................................................... 437
12.2 Modifications to avoid errors from GCC LD tool.......................................................................................................... 437
12.2.1 Files modified.................................................................................................................................................... 438
12.3 Software floating point emulation support..................................................................................................................... 438
12.4 Building a custom MSL C library...................................................................................................................................439
Chapter 13
Debugger Limitations and Workarounds
13.1 PowerQUICC II processors............................................................................................................................................ 441
13.2 PowerQUICC II Pro processors......................................................................................................................................442
13.3 PowerQUICC III processors........................................................................................................................................... 443
13.4 QorIQ communications processors.................................................................................................................................445
13.5 T-series processors..........................................................................................................................................................447
13.6 QorIQ Qonverge processors........................................................................................................................................... 449
13.7 Generic processors.......................................................................................................................................................... 450
CodeWarrior Development Studio for Power Architecture Processors Targeting Manual, Rev. 10.5.0,
06/2015
Freescale Semiconductor, Inc.
17
CodeWarrior Development Studio for Power Architecture Processors Targeting Manual, Rev. 10.5.0,
06/2015
18
Freescale Semiconductor, Inc.
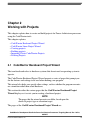
Chapter 1
Introduction
This manual explains how to use CodeWarrior Development Studio tools to develop
software for bareboard applications and embedded Linux® operating system running on
Freescale Power Architecture® processors.
The topics covered here are as follows:
•
•
•
•
•
•
Release notes
Contents of this manual
Accompanying documentation
PowerPC Embedded Application Binary Interface
CodeWarrior Development Studio tools
CodeWarrior IDE
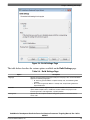
1.1 Release notes
Release notes include information about new features, last-minute changes, bug fixes,
incompatible elements, or other sections that may not be included in this manual.
You should read release notes before using the CodeWarrior IDE.
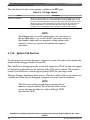
NOTE
The release notes for specific components of the CodeWarrior
IDE are located in the Release_Notes folder in the CodeWarrior
installation directory.
1.2 Contents of this manual
CodeWarrior Development Studio for Power Architecture Processors Targeting Manual, Rev. 10.5.0,
06/2015
Freescale Semiconductor, Inc.
19
Accompanying documentation
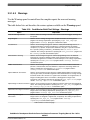
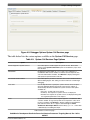
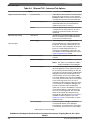
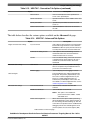
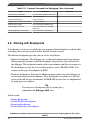
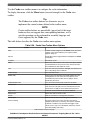
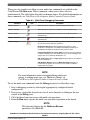
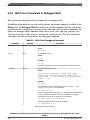
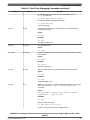
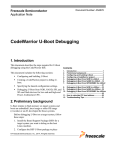
Each chapter of this manual describes a different area of software development.
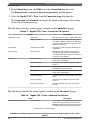
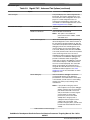
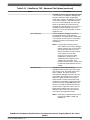
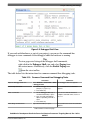
The table below lists each chapter in the manual.
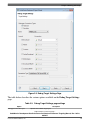
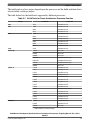
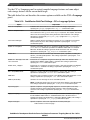
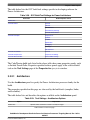
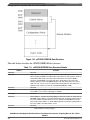
Table 1-1. Organization of this manual
Chapter
Description
Introduction
This chapter.
Working with Projects
Describes the different types of projects you can create, provides an
overview of CodeWarrior project wizards.
Build Properties
Explains build properties for Power Architecture projects.
Debug Configurations
Describes the different types of launch configurations you can create,
provides an overview of the debugger.
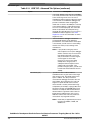
Working with Debugger
Explains various aspects of CodeWarrior debugging, such as debugging a
project, connection types, setting breakpoints and watchpoints, working
with registers, viewing memory, viewing cache, and debugging externally
built executable files.
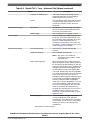
Multi-Core Debugging
Explains multi-core debugging capabilities of CodeWarrior debugger.
Debugging Embedded Linux Software
Explains debugging activities related to embedded Linux software.
JTAG Configuration Files
Explains JTAG configuration files that pass specific configuration settings
to the debugger and support chaining of multiple devices.
Target Initialization Files
Discusses how to use a target initialization file and describes .cfg
and .tcl target initialization commands.
Memory Configuration Files
Discusses how to use a memory configuration file and describes memory
configuration commands.
Working with Hardware Tools
Explains CodeWarrior hardware tools used for board bring-up, test, and
analysis.
Making a Custom MSL C Library
Discusses how to port an MSL C library to the GNU Compiler Collection
(GCC) tool to support bareboard applications that execute on the Power
Architecture-based boards.
Debugger Limitations and Workarounds
Describes processor-specific CodeWarrior debugger limitations and
workarounds.
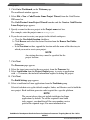
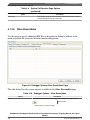
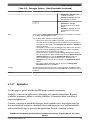
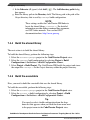
1.3 Accompanying documentation
The Documentation page describes the documentation included in this version of
CodeWarrior Development Studio for Power Architecture.
You can access the Documentation page by:
• Using a shortcut link that the CodeWarrior installer creates by default on the
Desktop.
• Opening the START_HERE.html file available in the <CWInstallDir>\PA\Help folder.
CodeWarrior Development Studio for Power Architecture Processors Targeting Manual, Rev. 10.5.0,
06/2015
20
Freescale Semiconductor, Inc.
Chapter 1 Introduction
1.4 PowerPC Embedded Application Binary Interface
The Power Architecture Embedded Application Binary Interface (PowerPC EABI)
specifies data structure alignment, calling conventions, and other information about how
high-level languages can be implemented on a Power Architecture processor.
The code generated by CodeWarrior for Power Architecture conforms to the PowerPC
EABI.
To learn more about the PowerPC EABI:
• Information and documentation about all supported Power Architecture hardware is
available here:
http://www.freescale.com/powerarchitecture
• PowerPC Embedded Binary Interface, 32-Bit Implementation., published by
Freescale Semiconductor, Inc., and available here:
http://www.freescale.com/files/32bit/doc/app_note/PPCEABI.pdf
• System V Application Binary Interface, available here:
http://www.freescale.com/files/archives/doc/app_note/PPCABI.pdf
The PowerPC EABI also specifies the object and symbol file format. It specifies
Executable and Linkable Format (ELF) as the output file format and Debug With
Arbitrary Record Formats (DWARF) as the debugging information format. For more
information about those formats, see:
• Executable and Linkable Format, Version 1.1, published by UNIX System
Laboratories.
• DWARF Debugging Standard website available at:
www.dwarfstd.org
• DWARF Debugging Information Format, Revision: Version 1.1.0, published by
UNIX International, Programming Languages SIG, October 6, 1992 and available
here:
www.nondot.org/sabre/os/files/Executables/dwarf-v1.1.0.pdf
• DWARF Debugging Information Format, Revision: Version 2.0.0, Industry Review
Draft, published by UNIX International, Programming Languages SIG, July 27,
1993.
CodeWarrior Development Studio for Power Architecture Processors Targeting Manual, Rev. 10.5.0,
06/2015
Freescale Semiconductor, Inc.
21
CodeWarrior Development Studio tools
1.5 CodeWarrior Development Studio tools
This section talks about some important tools of CodeWarrior Development Studio.
Programming for Power Architecture processors is much like programming for any other
CodeWarrior platform target. If you have not used CodeWarrior tools before, start by
studying the Eclipse IDE, which is used to host the tools.
Note that CodeWarrior Development Studio for Power Architecture uses the Eclipse IDE,
whose user interface is substantially different from the "classic" CodeWarrior IDE. For
more details on these interface differences, see CodeWarrior Development Studio
Common Features Guide available in the <CWInstallDir>\PA\Help\PDF\ folder.
The following are some important tools of CodeWarrior Development Studio:
•
•
•
•
•
•
•
Eclipse IDE
C/C++ compiler
Assembler
Linker
Debugger
Main standard libraries
CodeWarrior Profiling and Analysis tools
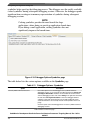
1.5.1 Eclipse IDE
The Eclipse Integrated Development Environment (IDE) is an open-source development
environment that lets you develop and debug your software. It controls the project
manager, the source code editor, the class browser, the compilers and linkers, and the
debugger. The Eclipse workspace organizes all files related to your project. This allows
you to see your project at a glance and navigate easily through the source code files.
The Eclipse IDE has an extensible architecture that uses plug-in compilers and linkers to
target various operating systems and microprocessors. The IDE can be hosted on
Microsoft Windows, Linux, and other platforms. There are many development tools
available for the IDE, including C, C++, and Java compilers for desktop and embedded
processors
For more information about the Eclipse IDE, read the Eclipse documentation at:
http://www.eclipse.org/documentation/
CodeWarrior Development Studio for Power Architecture Processors Targeting Manual, Rev. 10.5.0,
06/2015
22
Freescale Semiconductor, Inc.
Chapter 1 Introduction
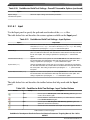
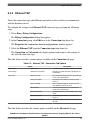
1.5.2 C/C++ compiler
The CodeWarrior Eclipse IDE for Power Architecture processors supports two types of
C/C++ compilers:
• CodeWarrior C/C++ compiler
• GCC C/C++ compiler
Each supported compiler is ANSI-compliant. It compiles C and C++ statements and
assembles inline assembly language statements. You can generate Power Architecture
applications and libraries that conform to the PowerPC EABI by using the
CodeWarrior/GCC compiler in conjunction with the CodeWarrior/GCC linker for Power
Architecture processors.
The IDE manages the execution of the compiler. The IDE invokes the compiler if you:
• Change a source file and issue the make command.
• Select a source file in your project and issue the compile, preprocess, or precompile
command.
For more information about the CodeWarrior Power Architecture C/C++ compiler and its
inline assembler, see the Power Architecture Build Tools Reference Manual from the
<CWInstallDir>\PA\Help\PDF\ folder.
For more information about the GCC Power Architecture C/C++ compiler, see the gcc.pdf
manual from the <CWInstallDir>\Cross_Tools\gcc-<version>-<target>\powerpc-<[eabi]/
[eabispe]/[aeabi]/[linux/libc]>\share\docs\pdf\gcc folder.
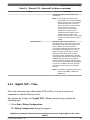
1.5.3 Assembler
The CodeWarrior Eclipse IDE for Power Architecture processors supports two types of
standalone assemblers:
• CodeWarrior assembler
• GCC assembler
The assembler translates assembly-language source code to machine-language object
files or executable programs. Either you can provide the assembly-language source code
to the assembler, or the assembler can take the assembly-language source code generated
by the compiler.
CodeWarrior Development Studio for Power Architecture Processors Targeting Manual, Rev. 10.5.0,
06/2015
Freescale Semiconductor, Inc.
23
CodeWarrior Development Studio tools
For more information about the CodeWarrior Power Architecture assembler, see the
Power Architecture Build Tools Reference manual from the <CWInstallDir>\PA\Help\PDF\
folder.
For more information about the GCC Power Architecture assembler, see the as.pdf
manual from the <CWInstallDir>\Cross_Tools\gcc-<version>-<target>\powerpc-<[eabi]/
[eabispe]/[aeabi]/[linux/libc]>\share\docs\pdf folder.
1.5.4 Linker
CodeWarrior Eclipse IDE for Power Architecture processors supports two types of
linkers:
• CodeWarrior linker
• GCC linker
The linker generates binaries that conform to the PowerPC EABI (Embedded Application
Binary Interface). The linker combines object modules created by the compiler and/or
assembler with modules in static libraries to produce a binary file in executable and
linkable (ELF) format.
Among many powerful features, the linker lets you:
•
•
•
•
Use absolute addressing
Create multiple user-defined sections
Generate S-Record files
Generate PIC/PID binaries
The IDE runs the linker each time you build your project.
For more information about the CodeWarrior Power Architecture linker, see the Power
Architecture Build Tools Reference manual from the <CWInstallDir>\PA\Help\PDF\ folder.
For more information about the GCC Power Architecture linker, see the ld.pdf manual
from the <CWInstallDir>\Cross_Tools\gcc-<version>-<target>\powerpc-<[eabi]/[eabispe]/
[aeabi]/[linux/libc]>\share\docs\pdf folder.
1.5.5 Debugger
CodeWarrior Development Studio for Power Architecture Processors Targeting Manual, Rev. 10.5.0,
06/2015
24
Freescale Semiconductor, Inc.
Chapter 1 Introduction
The CodeWarrior Power Architecture debugger controls the execution of your program
and allows you to see what is happening internally as the program runs. You can use the
debugger to find problems in your program.
The debugger can execute your program one statement at a time and suspend execution
when control reaches a specified point. When the debugger stops a program, you can
view the chain of function calls, examine and change the values of variables, and inspect
the contents of registers.
The debugger allows you to debug your CodeWarrior project using either a simulator or
target hardware.
The Power Architecture debugger communicates with the board through a monitor
program (such as CodeWarrior TRK) or through a hardware probe (such as CodeWarrior
TAP (over USB)).
For more information, see CodeWarrior Development Studio Common Features Guide
and the Working with Debugger chapter of this manual.
1.5.6 Main standard libraries
The main standard libraries (MSL) are ANSI-compliant C and C++ standard libraries.
Use these libraries to help you create applications for Power Architecture processors. The
Power Architecture versions of the MSL libraries have been customized and the runtime
has been adapted for Power Architecture processor development.
For more information about MSL, see MSL C Reference and MSL C++ Reference.
1.5.7 CodeWarrior Profiling and Analysis tools
CodeWarrior Profiling and Analysis tools provide visibility into an application as it runs
on the simulator and hardware. This visibility can help you understand how your
application runs, as well as identify operational problems. The tools also provide user
friendly data viewing features:
• Simultaneously step through trace data and the corresponding source and assembly
code of that trace data
• Export source line information of the performance data generated by the simulator
into an Excel file
CodeWarrior Development Studio for Power Architecture Processors Targeting Manual, Rev. 10.5.0,
06/2015
Freescale Semiconductor, Inc.
25
CodeWarrior IDE
• Export the trace and function data generated by simulator and target hardware into an
Excel file
• Apply multi-level filters to isolate data
• Apply multi-level searches to find specific data
• Display results in an intuitive, user friendly manner in the trace, critical code, and
performance views
• Show or hide columns and also reorder the columns
• Copy and paste a cell or a line of the trace, alu-agu and performance data generated
by simulator and target hardware
• Control trace collection by using start and stop tracepoints to reduce the amount of
unwanted trace events in the trace buffer making the trace data easier to read
• View the value of the DPU counters in form of graphs (pie charts and bar charts)
while the application is in debug mode
• Display real time cycle count for simulated targets to allow quick monitoring of
evolution of application in time
For more information, see Tracing and Analysis Tools User Guide available in the
<CWInstallDir>\PA\Help\PDF\ folder.
1.6 CodeWarrior IDE
This section explains the CodeWarrior IDE and tells how to perform basic IDE
operations.
While working with the CodeWarrior IDE, you will proceed through the development
stages familiar to all programmers, such as writing code, compiling and linking, and
debugging. See CodeWarrior Development Studio Common Features Guide for:
• Complete information on tasks, such as editing, compiling, and linking
• Basic information on debugging
The difference between the CodeWarrior development environment and traditional
command-line environments is how the software, in this case the CodeWarrior IDE, helps
you manage your work more effectively.
The following sections explain the CodeWarrior IDE and describe how to perform basic
CodeWarrior IDE operations:
• Project files
• Code editing
• Compiling
CodeWarrior Development Studio for Power Architecture Processors Targeting Manual, Rev. 10.5.0,
06/2015
26
Freescale Semiconductor, Inc.
Chapter 1 Introduction
• Linking
• Debugging
1.6.1 Project files
A CodeWarrior project is analogous to a set of make files, because a project can have
multiple settings that are applied when building the program. For example, you can have
one project that has both a debug version and a release version of your program. You can
build one or the other, or both as you wish. The different settings used to launch your
program within a single project are called launch configurations.
The CodeWarrior IDE uses the CodeWarrior Projects view to list all the files in a
project. A project includes files, such as source code files and libraries. You can add or
remove files easily. You can assign files to one or more different build configurations
within the project, so files common to multiple build configurations can be managed
simply.
The CodeWarrior IDE itself manages all the interdependencies between files and tracks
which files have changed since the last build.
The CodeWarrior IDE also stores the settings for the compiler and linker options for each
build configuration. You can modify these settings using the IDE, or with the #pragma
statements in your code.
1.6.2 Code editing
CodeWarrior IDE has an integral text editor designed for programmers. It handles text
files in ASCII, Microsoft® Windows® and UNIX® formats.
To edit a file in a project, double-click the file name in the CodeWarrior Projects view.
CodeWarrior IDE opens the file in the editor associated with the file type.
The editor view has excellent navigational features that allow you to switch between
related files, locate any particular function, mark any location within a file, or go to a
specific line of code.
CodeWarrior Development Studio for Power Architecture Processors Targeting Manual, Rev. 10.5.0,
06/2015
Freescale Semiconductor, Inc.
27
CodeWarrior IDE
1.6.3 Compiling
To compile a source code file, it must be among the files that are part of the current
launch configuration. If the file is in the configuration, select it in the CodeWarrior
Projects view and select Project > Build Project from the CodeWarrior IDE menu bar.
To automatically compile all the files in the current launch configuration after you
modify them, select Project > Build Automatically from the CodeWarrior IDE menu
bar.
1.6.4 Linking
Select Project > Build Project from the CodeWarrior IDE menu bar to link object code
into a final binary file. The Build Project command makes the active project up-to-date
and links the resulting object code into a final output file.
You can control the linker through the IDE. There is no need to specify a list of object
files. The workspace tracks all the object files automatically.
You can also modify the build configuration settings to specify the name of the final
output file.
1.6.5 Debugging
Select Run > Debug from the CodeWarrior IDE menu bar to debug your project. This
command downloads the current project's executable to the target board and starts a
debug session.
NOTE
The CodeWarrior IDE uses the settings in the launch
configuration to generate debugging information and initiate
communications with the target board.
You can now use the debugger to step through the program code, view and change the
value of variables, set breakpoints, and much more. For more information, see
CodeWarrior Development Studio Common Features Guide and the Working with
Debugger chapter of this manual.
CodeWarrior Development Studio for Power Architecture Processors Targeting Manual, Rev. 10.5.0,
06/2015
28
Freescale Semiconductor, Inc.
Chapter 2
Working with Projects
This chapter explains how to create and build projects for Power Architecture processors
using the CodeWarrior tools.
This chapter explains:
•
•
•
•
•
•
CodeWarrior Bareboard Project Wizard
CodeWarrior Linux Project Wizard
Creating projects
Building projects
Importing Classic CodeWarrior Projects
Deleting Projects
2.1 CodeWarrior Bareboard Project Wizard
The term bareboard refers to hardware systems that do not need an operating system to
operate.
The CodeWarrior Bareboard Project Wizard presents a series of pages that prompt you
for the features and settings to be used when making your program.
This wizard also helps you specify other settings, such as whether the program executes
on a simulator rather than actual hardware.
This section describes the various pages that the CodeWarrior Bareboard Project
Wizard displays as it assists you in creating a bareboard project.
NOTE
The pages that the wizard presents can differ, based upon the
choice of project type or execution target.
The pages of the CodeWarrior Bareboard Project Wizard are:
CodeWarrior Development Studio for Power Architecture Processors Targeting Manual, Rev. 10.5.0,
06/2015
Freescale Semiconductor, Inc.
29
CodeWarrior Bareboard Project Wizard
•
•
•
•
•
•
Create a CodeWarrior Bareboard Project Page
Processor Page
Debug Target Settings Page
Build Settings Page
Configurations Page
Trace Configuration Page
2.1.1 Create a CodeWarrior Bareboard Project Page
Use this page to specify the project name and the directory where the project files are
located.
Figure 2-1. Create a CodeWarrior Bareboard Project page
The table below describes the various options available on the Create a CodeWarrior
Bareboard Project page.
Table 2-1. Create a CodeWarrior Bareboard Project page settings
Option
Description
Project name
Enter the name for the project in this text box.
Use default location
Select to choose the directory to store the files required to build the program. Use the
Location option to select the desired directory.
Location
Specifies the directory that contains the project files. Use Browse to navigate to the
desired directory. This option is only available when Use default location is cleared.
CodeWarrior Development Studio for Power Architecture Processors Targeting Manual, Rev. 10.5.0,
06/2015
30
Freescale Semiconductor, Inc.
Chapter 2 Working with Projects
2.1.2 Processor Page
This page displays the target devices supported by the current installation.
Use this page to specify the type of processor and the output for the new project.
Figure 2-2. Processor Page
CodeWarrior Development Studio for Power Architecture Processors Targeting Manual, Rev. 10.5.0,
06/2015
Freescale Semiconductor, Inc.
31
CodeWarrior Bareboard Project Wizard
The table below describes the various options available on the Processor page.
Table 2-2. Processor Page Settings
Option
Description
Processor
Expand the processor family tree and select a supported target. The toolchain uses this
choice to generate code that makes use of processor-specific features, such as
multiple cores.
Project Output
Select any one of the following supported project output:
• Application: Select to create an application with ".elf" extension, that includes
information related to the debug over a board.
• Static Library: Select to create a library with ".a" extension, that can be
included in other projects. Library files created using this option do not include
board specific details.
2.1.3 Debug Target Settings Page
Use this page to select debugger connection type, board type, launch configuration type,
and connection type for your project.
This page also lets you configure connection settings for your project.
NOTE
This wizard page will prompt you to either create a new remote
system configuration or select an existing one. A remote system
is a system configuration that defines connection, initialization,
and target parameters. The remote system explorer provides
data models and frameworks to configure and manage remote
systems, their connections, and their services. For more
information, see CodeWarrior Development Studio Common
Features Guide available in the <CWInstallDir>\PA\Help\PDF\
folder, where <CWInstallDir> is the installation directory of your
CodeWarrior software.
CodeWarrior Development Studio for Power Architecture Processors Targeting Manual, Rev. 10.5.0,
06/2015
32
Freescale Semiconductor, Inc.
Chapter 2 Working with Projects
Figure 2-3. Debug Target Settings Page
The table below describes the various options available on the Debug Target Settings
page.
Table 2-3. Debug Target Settings page settings
Option
Debugger Connection Types
Description
Specifies the available target types:
Table continues on the next page...
CodeWarrior Development Studio for Power Architecture Processors Targeting Manual, Rev. 10.5.0,
06/2015
Freescale Semiconductor, Inc.
33
CodeWarrior Bareboard Project Wizard
Table 2-3. Debug Target Settings page settings (continued)
Option
Description
• Hardware - Select to execute the program on the target hardware available.
• Simulator - Select to execute the program on a software simulator.
• Emulator - Select to execute the program on a hardware emulator.
Board
Specifies the hardware supported by the selected processor.
Launch
Specifies the launch configurations and corresponding connection, supported by the
selected processor.
Connection Type
Specifies the interface to communicate with the hardware.
• CodeWarrior TAP (over USB) - Select to use the CodeWarrior TAP interface
(over USB) to communicate with the hardware device.
• CodeWarrior TAP (over Ethernet) - Select to use the CodeWarrior TAP
interface (over Ethernet) to communicate with the hardware device.
• USB TAP - Select to use the USB interface to communicate with the hardware
device.
• Ethernet TAP - Select to use the Ethernet interface to communicate with the
target hardware.
For more details on CodeWarrior TAP, see CodeWarrior TAP User Guide available in
the <CWInstallDir>\PA\Help\PDF\ folder, where <CWInstallDir> is the
installation directory of your Codewarrior software.
• Gigabit TAP - Corresponds to a Gigabit TAP that includes an Aurora daughter
card, which allows you to collect Nexus trace in a real-time non-intrusive fashion
from the high speed serial trace port (the Aurora interface).
• Gigabit TAP + Trace (JTAG over JTAG cable) - Select to use the Gigabit TAP
and Trace probe to send JTAG commands over the JTAG cable.
• Gigabit TAP + Trace (JTAG over Aurora cable) - Select to use the Gigabit TAP
and Trace probe to send JTAG commands over the Aurora cable.
For more details on Gigabit TAP, see Gigabit TAP Users Guide available in the
<CWInstallDir>\PA\Help\PDF\ folder, where <CWInstallDir> is the installation
directory of your Codewarrior software.
TAP address
Enter the IP address of the selected TAP device.
2.1.4 Build Settings Page
Use this page to select a programming language, toolchain, and the output project type
for your project.
NOTE
The current release does not include toolchains for Linux
applications by default. To add the required build tools support,
you should install the corresponding service pack for the
required target. For more information on installing service
packs, see the Service Pack Updater Quickstart available in the
<CWInstallDir>\PA\ folder.
CodeWarrior Development Studio for Power Architecture Processors Targeting Manual, Rev. 10.5.0,
06/2015
34
Freescale Semiconductor, Inc.
Chapter 2 Working with Projects
Figure 2-4. Build Settings Page
The table below describes the various options available on the Build Settings page.
Table 2-4. Build Settings Page
Option
Description
Language
Specifies the programming language used by the new project. The current installation
supports the following languages:
• C - Select to generate ANSI C-compliant startup code, and initializes global
variables.
• C++ - Select to generate ANSI C++ startup code, and performs global class
object initialization.
Toolchain
Specifies the toolchains supported by the current installation. Selected toolchain sets
up the default compiler, linker, and libraries used to build the new project. Each
toolchain generates code targeted for a specific platform.
Floating Point
Specifies how the compiler handles floating-point operations, encountered in the
source code.
CodeWarrior Development Studio for Power Architecture Processors Targeting Manual, Rev. 10.5.0,
06/2015
Freescale Semiconductor, Inc.
35
CodeWarrior Bareboard Project Wizard
2.1.5 Configurations Page
Use this page to specify the processing model and the processor core that executes the
project.
Figure 2-5. Configurations Page
The table below describes the various options available on the Configurations page.
Table 2-5. Configurations Page Setting
Option
Processing Model
Description
The current installation supports the following processing models:
• SMP - Select this option to generate a single project for the selected cores. The
cores share the same interrupt vector, text, data sections and heap memory.
Each core has its own, dedicated stack. A single initialization file should be
executed for each core.
NOTE: The SMP option is available for selection only while creating projects for some
e500mc, e5500, and e6500 core targets.
Table continues on the next page...
CodeWarrior Development Studio for Power Architecture Processors Targeting Manual, Rev. 10.5.0,
06/2015
36
Freescale Semiconductor, Inc.
Chapter 2 Working with Projects
Table 2-5. Configurations Page Setting (continued)
Option
Description
• AMP (one project per core) - Select this option to generate a separate project
for each selected core. The option will also set the core index for each project
based on the core selection.
• AMP (one build configuration per core) - Select this option to generate one
project with multiple targets, each containing an lcf file for the specified core.
NOTE: Selecting the AMP (One build configuration per core) option displays a
checkbox, Set up build references for build configurations of all cores,
just below this option. If you select the Set up build references for build
configurations of all cores checkbox, then building the project for one core
will automatically build the project for other cores as well. If you do not select
this checkbox, then you would need to manually build the project for each
core.
Core Index
Select the processor core that executes the project.
2.1.6 Trace Configuration Page
Use this page to enable collection of trace and profiling data.
CodeWarrior Development Studio for Power Architecture Processors Targeting Manual, Rev. 10.5.0,
06/2015
Freescale Semiconductor, Inc.
37
CodeWarrior Linux Project Wizard
Figure 2-6. The Trace Configuration Page
The table below describes the various options available on the Trace Configuration
page.
Table 2-6. Trace Configuration Page Settings
Option
Description
Start a trace session on debug
launch
Allows you to enable trace and profile for your project.
Generate trace configurations
Specifies the source used for collecting trace data. The current installation supports the
following options:
• DDR Buffer - Select to send trace to a DDR memory buffer.
• NPC Buffer - Select to send trace data to a small dedicated trace buffer.
• Gigabit TAP + Trace - Select to collect trace data on a GigabitTAP+Trace probe.
Enable circular collection (DDR and
NPC only)
Specifies circular collection of trace data in the generated trace configurations. If
selected, the trace buffer is treated as a `circular buffer', and tracing continues even
after the buffer is full by replacing the oldest entries.
2.2 CodeWarrior Linux Project Wizard
CodeWarrior Development Studio for Power Architecture Processors Targeting Manual, Rev. 10.5.0,
06/2015
38
Freescale Semiconductor, Inc.
Chapter 2 Working with Projects
The CodeWarrior Linux Project Wizard helps you create a Linux project by displaying
various pages that allow you to specify settings for your project.
NOTE
The pages that the wizard presents can differ, based upon the
choice of project type or execution target.
The pages of the CodeWarrior Linux Project Wizard are:
•
•
•
•
Create a CodeWarrior Linux Project Page
Processor Page
Build Settings Page
Linux Application Page
2.2.1 Create a CodeWarrior Linux Project Page
Use this page to specify the project name and the directory where the project files are
located.
Figure 2-7. Create a CodeWarrior Linux Project Page
CodeWarrior Development Studio for Power Architecture Processors Targeting Manual, Rev. 10.5.0,
06/2015
Freescale Semiconductor, Inc.
39
CodeWarrior Linux Project Wizard
The table below describes the various options available on the Create a CodeWarrior
Linux Project page.
Table 2-7. Create a CodeWarrior Linux Project Page Settings
Option
Description
Project name
Enter the name for the project in this text box.
Use default location
Select to choose the directory to store the files required to build the program. Use the
Location option to select the desired directory.
Location
Specifies the directory that contains the project files. Use Browse to navigate to the
desired directory. This option is only available when Use default location is cleared.
Ensure that you append the name of the project to the path to create a new location for
your project.
2.2.2 Processor Page
This page displays the processors supported by the current installation.
Use this page to specify the type of processor and the output for the new project.
CodeWarrior Development Studio for Power Architecture Processors Targeting Manual, Rev. 10.5.0,
06/2015
40
Freescale Semiconductor, Inc.
Chapter 2 Working with Projects
Figure 2-8. Processor Page
The table below describes the various options available on the Processor page.
Table 2-8. Processor Page Settings
Option
Description
Processor
Expand the processor family tree and select a supported target. The toolchain uses this
choice to generate code that makes use of processor-specific features, such as
multiple cores.
Project Output
Select any one of the following supported project output:
CodeWarrior Development Studio for Power Architecture Processors Targeting Manual, Rev. 10.5.0,
06/2015
Freescale Semiconductor, Inc.
41
CodeWarrior Linux Project Wizard
Table 2-8. Processor Page Settings
Option
Description
• Application -Select to create an application with ".elf" extension, that includes
information related to the debug over a board.
• Library -Select to create a library with ".a" extension, that can be included in
other projects. Library files created using this option do not include board specific
details.
2.2.3 Build Settings Page
This page displays the toolchains supported by the current installation.
Use this page to specify the toolchain for the new project.
NOTE
The current release does not include toolchains for Linux
applications by default. To add the required build tools support,
you should install the corresponding service pack for the
required target. For more information on installing service
packs, see the Service Pack Updater Quickstart available in the
<CWInstallDir>\PA\ folder.
CodeWarrior Development Studio for Power Architecture Processors Targeting Manual, Rev. 10.5.0,
06/2015
42
Freescale Semiconductor, Inc.
Chapter 2 Working with Projects
Figure 2-9. Build Settings Page
The table below describes the various options available on the Build Settings page.
Table 2-9. Build Settings Page Setting
Option
Description
Toolchain
Specifies the toolchains supported by the current installation. Selected toolchain sets
up the default compiler, linker, and libraries used to build the new project. Each
toolchain generates code targeted for a specific platform.
Language
Specifies the programming language used by the new project. The current installation
supports the following languages:
• C - Select to generate ANSI C-compliant startup code, and initializes global
variables.
• C++ - Select to generate ANSI C++ startup code, and performs global class
object initialization.
Build Tools Architecture
Specifies the processor used by the new project. The current installation supports the
following architectures:
• 32 bit - 32 bit option is available by default for QorIQ_P4 processors.
• 64 bit - 64 bit option is only available for QorIQ_P5 processors
NOTE: For QorIQ_P4 processors, 32 bit option is selected by default and 64 bit is
unavailable. But if you are using QorIQ_P5 processors, both the options are
enabled.
CodeWarrior Development Studio for Power Architecture Processors Targeting Manual, Rev. 10.5.0,
06/2015
Freescale Semiconductor, Inc.
43
CodeWarrior Linux Project Wizard
2.2.4 Linux Application Page
Use this page to specify how the debugger communicates with the host Linux system and
controls your Linux application.
NOTE
The Linux Application page appears, in the CodeWarrior
Linux Project Wizard, only when you add the Linux build
tools support, by installing the corresponding service pack for
the required target. For more information on installing service
packs, see the Service Pack Updater Quickstart available in the
<CWInstallDir>\PA\ folder.
Figure 2-10. Linux Application Page
NOTE
When debugging a Linux application, you must use the
CodeWarrior TRK to manage the communications interface
between the debugger and Linux system. For details, see Install
CodeWarrior TRK on Target System.
CodeWarrior Development Studio for Power Architecture Processors Targeting Manual, Rev. 10.5.0,
06/2015
44
Freescale Semiconductor, Inc.
Chapter 2 Working with Projects
The table below describes the various options available on the Linux Application page.
Table 2-10. Linux Application Page Setting
Option
Description
CodeWarrior TRK
Select to use the CodeWarrior Target Resident Kernel (TRK) protocol, to download and
control application on the Linux host system.
IP Address
Specifies the IP address of the Linux host system, the project executes on.
Port
Specifies the port number that the debugger will use to communicate to the Linux host.
Remote Download Path
Specifies the host directory into which the debugger downloads the application.
2.3 Creating projects
You can use a project creation wizard provided by CodeWarrior Development Studio to
create a CodeWarrior project according to your requirements.
This section explains:
• Creating CodeWarrior Bareboard Application Project
• Creating CodeWarrior Bareboard Library Project
• Creating CodeWarrior Linux Application Project
2.3.1 Creating CodeWarrior Bareboard Application Project
You can create a CodeWarrior bareboard application project using the CodeWarrior
Bareboard Project Wizard.
To create a CodeWarrior bareboard application project, perform these steps:
1. Select Start > All Programs > Freescale CodeWarrior > CW for Power
Architecture vnumber > CodeWarrior IDE, where number is the version number
of your product.
The Workspace Launcher dialog box appears, prompting you to select a workspace
to use.
NOTE
Click Browse to change the default location for workspace
folder. You can also select the Use this as the default and
CodeWarrior Development Studio for Power Architecture Processors Targeting Manual, Rev. 10.5.0,
06/2015
Freescale Semiconductor, Inc.
45
Creating projects
do not ask again checkbox to set default or selected path as
the default location for storing all your projects.
2. Click OK.
The default workspace is accepted. The CodeWarrior IDE launches and the
Welcome page appears.
NOTE
The Welcome page appears only if the CodeWarrior IDE
or the selected workspace is started for the first time.
Otherwise, the Workbench window appears.
3. Click Go to Workbench from the Welcome page.
The workbench window appears.
4. Select File > New > CodeWarrior Bareboard Project Wizard, from the
CodeWarrior IDE menu bar.
The CodeWarrior Bareboard Project Wizard launches and the Create a
CodeWarrior Bareboard Project page appears.
5. Specify a name for the new project in the Project name text box.
For example, enter the project name as Hello_World.
6. If you do not want to create your project in the default workspace:
a. Clear the Use default location checkbox.
b. Click Browse and select the desired location from the Browse For Folder
dialog box.
c. In the Location text box, append the location with the name of the directory in
which you want to create your project. In the Location text box, append the
location with the name of the directory in which you want to create your project.
NOTE
An existing directory cannot be specified for the
project location. If created, the CodeWarrior will
prompt an error message.
7. Click Next.
The Processor page appears.
8. Select the target processor for the new project, from the Processor list.
9. Select Application from the Project Output group, to create an application
with .elf extension, that includes information required to debug the project.
10. Click Next.
CodeWarrior Development Studio for Power Architecture Processors Targeting Manual, Rev. 10.5.0,
06/2015
46
Freescale Semiconductor, Inc.
Chapter 2 Working with Projects
The Debug Target Settings page appears.
11. Select a supported connection type (hardware, simulator, or emulator), from the
Debugger Connection Types group. Your selection determines the launch
configurations that you can include in your project.
12. Select the board you are targeting, from the Board drop-down list.
NOTE
Hardware or Simulators that supports the target processor
selected on the Processors page are only available for
selection. If you are using the Simics simulator, see https://
www.simics.net/ for latest version and installation
instructions for Simics.
13. Select the launch configurations that you want to include in your project and the
corresponding connection, from the Launch group.
14. Select the interface to communicate with the hardware, from the Connection Type
drop-down list.
15. Enter the IP address of the TAP device in the TAP address text box. This option is
disabled and cannot be edited, if you select USB TAP from the Connection Type
drop-down list.
16. Click Next.
The Build Settings page appears.
17. Select the programming language, you want to use, from the Language group.
The language you select determines the libraries that are linked with your program
and the contents of the main source file that the wizard generates.
18. Select the architecture type used by the new project, from the Build Tools
Architecture group.
NOTE
For projects created for QorIQ_P5 processors, both the 32
bit and 64 bit options are enabled and can be selected. This
option may not be available for some target processors
selected on the Processors page.
19. Select a toolchain from the Toolchain group.
Selected toolchain sets up the default compiler, linker, and libraries used to build the
new project. Each toolchain generates code targeted for a specific platform.
NOTE
The current release does not include toolchains for Linux
applications by default. To add the required Linux build
CodeWarrior Development Studio for Power Architecture Processors Targeting Manual, Rev. 10.5.0,
06/2015
Freescale Semiconductor, Inc.
47
Creating projects
tools support, you should install the corresponding service
pack for the required target. For more information on
installing service packs, see the Service Pack Updater
Quickstart available in the <CWInstallDir>\PA\ folder.
20. Select an option from the Floating Point drop-down list, to prompt the compiler to
handle the floating-point operations by generating instructions for the selected
floating-point unit.
21. Click Next.
The Configurations page appears.
22. Select a processing model option from the Processing Model group.
NOTE
The SMP option is available for selection only while
creating projects for some e500mc and e5500 core targets.
• Select SMP (One build configuration for all the cores) to generate a single
project for the selected cores. The cores share the same interrupt vector, text,
data sections and heap memory. Each core has its own, dedicated stack. A single
initialization file should be executed for each core.
• Select AMP (One project per core) to generate a separate project for each
selected core. The option will also set the core index for each project based on
the core selection.
• Select AMP (One build configuration per core) to generate one project with
multiple targets, each containing an .lcf file for the specified core.
23. Select the processor core that executes the project, from the Core index list.
24. Click Next.
The Trace Configuration page appears.
25. If you plan to collect the trace details:
a. Select the Start a trace session on debug launch checkbox, to start a trace
session automatically on debug launch.
b. Select the source used for collecting trace data, from the Generate trace
configurations group.
• Select the DDR Buffer checkbox, to send the trace data to a DDR memory
buffer.
• Select the NPC Buffer checkbox, to send the trace data to a small dedicated
trace buffer.
• Select the Gigabit TAP + Trace checkbox, to collect trace data on a Gigabit
TAP+Trace probe.
c. Select the Enable circular collection checkbox, from the Enable circular
collection (DDR and NPC only) group, to treat the trace buffer as a `circular
CodeWarrior Development Studio for Power Architecture Processors Targeting Manual, Rev. 10.5.0,
06/2015
48
Freescale Semiconductor, Inc.
Chapter 2 Working with Projects
buffer'. Selection of this checkbox, ensures continuation of trace collection, even
after the buffer is full, by replacing the oldest entries.
26. Click Finish.
The wizard creates an application project according to your specifications. You can
access the project from the CodeWarrior Projects view on the Workbench.
The new project is ready for use. You can now customize the project by adding your own
source code files, changing debugger settings and adding libraries.
2.3.2 Creating CodeWarrior Bareboard Library Project
You can create a CodeWarrior bareboard library project using the CodeWarrior
Bareboard Project Wizard.
To create a CodeWarrior bareboard library project, perform these steps:
1. Select Start > All Programs > Freescale CodeWarrior > CW for Power
Architecture vnumber > CodeWarrior IDE, where number is the version number
of your product.
The Workspace Launcher dialog box appears, prompting you to select a workspace
to use.
NOTE
Click Browse to change the default location for workspace
folder. You can also select the Use this as the default and
do not ask again checkbox to set default or selected path
as the default location for storing all your projects.
2. Click OK.
The default workspace is accepted. The CodeWarrior IDE launches and the
Welcome page appears.
NOTE
The Welcome page appears only if the CodeWarrior IDE
or the selected workspace is started for the first time.
Otherwise, the Workbench window appears.
3. Click Go to Workbench, on the Welcome page.
The workbench window appears.
CodeWarrior Development Studio for Power Architecture Processors Targeting Manual, Rev. 10.5.0,
06/2015
Freescale Semiconductor, Inc.
49
Creating projects
4. Select File > New > CodeWarrior Bareboard Project Wizard, from the
CodeWarrior IDE menu bar.
The CodeWarrior Bareboard Project Wizard launches and the Create a
CodeWarrior Bareboard Project page appears.
5. Specify a name for the new project in the Project name text box.
For example, enter the project name as library_project.
6. If you do not want to create your project in the default workspace:
a. Clear the Use default location checkbox.
b. Click Browse and select the desired location from the Browse For Folder
dialog box.
c. In the Location text box, append the location with the name of the directory in
which you want to create your project.
NOTE
An existing directory cannot be specified for the
project location.
7. Click Next.
The Processor page appears.
8. Select the target processor for the new project, from the Processor list.
9. Select Static Library from the Project Output group, to create a library with .a
extension, that can be included in other projects. Library files created using this
option do not include board specific details.
10. Click Next.
The Build Settings page appears.
11. Select the programming language, you want to use, from the Language group.
The language you select determines the libraries that are linked with your program
and the contents of the main source file that the wizard generates.
12. Select a toolchain from the Toolchain group.
Selected toolchain sets up the default compiler, linker, and libraries used to build the
new project. Each toolchain generates code targeted for a specific platform.
NOTE
The current release does not include toolchains for Linux
applications by default. To add the required build tools
support, you should install the corresponding service pack
for the required target. For more information on installing
CodeWarrior Development Studio for Power Architecture Processors Targeting Manual, Rev. 10.5.0,
06/2015
50
Freescale Semiconductor, Inc.
Chapter 2 Working with Projects
service packs, see the Service Pack Updater Quickstart
available in the <CWInstallDir>\PA\ folder.
13. Select an option from the Floating Point drop-down list, to prompt the compiler to
handle the floating-point operations by generating instructions for the selected
floating-point unit.
14. Click Finish.
The wizard creates a library project according to your specifications. You can access
the project from the CodeWarrior Projects view on the Workbench.
The new library project is ready for use. You can now customize the project to match
your requirements.
2.3.3 Creating CodeWarrior Linux Application Project
You can create a CodeWarrior Linux application project using the CodeWarrior Linux
Project Wizard.
To create a CodeWarrior Linux application project, perform these steps:
1. Select Start > All Programs > Freescale CodeWarrior > CW for Power
Architecture vnumber > CodeWarrior IDE, where number is the version number
of your product.
The Workspace Launcher dialog box appears, prompting you to select a workspace
to use.
NOTE
Click Browse to change the default location for workspace
folder. You can also select the Use this as the default and
do not ask again checkbox to set default or selected path as
the default location for storing all your projects.
2. Click OK.
The default workspace is accepted. The CodeWarrior IDE launches and the
Welcome page appears.
NOTE
The Welcome page appears only if the CodeWarrior IDE
or the selected workspace is started for the first time.
Otherwise, the Workbench window appears.
CodeWarrior Development Studio for Power Architecture Processors Targeting Manual, Rev. 10.5.0,
06/2015
Freescale Semiconductor, Inc.
51
Creating projects
3. Click Go to Workbench, on the Welcome page.
The workbench window appears.
4. Select File > New > CodeWarrior Linux Project Wizard, from the CodeWarrior
IDE menu bar.
The CodeWarrior Linux Project Wizard launches and the Create a CodeWarrior
Linux Project page appears.
5. Specify a name for the new project in the Project name text box.
For example, enter the project name as linux_project.
6. If you do not want to create your project in the default workspace:
a. Clear the Use default location checkbox.
b. Click Browse and select the desired location from the Browse For Folder
dialog box.
c. In the Location text box, append the location with the name of the directory in
which you want to create your project.
NOTE
An existing directory cannot be specified for the
project location.
7. Click Next.
The Processor page appears.
8. Select the target processor for the new project, from the Processor list.
9. Select Application from the Project Output group, to create an application
with .elf extension, that includes information required to debug the project.
10. Click Next.
The Build Settings page appears.
11. Select a toolchain for Linux applications from the Toolchain group.
Selected toolchain sets up the default compiler, linker, and libraries used to build the
new project. Each toolchain generates code targeted for a specific platform.
NOTE
The current release does not include toolchains for Linux
applications by default. To add the required Linux build
tools support, you should install the corresponding service
pack for the required target. For more information on
CodeWarrior Development Studio for Power Architecture Processors Targeting Manual, Rev. 10.5.0,
06/2015
52
Freescale Semiconductor, Inc.
Chapter 2 Working with Projects
installing service packs, see the Service Pack Updater
Quickstart available in the <CWInstallDir>\PA\ folder.
12. Select the programming language, you want to use, from the Language group.
The language you select determines the libraries that are linked with your program
and the contents of the main source file that the wizard generates.
13. Select the architecture type used by the new project, from the Build Tools
Architecture group.
NOTE
For projects created for QorIQ_P5 processors, both the 32
bit and 64 bit options are enabled and can be selected. For
all other processors, 32 bit option is selected by default and
64 bit is disabled and cannot be selected.
14. Click Next.
The Linux Application page appears.
15. Select CodeWarrior TRK to use the CodeWarrior Target Resident Kernel (TRK)
protocol, to download and control application on the Linux host system.
NOTE
When debugging a Linux application, you must use the
CodeWarrior TRK to manage the communications interface
between the debugger and Linux system. For details, see
Install CodeWarrior TRK on Target System.
16. Specify a Remote System Configuration option.
17. In the IP Address text box, enter the IP Address of the Linux host system, the
project executes on.
18. In the Port text box, enter the port number that the debugger will use to
communicate to the Linux host system.
19. In the Remote Download Path text box, enter the absolute path for the host
directory, into which the debugger downloads the application.
20. Click Finish.
The wizard creates a CodeWarrior Linux application project according to your
specifications. You can access the project from the CodeWarrior Projects view on
the Workbench.
The new CodeWarrior Linux application project is ready for use. You can now customize
the project to match your requirements.
CodeWarrior Development Studio for Power Architecture Processors Targeting Manual, Rev. 10.5.0,
06/2015
Freescale Semiconductor, Inc.
53
Building projects
2.4 Building projects
CodeWarrior IDE supports two modes of building projects, manual-build mode and autobuild mode.
2.4.1 Manual-Build mode
In large workspaces, building the entire workspace can take a long time if users make
changes with a significant impact on dependent projects. Often there are only a few
projects that really matter to a user at a given time.
To build only the selected projects, and any prerequisite projects that need to be built to
correctly build the selected projects, select Project > Build Project from the
CodeWarrior IDE menu bar.
Figure 2-11. Project Menu- Build Project
Alternatively, right-click on the selected project in the CodeWarrior Projects view and
select Build Project from the context menu.
To build all projects available in the CodeWarrior Projects view, select Project >
Build All.
CodeWarrior Development Studio for Power Architecture Processors Targeting Manual, Rev. 10.5.0,
06/2015
54
Freescale Semiconductor, Inc.
Chapter 2 Working with Projects
Figure 2-12. Project Menu-Build All
2.4.2 Auto-Build mode
CodeWarrior IDE takes care of compiling source files automatically. When auto-build is
enabled, project build occurs automatically in the background every time you change
files in the workspace (for example saving an editor).
To automatically build all the projects in a workspace, select Project > Build
Automatically from the CodeWarrior IDE menu bar.
Figure 2-13. Project Menu-Build Automatically
If auto-build is taking too long and is interfering with ongoing development, it can be
turned off. Select Project > Build Automatically from the CodeWarrior IDE menu bar
to disable auto-build mode.
CodeWarrior Development Studio for Power Architecture Processors Targeting Manual, Rev. 10.5.0,
06/2015
Freescale Semiconductor, Inc.
55
Importing Classic CodeWarrior Projects
NOTE
It is advised that you do not use the Build Automatically
option for C/C++ development. Using this option will result in
building the entire project whenever you save a change to the
makefile or source files. This can take a significant amount of
time for very large projects.
2.5 Importing Classic CodeWarrior Projects
The CodeWarrior Project Importer feature in Eclipse IDE helps automate the conversion
of a legacy C/C++ CodeWarrior IDE project to a project supported by the latest versions
of the CodeWarrior IDE.
This feature lets you:
•
•
•
•
•
•
•
•
Select the classic CodeWarrior project
Set targets to import
Configure source trees and shielded folders
Edit access paths for each target
List files that are not found in the previous settings
Specify the new project name and location
List warnings or errors in the conversion process
Open the newly created Eclipse project.
NOTE
For more information on importing classic CodeWarrior
projects to the latest versions of the CodeWarrior IDE, see
the CodeWarrior Common Features Guide from the
<CWInstallDir>\PA\Help\PDF\ folder.
2.6 Deleting Projects
Using the options available in CodeWarrior IDE, you can delete a project and optionally
the resources linked to the project.
To delete a project, follow these steps:
1. Select the project you want to delete in the CodeWarrior Projects view.
CodeWarrior Development Studio for Power Architecture Processors Targeting Manual, Rev. 10.5.0,
06/2015
56
Freescale Semiconductor, Inc.
Chapter 2 Working with Projects
2. Select Edit > Delete.
The Delete Resources dialog box appears.
NOTE
Alternatively, you can also select Delete from the context
menu that appears when you right-click the project.
3. Select the Delete project contents on disk (cannot be undone) option to delete the
project contents permanently.
NOTE
You will not be able to restore your project using Undo, if
you select the Delete project contents on disk (cannot be
undone) option.
4. Click OK.
NOTE
In case, the Unreferenced Remote Systems dialog box
appears displaying a list of remote systems used by the
deleted project, click Remove to delete the unreferenced
remote systems. Alternatively, click Cancel to reuse the
remote systems.
The selected project is deleted and relevant details of the project are removed from the
CodeWarrior Projects view.
CodeWarrior Development Studio for Power Architecture Processors Targeting Manual, Rev. 10.5.0,
06/2015
Freescale Semiconductor, Inc.
57
Deleting Projects
CodeWarrior Development Studio for Power Architecture Processors Targeting Manual, Rev. 10.5.0,
06/2015
58
Freescale Semiconductor, Inc.
Chapter 3
Build Properties
A build configuration is a named collection of build tools options. The set of options in a
given build configuration causes the build tools to generate a final binary with specific
characteristics. For example, the binary produced by a "Debug" build configuration might
contain symbolic debugging information and have no optimizations, while the binary
product by a "Release" build configuration might contain no symbolics and be highly
optimized.
NOTE
The settings of the CodeWarrior IDE's build and launch
configuration correspond to an object called a target made by
the classic CodeWarrior IDE.
This chapter explains:
• Changing Build Properties
• Restoring Build Properties
• Build Properties for Power Architecture
3.1 Changing Build Properties
You can modify the build properties of a project to better suit your needs.
To change build properties of a project, perform the steps given below:
1. Start the CodeWarrior IDE.
2. In the CodeWarrior Projects view, select the project for which you want to modify
the build properties.
3. Select Project > Properties from the menu bar.
CodeWarrior Development Studio for Power Architecture Processors Targeting Manual, Rev. 10.5.0,
06/2015
Freescale Semiconductor, Inc.
59
Restoring Build Properties
The Properties for <project> window appears. The left pane of this window shows
the build properties that apply to the current project.
4. Expand the C/C++ Build property.
5. Select Settings.
6. Use the Configuration drop-down list in the right pane to specify the launch
configuration for which you want to modify the build properties.
7. Click the Tool Settings tab. The corresponding page appears.
8. From the list of tools on the Tool Settings page, select the tool for which you want to
modify properties.
9. Change the settings that appear in the page.
10. Click Apply.
The IDE saves your new settings.
You can select other tool pages and modify their settings. When you finish, click OK to
save your changes and close the Properties for <project> window.
3.2 Restoring Build Properties
If you had modified a build configuration of a project in the past, you can restore the
build properties to have a factory-default configuration, or to revert to a last-known
working build configuration.
To undo your modifications to build properties, click Restore Defaults at the bottom of
the Properties window.
This changes the values of the options to the absolute default of the toolchain. By default,
the toolchain options are blank.
For example, when a Power Architecture project is created the Power ELF Linker panel
has some values set, which are specific to the project. By selecting Restore Defaults the
default values of settings will return to blank state of the toolchain.
3.3 Build Properties for Power Architecture
Based on different processor families, CodeWarrior for Power Architecture supports both
CodeWarrior and GCC builds tools.
CodeWarrior Development Studio for Power Architecture Processors Targeting Manual, Rev. 10.5.0,
06/2015
60
Freescale Semiconductor, Inc.
Chapter 3 Build Properties
The build tools used in a project depend upon the processor and the build toolchain that is
selected while creating a project.
The table below lists the build tools supported by different processors.
Table 3-1. Build Tools for Power Architecture Processor Families
Family
Processor
Build Tool
82xx
8250
CodeWarrior tools
83xx
8306
CodeWarrior tools
8309
CodeWarrior tools
8377
CodeWarrior tools
8536
CodeWarrior tools
8548
CodeWarrior tools
8560
CodeWarrior tools
8568
CodeWarrior tools
8569
CodeWarrior tools
8572
CodeWarrior tools
C29x
C29x
CodeWarrior tools
Qonverge
B4420
GCC tools
B4460
GCC tools
B4860
GCC tools
BSC9131
CodeWarrior/GCC tools
BSC9132
CodeWarrior/GCC tools
G1110
CodeWarrior/GCC tools
G4860
GCC tools
P1010
CodeWarrior tools
P1011
CodeWarrior tools
P1012
CodeWarrior tools
P1013
CodeWarrior tools
P1014
CodeWarrior tools
P1015
CodeWarrior tools
P1016
CodeWarrior tools
P1017
CodeWarrior tools
P1020
CodeWarrior tools
P1021
CodeWarrior/GCC tools
P1022
CodeWarrior tools
P1023
CodeWarrior tools
P1024
CodeWarrior tools
P1025
CodeWarrior tools
P2010
CodeWarrior tools
P2020
CodeWarrior tools
P2040
GCC tools
85xx
QorIQ_P1
QorIQ_P2
Table continues on the next page...
CodeWarrior Development Studio for Power Architecture Processors Targeting Manual, Rev. 10.5.0,
06/2015
Freescale Semiconductor, Inc.
61
Build Properties for Power Architecture
Table 3-1. Build Tools for Power Architecture Processor Families
(continued)
Family
Processor
Build Tool
P2041
GCC tools
QorIQ_P3
P3041
GCC tools
QorIQ_P4
P4040
GCC tools
P4080
GCC tools
P5010
GCC tools
P5020
GCC tools
P5021
GCC tools
P5040
GCC tools
T1013
GCC tools
T1014
GCC tools
T1020
GCC tools
T1022
GCC tools
T1023
GCC tools
T1024
GCC tools
T1040
GCC tools
T1042
GCC tools
T2080
GCC tools
T2081
GCC tools
T4160
GCC tools
T4240
GCC tools
QorIQ_P5
QorIQ_T1
QorIQ_T2
QorIQ_T4
The following sections will help you with more details on the build tools supported by
the current installation:
• CodeWarrior Build Tool Settings
• GCC Build Tool Settings
3.3.1 CodeWarrior Build Tool Settings
CodeWarrior build tools are build tools developed by Freescale.
The table below lists the CodeWarrior build tool settings specific to developing software
for Power Architecture.
CodeWarrior Development Studio for Power Architecture Processors Targeting Manual, Rev. 10.5.0,
06/2015
62
Freescale Semiconductor, Inc.
Chapter 3 Build Properties
NOTE
For more details on CodeWarrior build tools, see the Power
Architecture Build Tools Reference Manual available in the
<CWInstallDir>\PA\Help\PDF\ folder.
Table 3-2. CodeWarrior Build Tool Settings for Power Architecture
Build Tool
Build Properties Panels
PowerPC CPU
Debugging
Messages
PowerPC Linker
Input
Link Order
General
Output
PowerPC Compiler
Preprocessor
Input
Warnings
Optimization
Processor
C/C++ Language
PowerPC Assembler
Input
General
PowerPC Disassembler
Disassembler Settings
PowerPC Preprocessor
Preprocessor Settings
3.3.1.1 PowerPC CPU
Use the PowerPC CPU panel to specify the Power Architecture processor family for the
project.
The properties specified on this page are also used by the build tools (compiler, linker,
and assembler).
The table below lists and describes the various options available on the PowerPC CPU
panel.
Table 3-3. CodeWarrior Build Tool Settings - PowerPC CPU Options
Option
Processor
Explanation
Generates and links object code for a specific processor. This setting is equivalent to
specifying the -proc[essor] keyword command-line option.
Table continues on the next page...
CodeWarrior Development Studio for Power Architecture Processors Targeting Manual, Rev. 10.5.0,
06/2015
Freescale Semiconductor, Inc.
63
Build Properties for Power Architecture
Table 3-3. CodeWarrior Build Tool Settings - PowerPC CPU Options (continued)
Option
Explanation
Floating Point
Controls floating-point code generation. This setting is equivalent to specifying the -fp
keyword command-line option.
Byte Ordering
Generates object code and links an executable image to use the specified data format.
This setting is equivalent to specifying the -big or -little command-line options.
Code Model
Specifies the addressing mode that the linker uses when resolving references. This
setting is equivalent to specifying the -model keyword command-line option.
ABI
Chooses which ABI (Application Binary Interface) to conform to. This setting is
equivalent to specifying the -abi keyword command-line option.
Tune Relocations
Ensures that references made by the linker conform to the PowerPC EABI (Embedded
Application Binary Interface) or position-independent ABI (Application Binary Interface).
Use this option only when you select EABI or SDA PIC/PID from the ABI drop-down
list, to ensure that references in the executable image conform to these ABIs. To
conform to both of these ABIs, the linker will modify relocations that do not reach the
desired executable code. The linker first converts near branch instructions to far branch
instructions. Then it will convert absolute branches to PC-relative branches. For
branches that cannot be converted to far or PC-relative addressing, the linker will
generate branch islands. To conform to the SDA PIC/PID ABI, the linker will generate
the appropriate style of addressing. This setting is equivalent to specifying the tune_relocations command-line option.
Compress for PowerPC VLE (Zen)
Specifies compression of the VLE (Variable Length Encoding) code by shortening the
gaps between the functions.
NOTE: For Power Architecture processors that do not have the VLE capability, this
option is disabled and cannot be selected.
Small Data
Limits the size of the largest objects in the small data section. This setting is equivalent
to specifying the -sdata[threshold] size command-line option. The size value
specifies the maximum size, in bytes, of all objects in the small data section (.sdata).
The default value for size is 8. The linker places objects that are greater than this size
in the data section (.data) instead.
Small Data2
Limits the size of the largest objects in the small constant data section. This setting is
equivalent to specifying the -sdata2[threshold] size command-line option. The
size value specifies the maximum size, in bytes, of all objects in the small constant data
section (.sdata2). The default value for size is 8. The linker places constant objects
that are greater than this size in the constant data section (.rodata) instead.
3.3.1.2 Debugging
Use the Debugging panel to specify the global debugging options for the project.
CodeWarrior Development Studio for Power Architecture Processors Targeting Manual, Rev. 10.5.0,
06/2015
64
Freescale Semiconductor, Inc.
Chapter 3 Build Properties
The table below lists and describes the various options available on the Debugging panel.
Table 3-4. CodeWarrior Build Tool Settings - Debugging Options
Option
Explanation
Generate DWARF Information
Generates DWARF 2.x conforming debugging information. This setting is equivalent to
specifying the -sym dwarf-2 command-line option.
Store Full Paths To Source Files
Stores absolute paths of the source files instead of relative paths. This setting is
equivalent to specifying the -sym full[path] command-line option.
3.3.1.3 Messages
Use the Messages panel to specify the error and warning message options for the project.
The table below lists and describes the various options available on the Messages panel.
Table 3-5. CodeWarrior Build Tool Settings - Messages Options
Option
Explanation
Message Style
Controls the style used to show error and warning messages. This setting is equivalent
to specifying the -msgstyle keyword command-line option.
Maximum Number of Errors
Specifies the maximum number of errors messages to show. This setting is equivalent
to specifying the -maxerrors number command-line option.
Maximum Number of Warnings
Specifies the maximum number of warning messages to show. This setting is
equivalent to specifying the -maxwarnings number command-line option.
3.3.1.4 PowerPC Linker
Use the PowerPC Linker panel to specify the CodeWarrior linker options that are
specific to Power Architecture software development.
NOTE
The list of tools presented on the Tool Settings page can differ,
based upon the toolchain used by the project.
CodeWarrior Development Studio for Power Architecture Processors Targeting Manual, Rev. 10.5.0,
06/2015
Freescale Semiconductor, Inc.
65
Build Properties for Power Architecture
The table below lists and describes the various options available on the PowerPC Linker
panel.
Table 3-6. CodeWarrior Build Tool Settings - PowerPC Linker Options
Option
Explanation
Command
Specifies the location of the linker executable file.
All Options
Specifies the actual command line, the linker will be called with.
Expert settings:
Specifies the expert settings command line parameters.
Command line pattern
3.3.1.4.1
Input
Use the Input panel to specify the path to the linker command file and the libraries.
The table below lists and describes the various options available on the Input panel.
Table 3-7. CodeWarrior Build Tool Settings - Input Options
Option
Explanation
No Standard Library
Uses standard system library access paths as specified by the environment variable
%MWLibraries% to add system libraries as specified by the environment variable
%MWLibraryFiles% at the end of link order. This setting is equivalent to specifying
the -nostdlib command-line option.
Link Command File (.lcf)
Specifies the path of the linker-command file that the linker reads to determine how to
build the output file. Alternatively, click Browse, then use the resulting dialog box to
specify the linker command file. This setting is equivalent to specifying the -lcf
filename command-line option.
Code Address
Sets the run-time address of the executable code. This setting is equivalent to
specifying the -codeaddr addr command-line option. The addr value is an address,
in decimal or hexadecimal format. Hexadecimal values must begin with 0x. The default
is 65536. This option is disabled and cannot be selected if you have specified
the .lcf file in the Link Command File (.lcf) text box.
Data Address
Sets the loading address of the data. This setting is equivalent to specifying the dataaddr addr command-line option. The addr value is an address, in decimal or
hexadecimal format. Hexadecimal values must begin with 0x. The default is the
address after the code and large constant sections. This option is disabled and cannot
be selected if you have specified the .lcf file in the Link Command File (.lcf) text
box.
Small Data Address
Sets the loading address of small data. This setting is equivalent to specifying the sdataaddr addr command-line option. The addr value is an address, in decimal or
hexadecimal format. Hexadecimal values must begin with 0x. The default is the
address after the large data section. This option is disabled and cannot be selected if
you have specified the .lcf file in the Link Command File (.lcf) text box.
Table continues on the next page...
CodeWarrior Development Studio for Power Architecture Processors Targeting Manual, Rev. 10.5.0,
06/2015
66
Freescale Semiconductor, Inc.
Chapter 3 Build Properties
Table 3-7. CodeWarrior Build Tool Settings - Input Options (continued)
Option
Explanation
Small Data 2 Address
Sets the loading address of small constant data. This setting is equivalent to specifying
the -sdata2addr addr command-line option. The addr value is an address, in
decimal or hexadecimal format. Hexadecimal values must begin with 0x. The default is
the address after the small data section. This option is disabled and cannot be selected
if you have specified the .lcf file in the Link Command File (.lcf) text box.
Entry Point
Specifies the main entry point for the executable image. This setting is equivalent to
specifying the -m[ain] symbol command-line option. The maximum length of
symbol is 63 characters. The default is _start.
Library Search Paths
Use this panel to specify multiple paths that the Power Architecture linker searches for
libraries. The linker searches the paths in the order shown in this list. The table that
follows lists and describes the toolbar buttons that help work with the library search
paths.
Library Files
Lists paths to libraries that the Power Architecture linker uses. The linker uses the
libraries in the order shown in this list. The table that follows lists and describes the
toolbar buttons that help work with the library file search paths.
The table below lists and describes the toolbar buttons that help work with the library
search paths.
Table 3-8. CodeWarrior Build Tool Settings - Input Toolbar Buttons
Button
3.3.1.4.2
Tooltip
Description
Add
Click to open the Add file path or the Add directory path dialog box and
create a file or directory path.
Delete
Click to delete the selected file or directory. To confirm deletion, click Yes
in the Confirm Delete dialog box.
Edit
Click to open the Edit file path or Edit directory path dialog box and
update the selected file or directory.
Move up
Click to move the selected file search path one position higher in the list.
Move down
Click to move the selected file search path one position lower in the list.
Link Order
Use the Link Order panel to control the link input order.
CodeWarrior Development Studio for Power Architecture Processors Targeting Manual, Rev. 10.5.0,
06/2015
Freescale Semiconductor, Inc.
67
Build Properties for Power Architecture
The table below lists and describes the various options available on the Link Order
panel.
Table 3-9. CodeWarrior Build Tool Settings - Link Order Options
Option
Explanation
Customize linker input order
Allows to change the default link input order. Selecting this option enables the Link
Order panel, allowing you to change the default link input order by using the Move Up
and Move Down buttons on the Link Order panel toolbar.
Link Order
Shows the default link input order that you can change by selecting a link input and
clicking the Move Up or Move Down button on the Link Order panel toolbar.
3.3.1.4.3
General
Use the General panel to specify the linker performance and optimization parameters.
The table below lists and describes the various options available on the General panel.
Table 3-10. CodeWarrior Build Tool Settings - General Options
Option
Link Mode
Explanation
Controls the performance of the linker. The default options are:
• Normal - Uses little memory but may take more processing time.
• Use Less RAM - Uses medium amount of memory for medium processing time.
• Use More RAM - Uses lots of memory to improve processing time.
This setting is equivalent to specifying the -linkmode keyword command-line
option.
Code Merging
Code merging reduces the size of object code by removing identical functions. This
option takes the following values:
• Off - Disables code merging optimization. This is the default value.
• All Functions - Controls code merging for all identical functions.
• Safe Functions - Controls code merging for weak functions.
This setting is equivalent to specifying the -code_merging off | all | safe
command-line option.
Aggresive Merging
The code merging optimization will not remove an identical copy of a function if your
program refers to its address. In this case, the compiler keeps this copied function but
replaces its executable code with a branch instruction to the original function. To ignore
references to function addresses, use aggressive code merging. This setting is
equivalent to specifying the -code_merging all,aggressive or code_merging safe,aggressive command-line options.
Merges FP Constants
Compiler pools strings of a file, when the option is checked. Clear this option to keep
individual the strings of each file. (This permits deadstripping of unused strings.) This
setting is equivalent to specifying the #pragma fp_constants merge pragma.
Other Flags
Specify linker flags.
CodeWarrior Development Studio for Power Architecture Processors Targeting Manual, Rev. 10.5.0,
06/2015
68
Freescale Semiconductor, Inc.
Chapter 3 Build Properties
3.3.1.4.4
Output
Use the Output panel to specify the configuration of your final output file.
The table below lists and describes the various options available on the Output panel.
Table 3-11. CodeWarrior Build Tool Settings - Output Options
Option
Output Type
Explanation
Specifies the generated output type. The default options are:
• Application
• Static Library
• Partial Link
This setting is equivalent to specifying the -application, -library, -partial
command-line options.
Optimize Partial Link
Specifies the use of a linker command file, create tables for C++ static constructors, C+
+ static destructors, and C++ exceptions. This option also configures the linker to build
an executable image, even if some symbols cannot be resolved.
NOTE: Select Partial Link from the Output Type list box to enable this option.
This setting is equivalent to specifying the -opt_partial command-line option.
Deadstrip Unused Symbols
Removes unreferenced objects on a partially linked image.
NOTE: Select Partial Link from the Output Type list box to enable this option.
This setting is equivalent to specifying the -strip_partial command-line option.
Require Resolved Symbols
Finishes a partial link operation and issues error messages for unresolved symbols.
NOTE: Select Partial Link from the Output Type list box to enable this option.
This setting is equivalent to specifying the -resolved_partial command-line
option.
Heap Size (k)
Sets the run-time size of the heap, in kilobytes. This setting is equivalent to specifying
the -heapsize size command-line option.
Stack Size (k)
Sets the run-time size of the stack, in kilobytes. This setting is equivalent to specifying
the -stacksize size command-line option.
Interpreter
Specifies the interpreter file used by the linker.
Generate Link Map
Generates a text file that describes the contents of the linker's output file. This setting is
equivalent to specifying the -map [filename] command-line option.
List Closure
Controls the appearance of symbol closures in the linker map file. This setting is
equivalent to specifying the -listclosure command-line option.
List Unused Objects
Controls the appearance of a list of unused symbols in the linker map file. This setting
is equivalent to specifying the -mapunused command-line option.
List DWARF Objects
Controls the appearance of DWARF debugging information in the linker map file. This
setting is equivalent to specifying the -listdwarf command-line option.
Generate Binary File
Controls generation of the binary files. The default options are:
• None - Generates no binary file even if S-record generation is on. This is the
default option.
• One - Generates a single binary file with all the loadable code and data, even if
S-record generation is off.
• Multiple - Generates separate binary files for each MEMORY directive, even if Srecord generation is off.
Table continues on the next page...
CodeWarrior Development Studio for Power Architecture Processors Targeting Manual, Rev. 10.5.0,
06/2015
Freescale Semiconductor, Inc.
69
Build Properties for Power Architecture
Table 3-11. CodeWarrior Build Tool Settings - Output Options (continued)
Option
Explanation
This setting is equivalent to specifying the -genbinary keyword command-line
option.
Generate S-Record File
Generates an S-record file. This setting is equivalent to specifying the -srec
command-line option.
Sort S-Record
Sorts the records, in ascending order, in an S-record file.
NOTE: Select Generate S-Record File to enable this option.
This setting is equivalent to specifying the -sortsrec command-line option.
Max S-Record Length
Specifies the length of S-records. You can select a value from 8 to 255. The default is
26.
NOTE: Select Generate S-Record File to enable this option.
This setting is equivalent to specifying the -sreclength command-line option.
EOL Character
Specifies the end-of-line style to use in an S-record file. The default options are:
• Mac - Use Mac OS®-style end-of-line format.
• DOS - Use Microsoft® Windows®-style end-of-line format. This is the default
choice.
• UNIX - Use a UNIX-style end-of-line format.
NOTE: Select Generate S-Record File to enable this option.
This setting is equivalent to specifying the -sreceol keyword command-line option.
Generate Warning Messages
Turns on most warning messages issued by the build tools. This setting is equivalent to
specifying the -w on command-line option.
Heap Address
Sets the run-time address of the heap. The specified address must be in decimal or
hexadecimal format. Hexadecimal values must begin with 0x. The default is
stack_address - (heap_size + stack_size) where stack_address is the
address of the stack, heap_size is the size of the heap, and stack_size is the
size of the stack. This setting is equivalent to specifying the -heapaddr address
command-line option.
Stack Address
Sets the run-time address of the stack. The specified address must be in decimal or
hexadecimal format. Hexadecimal values must begin with 0x. This setting is equivalent
to specifying the -stackaddr address command-line option.
Generate ROM Image
Enables generation of a program image that may be stored in and started from ROM.
ROM Image Address
Generates a ROM image and specifies the image's starting address at run time.
NOTE: Select Generate ROM Image to enable this option.
This setting is equivalent to specifying the -romaddr address command-line option.
RAM Buffer Address of ROM Image Specifies a run-time address in which to store the executable image in RAM so that it
may be transferred to flash memory.
NOTE: Select Generate ROM Image to enable this option.
This option specifies information for a legacy flashing tool (some development boards
that used the Power Architecture 821 processor). This tool required that the executable
image must first be loaded to an area in RAM before being transferred to ROM.
NOTE: Do not use this option if your flash memory tool does not follow this behavior.
This setting is equivalent to specifying the -rombuffer address command-line
option.
CodeWarrior Development Studio for Power Architecture Processors Targeting Manual, Rev. 10.5.0,
06/2015
70
Freescale Semiconductor, Inc.
Chapter 3 Build Properties
3.3.1.5 PowerPC Compiler
Use the PowerPC Compiler panel to specify the compiler options that are specific to
Power Architecture software development.
The table below lists and describes the various options available on the PowerPC
Compiler panel.
Table 3-12. CodeWarrior Build Tool Settings - PowerPC Compiler Options
Option
Explanation
Command
Specifies the location of the PowerPC ELF compiler executable file that will be used to
build the project.
All Options
The actual command line the compiler will be called with.
Expert settings:
Shows the expert settings command line parameters.
Command line pattern
3.3.1.5.1
Preprocessor
Use the Preprocessor panel to specify the preprocessor behavior by providing details of
the file, whose contents can be used as prefix to all source files.
The table below lists and describes the various options available on the Preprocessor
panel.
Table 3-13. CodeWarrior Build Tool Settings - Preprocessor Options
Option
Explanation
Prefix Files
Adds contents of a text file or precompiled header as a prefix to all source files. This
setting is equivalent to specifying the -prefixfile command-line option.
Source encoding
Specifies the default source encoding used by the compiler. The compiler automatically
detects UTF-8 (Unicode Transformation Format) header or UCS-2/UCS-4 (Uniform
Communications Standard) encodings regardless of setting. The default setting is ascii.
This setting is equivalent to specifying the -enc[oding] keyword command-line
option.
Defined Macros (-D)
Defines a specified symbol name. This setting is equivalent to specifying the -D name
command-line option, where name is the symbol name to define.
Undefined Macros (-U)
Undefines the specified symbol name. This setting is equivalent to specifying the -U
name command-line option, where name is the symbol name to undefine.
3.3.1.5.2
Input
Use the Input panel to specify the path and search order of the #include files.
CodeWarrior Development Studio for Power Architecture Processors Targeting Manual, Rev. 10.5.0,
06/2015
Freescale Semiconductor, Inc.
71
Build Properties for Power Architecture
The table below lists and describes the various options available on the Input panel.
Table 3-14. CodeWarrior Build Tool Settings - Input Options
Option
Explanation
Compile Only, Do Not Link
Instructs the compiler to compile but not invoke the linker to link the object code. This
setting is equivalent to specifying the -c command-line option.
Do not use MWCIncludes variable
Restricts usage of standard system include paths as specified by the environment
variable %MWCIncludes%. This setting is equivalent to specifying the -nostdinc
command-line option.
Always Search User Paths
Performs a search of both the user and system paths, treating #include statements
of the form #include <xyz> the same as the form #include "xyz". This setting is
equivalent to specifying the -nosyspath command-line option.
User Path (-i)
Use this panel to specify multiple user paths and the order in which to search those
paths. The table that follows lists and describes the toolbar buttons that help work with
the file search paths. This setting is equivalent to specifying the -i command-line
option.
User Recursive Path (-ir)
Appends a recursive access path to the current User Path list. The table that follows
lists and describes the toolbar buttons that help work with the file search paths. This
setting is equivalent to specifying the -ir path command-line option.
System Path (-I- -I)
Changes the build target's search order of access paths to start with the system paths
list. The table that follows lists and describes the toolbar buttons that help work with the
file search paths.
• The compiler can search #include files in several different ways. Use this panel
to set the search order as follows:
• For include statements of the form #include "xyz", the compiler first
searches user paths, then the system paths
• For include statements of the form #include <xyz>, the compiler searches
only system paths
This setting is equivalent to specifying the -I- -I path command-line option.
System Recursive Path (-I- -ir)
Appends a recursive access path to the current System Path list. The table that follows
lists and describes the toolbar buttons that help work with the file search paths. This
setting is equivalent to specifying the -I- -ir command-line option.
Disable CW Extensions
Controls deadstripping files. Not all third-party linkers require checking this option.
The table below lists and describes the toolbar buttons that help work with the Input
panel.
Table 3-15. CodeWarrior Build Tool Settings - Input Toolbar Buttons
Button
Tooltip
Description
Add
Click to open the Add file path or the Add directory path dialog box and
create a file or directory path.
Delete
Click to delete the selected file or directory. To confirm deletion, click Yes
in the Confirm Delete dialog box.
Edit
Click to open the Edit file path or Edit directory path dialog box and
update the selected file or directory.
Move up
Click to move the selected file search path one position higher in the list.
Move down
Click to move the selected file search path one position lower in the list.
CodeWarrior Development Studio for Power Architecture Processors Targeting Manual, Rev. 10.5.0,
06/2015
72
Freescale Semiconductor, Inc.
Chapter 3 Build Properties
3.3.1.5.3
Warnings
Use the Warnings panel to control how the compiler reports the error and warning
messages.
The table below lists and describes the various options available on the Warnings panel.
Table 3-16. CodeWarrior Build Tool Settings - Warnings
Option
Explanation
Treat All Warnings As Errors
Select to make all warnings into hard errors. Source code which triggers warnings will
be rejected.
Illegal Pragmas
Select to issue a warning message if the compiler encounters an unrecognized
pragma. This setting is equivalent to specifying the pragma warn_illpragma
pragma and the -warnings illpragmas command-line option.
Possible Errors
Select to issue warning messages for common, usually-unintended logical errors: in
conditional statements, using the assignment (=) operator instead of the equality
comparison (==) operator, in expression statements, using the == operator instead of
the = operator, placing a semicolon (;) immediately after a do, while, if, or for
statement. This setting is equivalent to specifying the warn_possunwant pragma and
the -warnings possible command-line option.
Extended Error Checking
Select to issue warning messages for common programming errors: mis-matched
return type in a function's definition and the return statement in the function's body,
mismatched assignments to variables of enumerated types. This setting is equivalent to
specifying the extended_errorcheck pragma and the -warnings extended
command-line option.
Hidden virtual functions
Select to issue warning messages if you declare a non-virtual member function that
prevents a virtual function, that was defined in a superclass, from being called. This
setting is equivalent to specifying the warn_hidevirtual pragma and the warnings hidevirtual command-line option.
Implicit Arithmetic Conversions
Select to issue warning messages when the compiler applies implicit conversions that
may not give results you intend: assignments where the destination is not large enough
to hold the result of the conversion, a signed value converted to an unsigned value, an
integer or floating-point value is converted to a floating-point or integer value,
respectively. This setting is equivalent to specifying the warn_implicitconv pragma
and the -warnings implicitconv command-line option.
Implicit Integer To Float Conversions Select to issue warning messages for implicit conversions from integer to floating-point
values. This setting is equivalent to specifying the warn_impl_i2f_conv pragma and
the -warnings impl_int2float command-line option.
Implicit Float To Integer Conversions Select to issue warning messages for implicit conversions from floating point values to
integer values. This setting is equivalent to specifying the warn_impl_f2i_conv
pragma and the -warnings impl_float2int command-line option.
Implicit Signed/Unsigned
Conversions
Select to issue warning messages for implicit conversions from a signed or unsigned
integer value to an unsigned or signed value, respectively. This setting is equivalent to
specifying the warn_impl_s2u_conv pragma and the -warnings
signedunsigned command-line option.
Table continues on the next page...
CodeWarrior Development Studio for Power Architecture Processors Targeting Manual, Rev. 10.5.0,
06/2015
Freescale Semiconductor, Inc.
73
Build Properties for Power Architecture
Table 3-16. CodeWarrior Build Tool Settings - Warnings (continued)
Option
Explanation
Pointer/Integral Conversions
Select to issue warning messages for implicit conversions from pointer values to
integer values and from integer values to pointer values. This setting is equivalent to
specifying the warn_any_ptr_int_conv and warn_ptr_int_conv pragmas and
the -warnings ptrintconv, anyptrinvconv command-line option.
Unused Arguments
Select to issue warning messages for function arguments that are not referred to in a
function. This setting is equivalent to specifying the warn_unusedarg pragma and
the -warnings unusedarg command-line option.
Unused Variables
Select to issue warning messages for local variables that are not referred to in a
function. This setting is equivalent to specifying the warn_unusedvar pragma and the
-warnings unusedvar command-line option.
Missing `return' Statement
Select to issue warning messages, if a function that is defined to return a value has no
return statement. This setting is equivalent to specifying the warn_missingreturn
pragma and the -warnings missingreturn command-line option.
Expression Has No Side Effect
Select to issue warning messages if a statement does not change the program's state.
This setting is equivalent to specifying the warn_no_side_effect pragma and the warnings unusedexpr command-line option.
Extra Commas
Select to issue a warning messages if a list in an enumeration terminates with a
comma. The compiler ignores terminating commas in enumerations when compiling
source code that conforms to the ISO/IEC 9899-1999 ("C99") standard. This setting is
equivalent to specifying the warn_extracomma pragma and the -warnings
extracomma command-line option.
Empty Declarations
Select to issue warning messages if a declaration has no variable name. This setting is
equivalent to specifying the warn_emptydecl pragma and the -warnings
emptydecl command-line option.
Inconsistent `class' / 'struct' Usage
Select to issue warning messages if the class and struct keywords are used
interchangeably in the definition and declaration of the same identifier in C++ source
code. This setting is equivalent to specifying the warn_structclass pragma and the
-warnings structclass command-line option.
Include File Capitalization
Select to issue warning messages if the name of the file specified in a #include file
directive uses different letter case from a file on disk. This setting is equivalent to
specifying the warn_filenamecaps pragma and the -warnings filecaps
command-line option.
Check System Includes
Select to issue warning messages if the name of the file specified in a #include file
directive uses different letter case from a file on disk. This setting is equivalent to
specifying the warn_filenamecaps_system pragma and the -warnings
sysfilecaps command-line option.
Pad Bytes Added
Select to issue warning messages when the compiler adjusts the alignment of
components in a data structure. This setting is equivalent to specifying the
warn_padding pragma and the -warnings padding command-line option.
Undefined Macro in #if
Select to issue warning messages if an undefined macro appears in #if and #elif
directives. This setting is equivalent to specifying the warn_undefmacro pragma and
the -warnings undefmacro command-line option.
Non-Inlined Functions
Select to issue warning messages if a call to a function defined with the inline,
_inline_, or _inline keywords could not be replaced with the function body. This
setting is equivalent to specifying the warn_notinlined pragma and the -warnings
notinlined command-line option.
CodeWarrior Development Studio for Power Architecture Processors Targeting Manual, Rev. 10.5.0,
06/2015
74
Freescale Semiconductor, Inc.
Chapter 3 Build Properties
3.3.1.5.4
Optimization
Use the Optimization panel to control the code optimization settings.
The table below lists and describes the various options available on the Optimization
panel.
Table 3-17. CodeWarrior Build Tool Settings - Optimization Options
Option
Explanation
Optimization Level
Specifies code optimization options to apply to object code. This setting is equivalent to
specifying the -opt keyword command-line option.
Speed vs. Size
Specifies code optimization for speed or size. This setting is equivalent to specifying
the optimize_for_size on or optimize_for_size off pragmas and -opt
speed or -opt size command-line option.
Inlining
Specifies inline options. Default settings are:
• Smart - The compiler considers the functions declared with inline.
• Auto Inline - Inlines small functions even if they are not declared with the
inline qualifier.
• Off - Turns off inlining.
This setting is equivalent to specifying the -inline, -inline auto, or -inline
off command-line option.
Bottom-up Inlining
3.3.1.5.5
Select to instruct the compiler to inline functions from the last function called to the first
function in a chain of function calls. This setting is equivalent to specifying the
inline_bottom_up pragma and -inline bottomup command-line option.
Processor
Use the Processor panel to control the processor-dependent code-generation settings.
The table below lists and describes the various options available on the Processor panel.
Table 3-18. CodeWarrior Build Tool Settings - Processor Options
Option
Struct Alignment
Explanation
Specifies structure and array alignment. The default options are:
• PowerPC - Use conventional Power Architecture alignment. This
choice is the default.
• 68K - Use conventional Mac OS® 68K alignment.
• 68K 4-Byte - Use Mac OS® 68K 4-byte alignment.
This setting is equivalent to specifying the -align keyword commandline option.
Function Alignment
Specifies alignment of functions in executable code. The default alignment
is 4. However, at an optimization level 4, the alignment changes to 16. If
you are using -func_align 4 (or none) and if you are compiling for
VLE, then the linker will compress gaps between VLE functions:
Table continues on the next page...
CodeWarrior Development Studio for Power Architecture Processors Targeting Manual, Rev. 10.5.0,
06/2015
Freescale Semiconductor, Inc.
75
Build Properties for Power Architecture
Table 3-18. CodeWarrior Build Tool Settings - Processor Options (continued)
Option
Explanation
• If those functions are not called by a Classic PPC function
• The function has an alignment greater than 4.
NOTE: Compression of the gaps will only happen on files compiled by
the CodeWarrior compiler.
This setting is equivalent to specifying the -func_align command-line
option.
Relax HW IEEE
Controls the use of relaxed IEEE floating point operations. This setting is
equivalent to specifying the -relax_ieee command-line option.
Use Fused Mult-Add/Sub
Controls the use of fused multiply-addition instructions. This setting is
equivalent to specifying the -maf on | off command-line option.
Generate FSEL Instructions
Controls the use of FSEL instructions.
NOTE: Do not turn on this option, if the Power Architecture processor of
your target platform does not have hardware floating-point
capabilities, that includes fsel. This option only has an effect if
Relax HW IEEE option or -relax_ieee command-line option is
also specified. The default is off.
This setting is equivalent to specifying the -gen_fsel command-line
option.
Assume Ordered Compares
Controls the assumption of no unordered values in comparisons. This
setting is equivalent to specifying the -ordered-fp-compares, -noordered-fp-compares command-line options.
Vector Support
Specifies supported vector options. Default settings are:
• None - Turns off vectorization.
• SPE - Enables the SPE vector support. This option needs to be
enabled when the floating point is set to SPFP or DPFP as both
SPFP and DPFP require support from the SPE vector unit. If the
option is not turned on, the compiler generates a warning and
automatically enables the SPE vector generation.
• AltiVec - Enables the Altivec vector support and generate AltiVec
vectors and related instructions.
This setting is equivalent to specifying the -spe_vector and -vector
keyword command-line options.
Generate VRSAVE Instructions
Specifies generation of AltiVec vectors and instructions that use VRSAVE
prologue and epilogue code. This setting is equivalent to specifying the vector novrsave, -vector vrsave command-line options.
AltiVec Structure Moves
Controls the use of Altivec instructions to optimize block moves. This
setting is equivalent to specifying the -noaltivec_move_block, altivec_move_block command-line options.
Make Strings ReadOnly
Places string constants in a read-only section. This setting is equivalent to
specifying the -readonlystrings command-line options.
Merges String Constants
Specifies how the compiler will place strings of a file. If this option is
selected, the strings of a file will be kept as a pool; otherwise, they will be
placed separately.
NOTE: This option is enabled only when the Make Strings ReadOnly
option is selected.
Pool Data
Controls the grouping of similar-sized data objects. Use this option to
reduce the size of executable object code in functions that refer to many
objects of the same size. These similar-sized objects do not need to be of
Table continues on the next page...
CodeWarrior Development Studio for Power Architecture Processors Targeting Manual, Rev. 10.5.0,
06/2015
76
Freescale Semiconductor, Inc.
Chapter 3 Build Properties
Table 3-18. CodeWarrior Build Tool Settings - Processor Options (continued)
Option
Explanation
the same type. The compiler only applies this option to a function if the
function refers to at least 3 similar-sized objects. The objects must be
global or static. At the beginning of the function, the compiler generates
instructions to load the address of the first similar-sized object. The
compiler then uses this address to generate 1 instruction for each
subsequent reference to other similar-sized objects instead of the usual 2
instructions for loading an object using absolute addressing. This setting is
equivalent to specifying the pool_data pragma and -pool[data]
command-line option.
Use Common Section
Moves uninitialized data into a common section. The default is off. This
setting is equivalent to specifying the -common command-line option.
Use LMW STMW
Controls the use of multiple load and store instructions for function
prologues and epilogues. The default is off.
NOTE: This option is only available for big-endian processors. This
option is not available for big-endian e500v1 and e500v2
architectures when vector and double-precision floating-point
instructions are used.
This setting is equivalent to specifying the -use_lmw_stmw command-line
option.
Inlined Assembler is Volatile
Controls whether or not inline assembly statements will be optimized. This
setting is equivalent to specifying the -volatileasm, -novolatileasm
command-line options.
Instruction Scheduling
Controls the rearrangement of instructions to reduce the effects of
instruction latency. The default is off. This setting is equivalent to
specifying the -schedule command-line option.
Peephole Optimization
Specifies peephole optimization. This setting is equivalent to specifying the
peephole pragma and the -opt peep[hole] command-line option.
Profiler Information
Controls the appearance of calls to a profiler library at the entry and exit
points of each function. The default is off. This setting is equivalent to
specifying the -profile command-line option.
Generate ISEL Instructions (e500/Zen)
Controls the use of isel instructions. The default is off.
NOTE: If the Power Architecture processor of your target platform does
not implement the Freescale ISEL APU, this option appears
disabled and cannot be selected.
This setting is equivalent to specifying the -use-isel command-line
option.
Translate PPC Asm to VLE Asm (Zen)
Controls VLE code generation for inline assembly statements.
NOTE: If the Power Architecture processor of your target platform does
not have the VLE capability, this option appears disabled and
cannot be selected.
This setting is equivalent to specifying the -ppc_asm_to_vle commandline option.
3.3.1.5.6
C/C++ Language
CodeWarrior Development Studio for Power Architecture Processors Targeting Manual, Rev. 10.5.0,
06/2015
Freescale Semiconductor, Inc.
77
Build Properties for Power Architecture
Use the C/C++ Language panel to control compiler language features and some object
code storage features for the current build target.
The table below lists and describes the various options available on the C/C++ Language
panel.
Table 3-19. CodeWarrior Build Tool Settings - C/C++ Language Options
Option
Explanation
Force C++ Compilation
Translates all C source files as C++ source code. This setting is equivalent to
specifying the cplusplus pragma and -lang c++ command-line option.
ISO C++ Template Parser
Enforces the use of ISO/IEC 14882-1998 standard for C++ to translate templates, and
more careful use of the typename and template keywords. The compiler also follows
stricter rules for resolving names during declaration and instantiation. This setting is
equivalent to specifying the parse_func_templ pragma and -iso_templates
command-line option.
Use Instance Manager
Reduces compile time by generating any instance of a C++ template (or non-inlined
inline) function only once. This setting is equivalent to specifying the -instmgr
command-line option.
Enable C++ Exceptions
Generates executable code for C++ exceptions. Enable this option, if you use the try,
throw, and catch statements specified in the ISO/IEC 14882-1998 C++ standard.
Otherwise, disable this setting to generate smaller and faster code. This setting is
equivalent to specifying the -cpp_exceptions command-line option.
Enable RTTI
Allows the use of the C++ run-time type information (RTTI) capabilities, including the
dynamic_cast and typeid operators. This setting is equivalent to specifying the -RTTI
command-line option.
Enable C++ `bool' type, `true' and
`false' Constants
Instructs the C++ compiler to recognize the bool type and its true and false values
specified in the ISO/IEC 14882-1998 C++ standard. This setting is equivalent to
specifying the -bool command-line option.
Enable wchar_t Support
Instructs the C++ compiler to recognize the wchar_t data type specified in the ISO/IEC
14882-1998 C++ standard. This setting is equivalent to specifying the -wchar_t
command-line option.
EC++ Compatibility Mode
Verifies C++ source code files for Embedded C++ source code. This setting is
equivalent to specifying the -dialect ec++ command-line option.
ANSI Strict
Recognizes source code that conforms to the ISO/IEC 9899-1990 standard for C. This
setting is equivalent to specifying the -ansi strict command-line option.
ANSI Keywords Only
Generates an error message for all non-standard keywords.
NOTE: Enable this setting only if the source code strictly adheres to the ISO standard.
This setting is equivalent to specifying the -stdkeywords command-line option.
Expand Trigraphs
Specifies compiler to recognize trigraph sequences. clear this option to use many
common characters, that look like trigraph sequences, without including escape
characters. This setting is equivalent to specifying the -trigraphs command-line
option.
Legacy for-scoping
Generates an error message when the compiler encounters a variable scope usage
that the ISO/IEC 14882-1998 C++ standard disallows, but is allowed in the C++
language specified in The Annotated C++ Reference Manual ("ARM"). This setting is
equivalent to specifying the -for_scoping command-line option.
Require Prototypes
Specifies compiler to enforce the requirement of function prototypes.
Table continues on the next page...
CodeWarrior Development Studio for Power Architecture Processors Targeting Manual, Rev. 10.5.0,
06/2015
78
Freescale Semiconductor, Inc.
Chapter 3 Build Properties
Table 3-19. CodeWarrior Build Tool Settings - C/C++ Language Options (continued)
Option
Explanation
NOTE: The compiler generates an error message if you define a previously
referenced function that does not have a prototype. The compiler generates a
warning message, if you define the function before it is referenced but do not
give it a prototype.
This setting is equivalent to specifying the -requireprotos command-line option.
Enable C99 Extensions
Specifies compiler to recognize ISO/IEC 9899-1999 ("C99") language features. This
setting is equivalent to specifying the -dialect c99 command-line option.
Enable GCC Extensions
Specifies compiler to recognize language features of the GNU Compiler Collection
(GCC) C compiler that are supported by CodeWarrior compilers. This setting is
equivalent to specifying the -gcc_extensions command-line option.
Enum Always Int
Specifies compiler to use signed integers to represent enumerated constants. This
setting is equivalent to specifying the -enum command-line option.
Use Unsigned Chars
Specifies compiler to treat char declarations as unsigned char declarations. This setting
is equivalent to specifying the -char unsigned command-line option.
Pool Strings
Specifies compiler to collect all string constants into a single data section in the object
code, it generates. This setting is equivalent to specifying the -strings pool
command-line option.
Reuse
Specifies compiler to store only one copy of identical string literals. This setting is
equivalent to specifying the -string reuse command-line option.
IPA
Specifies the Interprocedural Analysis (IPA) policy. The default values are:
• Off - No interprocedural analysis, but still performs function-level optimization.
Equivalent to the "no deferred inlining" compilation policy of older compilers.
• File - Completely parse each translation unit before generating any code or data.
Equivalent to the "deferred inlining" option of older compilers. Also performs an
early dead code and dead data analysis in this mode. Objects with unreferenced
internal linkages will be dead-stripped in the compiler rather than in the linker.
This setting is equivalent to specifying the -ipa command-line option.
Other flags
Specify compiler flags.
3.3.1.6 PowerPC Assembler
Use the PowerPC Assembler panel to determine the format used for the assembly source
files and the code generated by the PowerPC assembler.
The table below lists and describes the various options available on the PowerPC
Assembler panel.
Table 3-20. CodeWarrior Build Tool Settings - PowerPC Assembler Options
Option
Explanation
Command
Shows the location of the assembler executable file.
All Options
Shows the actual command line the assembler will be called with.
Table continues on the next page...
CodeWarrior Development Studio for Power Architecture Processors Targeting Manual, Rev. 10.5.0,
06/2015
Freescale Semiconductor, Inc.
79
Build Properties for Power Architecture
Table 3-20. CodeWarrior Build Tool Settings - PowerPC Assembler Options (continued)
Option
Explanation
Expert settings:
Shows the expert settings command line parameters.
Command line pattern
3.3.1.6.1
Input
Use the Input panel to specify the path and search order of the #include files.
The table below lists and describes the various options available on the Input panel.
Table 3-21. CodeWarrior Build Tool Settings - Input Options
Option
Explanation
Always Search user Paths
Performs a search of both the user and system paths, treating #include statements
of the form #include <xyz>, the same as the form #include "xyz". This setting
is equivalent to specifying the -nosyspath command-line option.
User Path (-i)
Use this panel to specify multiple user paths and the order in which to search those
paths. The table that follows lists and describes the toolbar buttons that help work with
the file search paths. This setting is equivalent to specifying the -i command-line
option.
User Recursive Path (-ir)
Appends a recursive access path to the current User Path list. The table that follows
lists and describes the toolbar buttons that help work with the file search paths. This
setting is equivalent to specifying the -ir path command-line option.
System Path (-I- -I)
Changes the build target's search order of access paths to start with the system paths
list. The table that follows lists and describes the toolbar buttons that help work with the
file search paths. This setting is equivalent to specifying the -I- -I path commandline option.
System Recursive Path (-I- -ir)
Appends a recursive access path to the current System Path list. The table that follows
lists and describes the toolbar buttons that help work with the file search paths. This
setting is equivalent to specifying the -I- -ir command-line option.
The table below lists and describes the toolbar buttons that help work with the Input
panel.
Table 3-22. CodeWarrior Build Tool Settings - Input Toolbar Buttons
Button
Tooltip
Description
Add
Click to open the Add file path or the Add directory path dialog box and
create a file or directory path.
Delete
Click to delete the selected file or directory. To confirm deletion, click Yes
in the Confirm Delete dialog box.
Edit
Click to open the Edit file path or Edit directory path dialog box and
update the selected file or directory.
Move up
Click to move the selected file search path one position higher in the list.
Table continues on the next page...
CodeWarrior Development Studio for Power Architecture Processors Targeting Manual, Rev. 10.5.0,
06/2015
80
Freescale Semiconductor, Inc.
Chapter 3 Build Properties
Table 3-22. CodeWarrior Build Tool Settings - Input Toolbar Buttons (continued)
Button
Tooltip
Move down
3.3.1.6.2
Description
Click to move the selected file search path one position lower in the list.
General
Use the General panel to specify the PowerPC assembler options that are specific to
Power Architecture software development.
The table below lists and describes the various options available on the General panel.
Table 3-23. CodeWarrior Build Tool Settings - General Options
Option
Explanation
Labels Must End With ':'
Specifies whether labels must end with a colon (:). Clear this option to omit the ending
colon from label names that start in the first column. This setting is equivalent to
specifying the .option colon off | on | reset assembler control option.
Directives Begin With '.'
Controls period usage for directives. Check this option to ensure that each directive
must start with a period. This setting is equivalent to specifying the .option period
off | on | reset assembler control option.
Case Sensitive Identifier
Specifies case sensitivity for identifiers. This setting is equivalent to specifying
the .option case off | on | reset assembler control option.
Allow Space In Operand Field
Controls spaces in operand fields. Clear this option, if a space in an operand field starts
with a comment. This setting is equivalent to specifying the .option space off |
on | reset assembler control option.
GNU Compatible Syntax
CodeWarrior Assembler supports several GNU-format assembly language extensions.
Check this option to control GNU's assembler format conflicts with that of the
CodeWarrior assembler.
Generate Listing File
Controls generation of a listing file that includes files source, line numbers, relocation
information, and macro expansions. Clear this option, if no listing file is specified.
Other Flags
Specify assembler flags.
3.3.1.7 PowerPC Disassembler
Use the PowerPC Disassembler panel to specify the command, options, and expert
settings related to the PowerPC disassembler.
CodeWarrior Development Studio for Power Architecture Processors Targeting Manual, Rev. 10.5.0,
06/2015
Freescale Semiconductor, Inc.
81
Build Properties for Power Architecture
The table below lists and describes the various options available on the PowerPC
Disassembler panel.
Table 3-24. CodeWarrior Build Tool Settings - PowerPC Disassembler
Options
Option
Explanation
Command
Shows the location of the disassembler executable file.
All options
Shows the actual command line the disassembler will be called with.
Expert settings:
Shows the expert settings command line parameters.
Command line pattern
3.3.1.7.1
Disassembler Settings
Use the Disassembler Settings panel to specify the PowerPC disassembler options that
are specific to Power Architecture software development.
The table below lists and describes the various options available on the Disassembler
panel.
Table 3-25. CodeWarrior Build Tool Settings - Disassembler Options
Option
Explanation
Show Headers
Controls display of object header information This setting is equivalent to
specifying the -show headers | noheaders command-line option.
Show Symbol and String Tables
Controls display of character string and symbol tables. This setting is
equivalent to specifying the -show tables | notables command-line
option.
Show Core Modules
Controls display of executable code sections. This setting is equivalent to
specifying the -show code | nocode command-line option.
Show Extended Mnemonics
Controls display of extended mnemonics. This setting is equivalent to
specifying the -show extended | noextended command-line option.
Show Source Code
Interleaves the code disassembly with C or C++ source code. This setting
is equivalent to specifying the -show source | nosource commandline option.
Only Show Operands and mnemonics
Controls display of address and op-code values. This setting is equivalent
to specifying the -show binary | nobinary command-line option.
Show Data Modules
Controls display of data sections. This setting is equivalent to specifying
the -show data | nodata command-line option.
Disassemble Exception Tables
Controls display of C++ exception tables. This setting is equivalent to
specifying the -show xtab[les] | noxtab[les] or -show
exceptions | noexceptions command-line option.
Show DWARF Info
Controls display of debugging information. This setting is equivalent to
specifying the -show debug | nodebug or -show dwarf | nodwarf
command-line option.
Table continues on the next page...
CodeWarrior Development Studio for Power Architecture Processors Targeting Manual, Rev. 10.5.0,
06/2015
82
Freescale Semiconductor, Inc.
Chapter 3 Build Properties
Table 3-25. CodeWarrior Build Tool Settings - Disassembler Options (continued)
Option
Verbose
Explanation
Controls display of extra information. This setting is
equivalent to specifying the -show detail | nodetail command-line
option.
3.3.1.8 PowerPC Preprocessor
Use the PowerPC Preprocessor panel to specify the command, options, and expert
settings related to the PowerPC preprocessor.
The table below lists and describes the various options available on the PowerPC
Preprocessor panel.
Table 3-26. CodeWarrior Build Tool Settings - PowerPC Preprocessor
Options
Option
Explanation
Command
Shows the location of the preprocessor executable file.
All options
Shows the actual command line the preprocessor will be called with.
Expert settings:
Shows the expert settings command line parameters.
Command line pattern
3.3.1.8.1
Preprocessor Settings
Use the Preprocessor Settings panel to specify the PowerPC preprocessor options that are
specific to Power Architecture software development.
The table below lists and describes the various options available on the Preprocessor
panel.
Table 3-27. CodeWarrior Build Tool Settings - Preprocessor Options
Option
Explanation
Mode
Specifies the tool to preprocess source files. This setting is equivalent to specifying the
-E command-line option.
Emit file change
Controls generation of file and line breaks. This setting is equivalent to specifying the ppopt [no]break command-line option.
Emit #pragmas
Controls generation of #pragma directives. This setting is equivalent to specifying the
-ppopt [no]pragma command-line option.
Table continues on the next page...
CodeWarrior Development Studio for Power Architecture Processors Targeting Manual, Rev. 10.5.0,
06/2015
Freescale Semiconductor, Inc.
83
Build Properties for Power Architecture
Table 3-27. CodeWarrior Build Tool Settings - Preprocessor Options (continued)
Option
Explanation
Show full path
Controls generation of full paths or just the base file name. This setting is equivalent to
specifying the -ppopt [no]full[path] command-line option.
Keep comment
Controls generation of comments. This setting is equivalent to specifying the -ppopt
[no]comment command-line option.
Use #line
Controls generation of #line directives. This setting is equivalent to specifying the ppopt [no]line command-line option.
Keep whitespace
Controls generation of white spaces. This setting is equivalent to specifying the ppopt [no]space command-line option.
3.3.2 GCC Build Tool Settings
GNU compiler collection (GCC) build tools are open source tools that you can use in
your CodeWarrior projects.
In the current installation, every core or target has a separate GCC build tool attached to
it. For example, projects created for e500mc bareboard use powerpc-eabi toolchain; whereas,
projects created for e5500 or e6500(32/64) bareboard use powerpc-aeabi e5500 or powerpc-aeabi
e6500 toolchain.
NOTE
For more information about the GCC build tools, see
documents available in the <CWInstallDir>\Cross_Tools\gcc<version>-<target>\powerpc-<[eabi]/[eabispe]/[aeabi]/[linux/libc]>
\share\docs\pdf
folder.
For this version of CodeWarrior Development Studio for Power Architecture, the default
version of GCC PowerPC toolchain (bareboard and Linux) is GCC v4.9.2 (rev1182).
NOTE
By default, GCC v4.9.x generates DWARF4. To generate an
older DWARF version (DWARF2/DWARF3), use -g with gdwarf-2 or -gdwarf-3.
For older versions of GCC PowerPC toolchain, such as GCC v4.8.2 (rev963), or for
toolchains not available in the current release by default, install the corresponding service
pack by performing these steps:
1. Select Help > Install New Software from the CodeWarrior IDE menu bar.
The Install wizard launches and the Available Software page appears.
CodeWarrior Development Studio for Power Architecture Processors Targeting Manual, Rev. 10.5.0,
06/2015
84
Freescale Semiconductor, Inc.
Chapter 3 Build Properties
2. Select FSL PA Build Tools from the Work with drop-down list.
A list of PA GCC service packs is displayed in the pane below the Work with dropdown list.
3. Select the appropriate service pack, as shown in the figure below.
Figure 3-1. Selecting a service pack
4. Click Next and complete the remaining wizard steps.
The service pack, along with the new toolchain, will be installed on your computer.
CodeWarrior Development Studio for Power Architecture Processors Targeting Manual, Rev. 10.5.0,
06/2015
Freescale Semiconductor, Inc.
85
Build Properties for Power Architecture
NOTE
For more information on service packs, see the Service Pack
Updater Quickstart available in the <CWInstallDir>\PA\ folder.
After installing the service pack, you need to set the new toolchain as the default
toolchain to build your project with the new toolchain. To set the new toolchain as the
default toolchain and to build the project, use these steps:
1. Select Project > Properties from the CodeWarrior IDE menu bar.
The Properties dialog box appears.
2. In the left pane, select C/C++ Build > Settings.
3. In the right pane, select the Build Tool Versions tab.
4. Select the required toolchain version and click Set As Default, as shown in the figure
below.
Figure 3-2. Setting a toolchain as default toolchain
5. Click OK.
6. Select Project > Build Project from the CodeWarrior IDE menu bar.
The project is built using the new toolchain.
CodeWarrior Development Studio for Power Architecture Processors Targeting Manual, Rev. 10.5.0,
06/2015
86
Freescale Semiconductor, Inc.
Chapter 3 Build Properties
The table below lists the GCC build tool settings specific to developing software for
Power Architecture.
Table 3-28. GCC Build Tool Settings for Power Architecture
Build Tool
Build Properties Panels
Architecture
PowerPC Linker
General
Libraries
Miscellaneous
Shared Library Settings
PowerPC Environment
PowerPC Compiler
Preprocessor
Symbols
Includes
Optimization
Debugging
Warnings
Miscellaneous
PowerPC Assembler
General
PowerPC Preprocessor
Preprocessor Settings
PowerPC Disassembler
Disassembler Settings
The CodeWarrior build tools listed in the above table share some properties panels, such
as Include Search Paths. Properties specified in these panels apply to the selected build
tool on the Tool Settings page of the Properties for <project> window.
3.3.2.1 Architecture
Use the Architecture panel to specify the Power Architecture processor family for the
build.
The properties specified on this page are also used by the build tools (compiler, linker,
and assembler).
The table below lists and describes the options available on the Architecture panel.
Table 3-29. Tool Settings - Architecture Options
Option
Architecture
Explanation
Specifies which architecture variant is used by the target.
Table continues on the next page...
CodeWarrior Development Studio for Power Architecture Processors Targeting Manual, Rev. 10.5.0,
06/2015
Freescale Semiconductor, Inc.
87
Build Properties for Power Architecture
Table 3-29. Tool Settings - Architecture Options (continued)
Option
Explanation
Target Mode
Specifies the target environment (32-bit/64-bit mode) on which your generated code will
run. This option takes the following values:
• 32-bit: Enables 32-bit code generation
• 64-bit: Enables 64-bit code generation
3.3.2.2 PowerPC Linker
Use the PowerPC Linker panel to specify the GCC linker options that are specific to
Power Architecture software development.
NOTE
The list of tools presented on the Tool Settings page can differ,
based upon the toolchain used by the project.
The table below lists and describes the various options available on the PowerPC Linker
panel.
Table 3-30. Tool Settings - PowerPC Linker Options
Option
Description
Command
Specifies the PowerPC GCC command line driver or linker required to build the project.
All options
Shows the actual command line the linker will be called with.
Expert settings:
Shows the expert settings command line parameters.
Command line pattern
3.3.2.2.1
General
Use the General panel to specify the general linker behavior. The following table lists and
describes the various options available on the General panel.
Table 3-31. Tool Settings - General Options
Option
Do not use standard start files (-nostartfiles)
Description
Specifies linker to not to use the standard system startup files when
linking. The standard system libraries are used normally, unless nostdlib or -nodefaultlibs command-line options are used. This
setting is equivalent to specifying the -nostartfiles command-line
option.
Table continues on the next page...
CodeWarrior Development Studio for Power Architecture Processors Targeting Manual, Rev. 10.5.0,
06/2015
88
Freescale Semiconductor, Inc.
Chapter 3 Build Properties
Table 3-31. Tool Settings - General Options (continued)
Option
Description
Do not use default libraries (-nodefaultlibraries)
Specifies linker to not to use the standard system libraries when linking.
Only the libraries you specify will be passed to the linker. Options
specifying linkage of the system libraries, such as -static-libgcc or shared-libgcc, will be ignored. This setting is equivalent to specifying
the -nodefaultlibraries command-line option.
No startup or default libs (-nostdlib)
Specifies linker to not to use the standard system startup files or libraries
when linking. This setting is equivalent to specifying the -nostdlib
command-line option.
Omit all symbol information (-s)
Specifies linker to remove all symbol table and relocation information from
the executable. This setting is equivalent to specifying the -s commandline option.
No shared libraries (-static)
Specifies linker to prevent linking with the shared libraries. This setting is
equivalent to specifying the -static command-line option.
3.3.2.2.2
Libraries
Use the Libraries panel to specify the libraries and their search paths if the libraries are
available in non-standard location. You can specify multiple additional libraries and
library search paths. The following table lists and describes the various options available
on the Libraries panel.
Table 3-32. Tool Settings - Libraries Options
Option
Explanation
Libraries
Lists the libraries that are to be passed to the linker while building the project. The
Linker uses the libraries in the same order as shown in this list. The table that follows
lists and describes the toolbar buttons that help work with the library file.
Library search path
Use this panel to specify multiple paths that the Power Architecture linker searches for
libraries. The linker searches the paths in the order shown in this list. The table that
follows lists and describes the toolbar buttons that help work with the library search
paths.
The table below lists and describes the toolbar buttons that help work with the libraries.
Table 3-33. Tool Settings - Libraries Toolbar Buttons
Button
Tooltip
Description
Add
Click to open the Add file path or the Add directory path dialog box and
add a file or directory path.
Delete
Click to delete the selected file or directory. To confirm deletion, click
Yesin the Confirm Delete dialog box.
Edit
Click to open the Edit file name or Edit directory path dialog box and
update the selected file or directory.
Table continues on the next page...
CodeWarrior Development Studio for Power Architecture Processors Targeting Manual, Rev. 10.5.0,
06/2015
Freescale Semiconductor, Inc.
89
Build Properties for Power Architecture
Table 3-33. Tool Settings - Libraries Toolbar Buttons (continued)
Button
3.3.2.2.3
Tooltip
Description
Move up
Click to re-order the selected file or search path one position higher in the
list.
Move down
Click to re-order the selected file or search path one position lower in the
list.
Miscellaneous
Use the Miscellaneous panel to specify linker behavior. The following table lists and
describes the various options available on the Miscellaneous panel.
Table 3-34. Tool Settings - MiscellaneousOptions
Option
Explanation
Linker flags
Specify flags to be passed to the linker.
Other options
Enter additional linker command-line options. The IDE passes these options to the
linker shell during the link phase.
NOTE: The IDE passes command-line options to the shell exactly as you enter them
in this text box.
Other objects
3.3.2.2.4
Add other objects or libraries that needs to be passed tothe linker. These objects or
libraries will be linked at the end.
Shared Library Settings
Use the Shared Library Settings panel to specify the path to the shared libraries. You
can specify multiple additional shared libraries and library search paths.
NOTE
The options provided on the Shared Library Settings panel
are only applicable to Linux projects.
The table below lists and defines the various options available on the Shared Libraries
Settings panel.
Table 3-35. Tool Settings - Shared Libraries Settings Options
Option
Shared (-shared)
Explanation
Controls generation of a shared object which can be linked with other
objects to form an executable.
This setting is equivalent to specifying the -shared command-line option.
Table continues on the next page...
CodeWarrior Development Studio for Power Architecture Processors Targeting Manual, Rev. 10.5.0,
06/2015
90
Freescale Semiconductor, Inc.
Chapter 3 Build Properties
Table 3-35. Tool Settings - Shared Libraries Settings Options (continued)
Option
Explanation
Shared object name (-WI, -soname=)
Specifies the internal DT_SONAME field to the specified name, when
creating a shared object.
When an executable is linked with a shared object which has a
DT_SONAME field and the executable is run, the dynamic linker will attempt
to load the shared object specified by the DT_SONAME field, rather than the
using the file name given to the linker.
Import Library name (-WI,--out-implib=)
Creates a file containing an import library corresponding to the shared
object generated by the linker.
DEF file name (-WI, --output-def=)
Creates a file containing a DEF file corresponding to the shared object
generated by the linker.
3.3.2.2.5
PowerPC Environment
Use the PowerPC Environment panel to specify the configuration files used by the
linker. The following table lists and describes the various options available on the
PowerPC Environment panel.
Table 3-36. Tool Settings - PowerPC Environment Options
Option
Explanation
Map File (-Xlinker -Map)
Prints a link map to the map specified map file. The specified file name must have
a .map extension.
LCF File
Specifies the path of the linker-command file that the linker reads to determine how to
build the output file. Alternatively, click Browse, then use the resulting dialog box to
specify the linker command file.
NOTE: The specified linker script replaces the default linker script, so it must specify
everything necessary to describe the output file.
This setting is equivalent to specifying the -lcf filename command-line option.
3.3.2.3 PowerPC Compiler
Use the PowerPC Compiler panel to specify the compiler options that are specific to
Power Architecture software development.
NOTE
The list of tools presented on the Tool Settings page can differ,
based upon the toolchain used by the project.
CodeWarrior Development Studio for Power Architecture Processors Targeting Manual, Rev. 10.5.0,
06/2015
Freescale Semiconductor, Inc.
91
Build Properties for Power Architecture
The table below lists and describes the various options available on the PowerPC
Compiler panel.
Table 3-37. Tool Settings - PowerPC Compiler Options
Option
Description
Command
Specifies the PowerPC GCC command line driver or compiler required to build the
source files in the project.
All options
Specifies the actual command line the compiler will be called with.
Expert settings:
Specifies the expert settings command line parameters.
Command line pattern
3.3.2.3.1
Preprocessor
Use the Preprocessor panel to specify preprocessor behavior. You can specify whether to
search system directories or preprocess only based on the options available in this panel.
The table below lists and describes the various options available on the Preprocessor
panel.
Table 3-38. Tool Settings - Preprocessor Options
Options
Explanation
Do not search system directories (--nostdinc)
Specifies compiler to not to search the standard system directories for
header files. Only the directories specified by the user with -I option (and
the directory of the current file, if appropriate) are searched. This setting is
equivalent to specifying the -nostdinc command-line option.
Preprocess only (-E)
Specifies command-line tool to preprocess the source files and not to run
the compiler. This setting is equivalent to specifying the -E command-line
option.
3.3.2.3.2
Symbols
Use the Symbols panel to control how the compiler structures generated object code.
The table below lists and describes the various options available on the Symbols options.
Table 3-39. Tool Settings - Symbols Options
Option
Defined symbols (-D)
Explanation
Specifies substitution strings that the assembler applies to all the assembly-language
modules in the build target.
Table continues on the next page...
CodeWarrior Development Studio for Power Architecture Processors Targeting Manual, Rev. 10.5.0,
06/2015
92
Freescale Semiconductor, Inc.
Chapter 3 Build Properties
Table 3-39. Tool Settings - Symbols Options (continued)
Option
Explanation
NOTE: Enter just the string portion of a substitution string. The IDE prepends the -d
token to each string that you enter. For example, entering opt1 x produces
this result on the command line: -dopt1 x
NOTE: This option is similar to the DEFINE directive, but applies to all assemblylanguage modules in a build target.
Use these toolbar buttons to work with the panel:
• Add - Click to specify the undefined symbols string.
• Delete - Click to remove the selected string.
• Edit - Click to edit an existing string.
• Move up - Click to move the selected string one position higher in the list.
• Move down - Click to move the selected string one position lower in the list.
Undefined symbols (-U)
3.3.2.3.3
Undefines the substitution strings you specify in this panel. Use these toolbar buttons to
work with the panel:
• Add - Click to specify the undefined symbols string.
• Delete - Click to remove the selected string.
• Edit - Click to edit an existing string.
• Move up - Click to move the selected string one position higher in the list.
• Move down - Click to move the selected string one position lower in the list.
Includes
Use this panel to specify paths to search for #include files.
NOTE
The IDE displays an error message, if a header file is in a
different directory from the referencing source file. In some
instances, the IDE also displays an error message, if a header
file is in the same directory as the referencing source file. For
example, if you see the message Could not open source file
myfile.h, you must add the path for myfile.h to this panel.
The table below lists and describes the various options available on the Includes panel.
Table 3-40. Tool Settings - Includes Options
Option
Include paths (-I)
Explanation
Adds the directory to the list of directories to be searched for header files. Directories
named by -I are searched before the standard system include directories. If the
directory is a standard system include directory, the option is ignored to ensure that the
default search order for system directories and the special treatment of system headers
are not defeated . If the directory name begins with =, then the = will be replaced by the
sysroot prefix. Use these toolbar buttons to work with the Include paths (-I) panel:
• Add - Click to open the Add directory path dialog box and specify the directory
search path.
• Delete - Click to delete the selected directory search path. To confirm deletion,
click Yes in the Confirm Delete dialog box.
Table continues on the next page...
CodeWarrior Development Studio for Power Architecture Processors Targeting Manual, Rev. 10.5.0,
06/2015
Freescale Semiconductor, Inc.
93
Build Properties for Power Architecture
Table 3-40. Tool Settings - Includes Options (continued)
Option
Explanation
• Edit - Click to open the Edit directory path dialog box and update the selected
directory search path.
• Move up - Click to re-order the selected directory search path one position
higher in the list.
• Move down - Click to re-order the selected directory search path one position
lower in the list.
Include files (-include)
3.3.2.3.4
Process file as if #include "file" appeared as the first line of the primary source
file. However, the first directory searched for file is the preprocessor's working directory
instead of the directory containing the main source file. If not found, the preprocessor's
working directory is searched for in the remainder of the #include "..." search
chain as normal. If multiple -include options are specified, the files are included in
the order they appear on the command line. Use these toolbar buttons to work with the
Include files (-include) panel:
• Add - Click to open the Add file path dialog box and specify the file.
• Delete - Click to delete the selected file. To confirm deletion, click Yes in the
Confirm Delete dialog box.
• Edit - Click to open the Edit directory path dialog box and update the selected
file.
• Move up - Click to re-order the selected file one position higher in the list.
• Move down - Click to re-order the selected file one position lower in the list.
Optimization
Use the Optimization panel to control compiler optimizations. Compiler optimization
can be applied in either global or non-global optimization mode. You can apply global
optimization at the end of the development cycle, after compiling and optimizing all
source files individually or in groups.
The table below lists and describes the various options available on the Optimization
panel.
Table 3-41. Tool Settings - Optimization Options
Option
Optimization Level
Explanation
Specifies the optimization that you want the compiler to apply to the generated object
code. The default options are:
• None(-O0) - Disable optimizations. Reduce compilation time and make
debugging produce the expected results. This is the default.This setting is
equivalent to specifying the -O0 command-line option.
• Optimize (-O1) - Optimizing compilation takes more time, and a lot more memory
for a large function. With -O/-O1, the compiler tries to reduce code size and
execution time, without performing any optimizations that take a great deal of
compilation time. This setting is equivalent to specifying the -O1 command-line
option.
• Optimize more(-O2) - Optimize even more. GCC performs nearly all supported
optimizations that do not involve a space-speed tradeoff. As compared to -O/O1,
this option increases both compilation time and the performance of the generated
code. This setting is equivalent to specifying the -O2 command-line option.
Table continues on the next page...
CodeWarrior Development Studio for Power Architecture Processors Targeting Manual, Rev. 10.5.0,
06/2015
94
Freescale Semiconductor, Inc.
Chapter 3 Build Properties
Table 3-41. Tool Settings - Optimization Options (continued)
Option
Explanation
• Optimize most(-O3) - Turns on all optimizations specified by -O2 and also turns
on the -finline-functions, -funswitch-loops, -fpredictivecommoning, -fgcse-after-reload and -ftree-vectorize options. At this
optimization level, the compiler generates code that is usually faster than the
code generated from level 2 optimizations.This setting is equivalent to specifying
the -O3 command-line option.
• Optimize for size(-Os) - Optimize for size. -Os enables all -O2 optimizations
that do not typically increase code size. It also performs further optimizations
designed to reduce code size.This setting is equivalent to specifying the -Os
command-line option.
Other optimization flags
3.3.2.3.5
Specifies individual optimization flag that can be turned ON/OFF based on the user
requirements.
Debugging
Use the Debugging panel to set the debugging information. The following table lists and
describes the various options available on the Debugging panel.
Table 3-42. Tool Settings - Debugging Options
Option
Explanation
Debug Level
Specify the debug levels for the compiler. the default options are:
• None - No Debug level.
• Minimal (-g1) - Produces minimal information, enough for making backtraces in
parts of the program that you don't plan to debug. This includes descriptions of
functions and external variables, but no information about local variables and no
line numbers.
• Default (-g2) same as (-g) - The compiler generates DWARF 2.0 conforming
debugging information.
• Maximum (-g3) - The compiler provides maximum debugging support. Also
includes extra information, such as all the macro definitions present in the
program.
Other debugging flags
Specify the other debugging flags that need to be passed with the compiler
Generate prof information (-p)
Generate extra code to write profile information suitable for the analysis program prof.
You must use this option while compiling and linking the source files.
Generate gprof information (-pg)
Generate extra code to write profile information suitable for the analysis program
gprof. You must use this option while compiling and linking the source files.
3.3.2.3.6
Warnings
CodeWarrior Development Studio for Power Architecture Processors Targeting Manual, Rev. 10.5.0,
06/2015
Freescale Semiconductor, Inc.
95
Build Properties for Power Architecture
Use the Warnings panel to control how the compiler reports the error and warning
messages. The following table lists and describes the various options available on the
Warnings panel.
Table 3-43. Tool settings - Warnings Options
Option
Explanation
Check syntax only (-fsyntax-only)
Check the code for syntax errors, but do not do anything beyond that.
Pedantic (-pedantic)
Select to issue all the mandatory diagnostics listed in the C standard.
Some of them are left out by default, since they trigger frequently on
harmless code.
Pedantic warnings as errors (-pedantic-errors)
Select to issue all the mandatory diagnostics, and make all mandatory
diagnostics into errors. This includes mandatory diagnostics that GCC
issues without -pedantic but treats as warnings.
Inhibit all warnings (-w)
Select to suppress all warnings, including those which GNU CPP issues
by default.
All warnings (-Wall)
Select to turn on all optional warnings which are desirable for normal code.
At present this is -Wcomment, -Wtrigraphs, -Wmultichar and a
warning about integer promotion causing a change of sign in #if
expressions.
NOTE: Many of the preprocessor's warnings are on by default and have
no options to control them.
Warnings as errors (-Werror)
3.3.2.3.7
Select to make all warnings into hard errors. Source code which triggers
warnings will be rejected.
Miscellaneous
Use the Miscellaneous panel to specify compiler options. The following table lists and
describes the various options available on the Miscellaneous panel.
Table 3-44. Tool Settings - Miscellaneous Options
Option
Explanation
Other flags
Specify the compiler flags.
Verbose (-v)
Select to print on console the commands executed to run the stages of
compilation. Also print the version number of the compiler driver program,
the preprocessor and the compiler proper.
Support ANSI programs (-ansi)
Compiler strictly conforms to ANSI standard. In C mode, this is equivalent
to -std=c89. In C++ mode, it is equivalent to -std=c++98.
Position Independent Code (-fPIC)
If supported for the target machine, emits position-independent code,
which is suitable for dynamic linking and avoids any limit on the size of the
global offset table.
Other Assembler options (-Xassembler [option])
Allows you to make GCC pass an option to the assembler. It is generally
used to supply system-specific assembler options that are not recognized
by GCC. To supply an option that takes an argument, use -Xassembler
twice, first for the option and then for the argument.
CodeWarrior Development Studio for Power Architecture Processors Targeting Manual, Rev. 10.5.0,
06/2015
96
Freescale Semiconductor, Inc.
Chapter 3 Build Properties
3.3.2.4 PowerPC Assembler
Use PowerPC Assembler panel to specify the command, options, and expert settings for
the build tool assembler.
The table below lists and describes the various options available on the PowerPC
Assembler panel.
NOTE
The list of tools presented on the Tool Settings page can differ,
based upon the toolchain used by the project.
Table 3-45. Tool Settings - PowerPC Assembler Options
Option
Description
Command
Specifies the PowerPC GCC command line Assembler required to build the assembly
files in the project.
All options
Shows the actual command line the assembler will be called with.
Expert settings:
Shows the expert settings command line parameters.
Command line pattern
3.3.2.4.1
General
Use the General panel to specify the assembler behavior. The following table lists and
describes the various options available on the General panel.
Table 3-46. Tool Settings - General
Option
Explanation
Assembler flags
Specify the flags that need to be passed with the assembler.
Include paths (-I)
Add a path to the list of directories, assembler searches for files specified in .include
directives. -I can be used multiple times as required to include a variety of paths. The
current working directory is always searched first; followed by any -I directories, in the
order they were specified (left to right) on the command line. Use these toolbar buttons
to work with the Include paths (-I) panel:
• Add - Click to open the Add directory path dialog box and specify the file
search path.
• Delete - Click to delete the selected file search path. To confirm deletion, click
Yes in the Confirm Delete dialog box.
• Edit - Click to open the Edit directory path dialog box and update the selected
object file search path.
Table continues on the next page...
CodeWarrior Development Studio for Power Architecture Processors Targeting Manual, Rev. 10.5.0,
06/2015
Freescale Semiconductor, Inc.
97
Build Properties for Power Architecture
Table 3-46. Tool Settings - General (continued)
Option
Explanation
• Move up - Click to re-order the selected file search path one position higher in
the list.
• Move down - Click to re-order the selected file search path one position lower in
the list.
Supress warnings (-W)
Supresses warning messages.
Announce version (-v)
Prints the assembler version.
3.3.2.5 PowerPC Preprocessor
Use the PowerPC Preprocessor panel to specify specify the command, options, and
expert settings for the preprocessor.
The table below lists and describes the various options available on the PowerPC
Preprocessor panel.
NOTE
The list of tools presented on the Tool Settings page can differ,
based upon the toolchain used by the project.
Table 3-47. Tool Settings - PowerPC Preprocessor Options
Option
Explanation
Command
Specifies the PowerPC GCC command line Pre-processor required to pre-process the
source files.
All options
Shows the actual command line the preprocessor will be called with.
Expert settings:
Shows the expert settings command line parameters.
Command line pattern
3.3.2.5.1
Preprocessor Settings
Use the Preprocessor Settings panel to specify preprocessor behavior. The following table
lists and describes the various options available on the Preprocessor Settings panel.
Table 3-48. Tool Settings - Preprocessor Settings Options
Option
Handle Directives Only
Explanation
When preprocessing, handle directives, but do not expand macros. This setting is
equivalent to specifying the -fdirectives-only command-line option.
Table continues on the next page...
CodeWarrior Development Studio for Power Architecture Processors Targeting Manual, Rev. 10.5.0,
06/2015
98
Freescale Semiconductor, Inc.
Chapter 3 Build Properties
Table 3-48. Tool Settings - Preprocessor Settings Options (continued)
Option
Explanation
Print Header File Names
Select to print the name of each header file used. This setting is equivalent to
specifying the -H command-line option.
3.3.2.6 PowerPC Disassembler
Use the PowerPC Disassembler panel to specify the command, options, and expert
settings for the Power ELF disassembler.
The table below lists and describes the various options available on the PowerPC
Disassembler panel.
Table 3-49. Tool Settings - PowerPC Disassembler Options
Option
Explanation
Command
Specifies the PowerPC GCC command line disassembler required to disassemble the
generated object code.
All options
Shows the actual command line the disassembler will be called with.
Expert settings:
Shows the expert settings command line parameters.
Command line pattern
3.3.2.6.1
Disassembler Settings
Use the Disassembler Settings panel to specify or modify the existing settings for the
disassembler. The following table lists and describes the various options available on the
Disassembler Settings panel.
Table 3-50. Tool Settings - Disassembler Settings Options
Option
Explanation
Disassemble All Section Content (including debug
information)
Disassembles the content of all sections, not just those
expected to contain instructions.
Disassemble Executable Section Content
Disassembles all executable content and send output to a file.
Intermix Source Code With Disassembly
Intermixes source code with disassembly.
Display All Header Content
Displays the contents of all headers.
Display Archive Header Information
Displays archive header information.
Display Overall File Header Content
Displays the contents of the overall file header.
Display Object Format Specific File Header Contents
Displays the file header contents and object format
Table continues on the next page...
CodeWarrior Development Studio for Power Architecture Processors Targeting Manual, Rev. 10.5.0,
06/2015
Freescale Semiconductor, Inc.
99
Build Properties for Power Architecture
Table 3-50. Tool Settings - Disassembler Settings Options (continued)
Option
Explanation
Display Section Header Content
Displays the section header of the file.
Display Full Section Content
Displays the full section of the file.
Display Debug Information
Displays debug information in the object file.
Display Debug Information Using ctag Style
Displays debug information using the ctags style.
Display STABS Information
Displays any STABS information in the file, in raw form.
Display DWARF Information
Displays any DWARF information in the file.
Display Symbol Table Content
Displays the contents of the symbol tables.
Display Dynamic Symbol Table Content
Displays the contents of the dynamic symbol table.
Display Relocation Entries
Displays the relocation entries in the file.
Display Dynamic Relocation Entries
Displays the dynamic relocation entries in the file.
CodeWarrior Development Studio for Power Architecture Processors Targeting Manual, Rev. 10.5.0,
06/2015
100
Freescale Semiconductor, Inc.
Chapter 4
Debug Configurations
A CodeWarrior project can have multiple associated debug configurations.
A debug configuration is a named collection of settings that the CodeWarrior tools use.
Debug configurations let you specify settings, such as:
• The files that belong to the debug configuration
• Behavior of the debugger and the related debugging tools
This chapter explains:
• Using Debug Configurations Dialog Box
• Customizing Debug Configurations
• Reverting Debug Configuration Settings
4.1 Using Debug Configurations Dialog Box
The Debug Configurations dialog box allows you to specify debugger-related settings
for your CodeWarrior project.
NOTE
As you modify a launch configuration's debugger settings, you
create pending, or unsaved, changes to that launch
configuration. To save the pending changes, you must click the
Apply button of the Debug Configurations dialog box, or
click the Close button and then the Yes button.
Table 4-1. Debug Configuration Tabs
Main
Arguments
Table continues on the next page...
CodeWarrior Development Studio for Power Architecture Processors Targeting Manual, Rev. 10.5.0,
06/2015
Freescale Semiconductor, Inc.
101
Using Debug Configurations Dialog Box
Table 4-1. Debug Configuration Tabs (continued)
Debugger
Debug
EPPC Exceptions
Download
PIC
System Call Services
Other Executables
Symbolics
OS Awareness
Trace and Profile
Source
Environment
Common
4.1.1 Main
Use this tab to specify the project and the application you want to run or debug.
You can also specify a remote system configuration on this tab.
The remote system configuration is separated into connection and system configurations
allowing you to define a single system configuration that can be referred to by multiple
connection configurations. The launch configurations refer to a connection configuration,
which in turn refers to a system configuration.
NOTE
The options displayed on the Main tab vary depending on the
selected debug session type.
The following figure shows the Main tab.
CodeWarrior Development Studio for Power Architecture Processors Targeting Manual, Rev. 10.5.0,
06/2015
102
Freescale Semiconductor, Inc.
Chapter 4 Debug Configurations
Figure 4-1. Debug Configurations-Main Tab
The table below lists the various options available on the Main tab page.
Table 4-2. Main Tab Options
Option
Debug session type
Description
Specifies the options to initiate a debug session using pre-configured debug
configurations. The options include:
• Download - Resets the target if the debug configuration specifies the action.
Further, the command stops the target, (optionally) runs an initialization script,
downloads the specified ELF file, and modifies the program counter(PC).
Table continues on the next page...
CodeWarrior Development Studio for Power Architecture Processors Targeting Manual, Rev. 10.5.0,
06/2015
Freescale Semiconductor, Inc.
103
Using Debug Configurations Dialog Box
Table 4-2. Main Tab Options (continued)
Option
Description
• Attach - Assumes that code is already running on the board and therefore does
not run a target initialization file. The state of the running program is undisturbed.
The debugger loads symbolic debugging information for the current build target's
executable. The result is that you have the same source-level debugging facilities
you have in a normal debug session (the ability to view source code and
variables, and so on). The function does not reset the target, even if the launch
configuration specifies this action. Further, the command loads symbolics, does
not stop the target, run an initialization script, download an ELF file, or modify the
program counter (PC).
NOTE:
The debugger does not support restarting debugging
sessions that you start by attaching the debugger to a
process.
• Connect - Runs the target initialization file specified in the RSE configuration to
set up the board before connecting to it. The Connect debug session type does
not load any symbolic debugging information for the current build target's
executable thereby, denying access to source-level debugging and variable
display. The Connect command resets the target if the launch configuration
specifies this action. Further, the command stops the target, (optionally) runs an
initialization script, does not load symbolics, download an ELF file, or modify the
program counter(PC).
NOTE:
The default debugger configuration causes the debugger to
cache symbolics between sessions. However, selecting the
Connect option invalidates this cache. If you must preserve
the contents of the symbolics cache, and you plan to use the
Connect option, clear the Cache Symbolics Between
Sessions checkbox in the Symbolics tab page.
• Custom - Provides user an advantage to create a custom debug configuration.
C/C++ application
Specifies the settings for the C/C++ application. The options include:
• Project - Specifies the name of the project associated with the selected debug
launch configuration. Click Browse to select a different project.
• Application - Specifies the name of the C or C++ application executable.
NOTE:
This option is disabled when Connect debug session type is
selected.
• Search Project - Click to open the Program Selection dialog box and select a
binary.
NOTE:
This option is disabled when Connect debug session type is
selected.
• Variables - Click to open the Select build variable dialog box and select the build
variables to be associated with the program.
The dialog box displays an aggregation of multiple variable databases and not all
these variables are suitable to be used from a build environment. Given below
are the variables that should be used:
ProjDirPath - returns the absolute path of the current project location in the file
system
${ProjDirPath}/Source/main.c"
workspace_loc - returns the absolute path of a workspace resource in the file
system, or the location of the workspace if no argument is specified
${workspace_loc:/ProjectName/Source main.c"${workspace_loc}
Table continues on the next page...
CodeWarrior Development Studio for Power Architecture Processors Targeting Manual, Rev. 10.5.0,
06/2015
104
Freescale Semiconductor, Inc.
Chapter 4 Debug Configurations
Table 4-2. Main Tab Options (continued)
Option
Description
Gnu_Make_Install_Dir - returns the absolute path of the GNU make.exe
tool
${Gnu_Make_Install_Dir}\make.exe
NOTE:
Build (if required) before launching
This option is disabled when Connect debug session type is
selected.
Controls how auto build is configured for the launch configuration. Changing this setting
overrides the global workspace setting and can provide some speed improvements.
NOTE: These options are set to default and collapsed when Connect debug session
type is selected.
The options include:
• Build configuration - Specifies the build configuration either explicitly or use the
current active configuration.
• Select configuration using `C/C++ Application' - Select/clear to enable/disable
automatic selection of the configuration to be built, based on the path to the
program.
• Enable auto build - Enables auto build for the debug configuration which can
slow down launch performance.
• Disable auto build - Disables auto build for the debug configuration which may
improve launch performance. No build action will be performed before starting
the debug session. You have to rebuild the project manually.
• Use workspace settings (default) - Uses the global auto build settings.
• Configure Workspace Settings - Opens the Launching preference panel where
you can change the workspace settings. It will affect all projects that do not have
project specific settings.
Target settings
Specifies the connection and other settings for the target. The options include:
• Connection - Specifies the applicable Remote System configuration.
• Edit - Click to edit the selected Remote System configuration.
• New - Click to create a new Remote System configuration for the selected project
and application.
• Execute reset sequence - Select to apply reset settings, specified in the target
configuration, when attaching to a target. Alternatively, clear the option to ignore
reset settings.
NOTE:
This option is not available when Attach debug session type
is selected.
• Execute initialization script(s) - Select to execute the initialization script(s),
specified in the target configuration, when attaching to a target. Alternatively,
clear the option to ignore the initialization script(s).
• Target (multicore only) - Select the core to be debugged. For SMP debugging,
select all cores in the SMP group.
4.1.2 Arguments
Use this tab to specify the program arguments that an application uses and the working
directory for a run or debug configuration.
CodeWarrior Development Studio for Power Architecture Processors Targeting Manual, Rev. 10.5.0,
06/2015
Freescale Semiconductor, Inc.
105
Using Debug Configurations Dialog Box
Figure 4-2. Debug Configurations-Arguments Tab
The table below lists the various options available on the Arguments tab page.
Table 4-3. Arguments Tab options
Option
Description
Program arguments
Specifies the arguments passed on the command line.
Variables
Click to select variables by name to include in the program arguments list.
Working Directory
Specifies the run/debug configuration working directory.
Use default
Select to specify the default run/debug configuration working directory, which is a
directory within the current project directory, or clear to specify a different workspace, a
file system location, or a variable. For Linux applications, the default working directory
is the current directory on the process that started CodeWarrior TRK on the target. This
should not be confused with the directory where the CodeWarrior TRK binary resides.
Workspace
Click to specify the path of, or browse to, a workspace relative working directory.
File System
Click to specify the path of, or browse to, a file system directory.
Variables
Click to specify variables by name to include in the working directory.
CodeWarrior Development Studio for Power Architecture Processors Targeting Manual, Rev. 10.5.0,
06/2015
106
Freescale Semiconductor, Inc.
Chapter 4 Debug Configurations
4.1.3 Debugger
Use this tab to configure debugger settings.
The Debugger tab presents different pages for specifying different settings.
NOTE
The content in the Debugger Options panel changes,
depending on the Debug session type selected on the Main tab
page.
Figure 4-3. Debug Configurations-Debugger Tab
The table below lists the various options available on the Arguments tab page.
Table 4-4. Debugger tab options
Option
Debugger Options
Description
Displays configuration options specific to the selected debugger type. See the following
sections for more details:
• Debug
• EPPC Exceptions
CodeWarrior Development Studio for Power Architecture Processors Targeting Manual, Rev. 10.5.0,
06/2015
Freescale Semiconductor, Inc.
107
Using Debug Configurations Dialog Box
Table 4-4. Debugger tab options
Option
Description
•
•
•
•
•
•
Download
PIC
System Call Services
Other Executables
Symbolics
OS Awareness
4.1.3.1 Debug
Use this page to specify the program execution options, Breakpoint and watchpoint
options, and target access behavior.
Figure 4-4. Debugger Options-Debug Page
NOTE
The options displayed on the Debug tab varies depending on
the selected launch configuration.
CodeWarrior Development Studio for Power Architecture Processors Targeting Manual, Rev. 10.5.0,
06/2015
108
Freescale Semiconductor, Inc.
Chapter 4 Debug Configurations
The table below lists the various options available on the Debug page.
Table 4-5. Debugger Options - Debug
Option
Initialize program counter at
Description
Controls the initialization of program counter.
• Program entry point - Select to initialize the program counter at a
specified program entry pont.
• User specified - Select to initialize the program counter at a userspecified function. The default location is main.
NOTE: Disabling this option will also disable the Resume program and
Stop on startup at options.
Resume program
Select to resume the execution after the program counter is initialized.
NOTE: Disabling this option will also disable the Stop on startup at
option.
Stop on startup at
Stops program at specified location. When cleared, the program runs until
you interrupt it manually, or until it hits a breakpoint.
• Program entry point - Select to stop the debugger at a specified
program entry point.
• User specified - Select to stop the debugger at a user-specified
function. The default location is main.
Stop on exit
Check this option to have the debugger set a breakpoint at the code's exit
point. For multicore projects, when you set this option for one project on
one core, it is set for projects on the other cores. Clear this option to
prevent the debugger from setting a breakpoint at the code's exit point.
Install regular breakpoints as
Check this option to install breakpoints as either:
• Regular
• Hardware
• Software
Clear this option to install breakpoints as Regular breakpoints.
Restore watchpoints
Check this option to restore previous watchpoints.
Disable display of variable values by default
Check this option to disable the display of variable values. Clear this
option to enable the display of variable values
Disable display of register values by default
Check this option to disable the display of register values. Clear this option
to enable the display of register values
Refresh while running period (seconds)
Specifies the refresh period used when a view is configured to refresh,
while the application is running. By default, the refresh period is set to two
seconds.
4.1.3.2 EPPC Exceptions
The EPPC Exceptions target settings panel lists each of the EPPC exceptions that the
CodeWarrior debugger can catch.
Use this page to specify which processor exceptions you want the debugger to catch.
CodeWarrior Development Studio for Power Architecture Processors Targeting Manual, Rev. 10.5.0,
06/2015
Freescale Semiconductor, Inc.
109
Using Debug Configurations Dialog Box
Below is an example of the EPPC Exceptions page view.
NOTE
The EPPC Exceptions panel currently provides options to
configure projects created for PowerQUICC III and QorIQ
processors based on the e500v2 core.
NOTE
The features of this page view are currently not supported by
this implementation.
Figure 4-5. Debugger Options-EPPC Exceptions page
Selecting any of the checkboxes, available on the EPPC Exceptions page, configures the
core to automatically halt when the corresponding exception is taken. The debugger stops
at the entry point of the interrupt handler for the selected exception, allowing you to
inspect the processor state and continue debugging from there.
NOTE
Catching the selected exceptions works only if the target is
debugged. To ensure that the CodeWarrior debugger works
properly, the debug exception is set and cannot be selected.
CodeWarrior Development Studio for Power Architecture Processors Targeting Manual, Rev. 10.5.0,
06/2015
110
Freescale Semiconductor, Inc.
Chapter 4 Debug Configurations
The table below lists the various options available on the EPPC Exceptions page.
Table 4-6. EPPC Exceptions Page Options
Option
Exception handling
Description
Select the checkboxes in this panel if you want the debugger to catch the required
exceptions. By default, catching all exceptions is disabled. Only the Debug exception is
caught, as the debugger uses this exception for setting breakpoints. Catching the
debug exception cannot be unset.
4.1.3.3 Download
Use this page to specify which executable code sections the debugger downloads to the
target, and whether the debugger should read back those sections and verify them.
NOTE
Selecting all options in the Program Download Options group
significantly increases download time.
Initial Launch options apply to the first debugging session. Successive Runs options
apply to subsequent debugging sessions.
The Download options control whether the debugger downloads the specified Program
Section Data type to the target hardware. The Verify options control whether the
debugger reads the specified Program Section Data type from the target hardware and
compares the read data against the data written to the device.
CodeWarrior Development Studio for Power Architecture Processors Targeting Manual, Rev. 10.5.0,
06/2015
Freescale Semiconductor, Inc.
111
Using Debug Configurations Dialog Box
Figure 4-6. Debugger Options-Download page
The table below lists the various options available on the Download page.
Table 4-7. Debugger Options - Download
Section Data Type
Explanation
Perform standard download
Controls download of the target application using memory write command.
First
Represents a group of settings that are used when an application is debugged for the
first time.
Subsequent
Represents a group of settings that are used when the application is debugged
subsequent times. To make these settings be used during debugging, you need to
select the Cache Symbolics Between Sessions option on the Symbolics page.
Executable
Controls downloading and verification for executable sections. Check appropriate
checkboxes to specify downloading and verifications, for initial launch and for
successive runs.
Constant Data
Controls downloading and verification for constant-data sections. Check appropriate
checkboxes to specify downloading and verifications, for initial launch and for
successive runs.
Initialized Data
Controls downloading and verification for initialized-data sections. Check appropriate
checkboxes to specify downloading and verifications, for initial launch and for
successive runs.
Uninitialized Data
Controls downloading and verification for uninitialized-data sections. Check appropriate
checkboxes to specify downloading and verifications, for initial launch and for
successive runs.
Table continues on the next page...
CodeWarrior Development Studio for Power Architecture Processors Targeting Manual, Rev. 10.5.0,
06/2015
112
Freescale Semiconductor, Inc.
Chapter 4 Debug Configurations
Table 4-7. Debugger Options - Download (continued)
Section Data Type
Explanation
Execute Tasks
Enables the execution of target tasks.
Name
For target tasks, this is the name of the target task as seen in the Target Task view. For
Debugger Shell scripts, this is the path to the CLDE script.
Task Type
Contains either Debugger Shell scripts or target tasks (such as Flash Programmer).
Add
Adds a download task that can be either a target task or Debugger shell script.
Remove
Removes the selected target task or debugger shell script.
Up
Moves the selected task up the list.
Down
Moves the selected task down the list.
4.1.3.4 PIC
Use this page to specify an alternate address at which the debugger loads the PIC module
onto target memory.
Usually, Position Independent Code (PIC) is linked in such a way that the entire image
starts at address 0x00000000.
Figure 4-7. Debugger Options-PIC page
CodeWarrior Development Studio for Power Architecture Processors Targeting Manual, Rev. 10.5.0,
06/2015
Freescale Semiconductor, Inc.
113
Using Debug Configurations Dialog Box
The table below lists the various options available on the PIC page.
Table 4-8. PIC Page Options
Option
Alternate Load Address
Description
Specify the starting address at which the debugger loads your program. You can also
use this setting when you have an application which is built with ROM addresses and
then relocates itself to RAM (such as U-Boot). Specifying a relocation address lets the
debugger map the symbolic debugging information contained in the original ELF file
(built for ROM addresses) to the relocated application image in RAM. Clear the
checkbox to have the debugger load your program at a default starting address.
NOTE
The debugger does not verify whether your code can execute at
the specified address. As a result, the PIC generation settings of
the compiler, linker and your program's startup routines must
correctly set any base registers and perform any required
relocations.
4.1.3.5 System Call Services
Use this page to activate the debugger's support for system calls and to select options that
define how the debugger handles system calls.
The CodeWarrior debugger provides system call support over JTAG. System call support
lets bareboard applications use the functions of host OS service routines. This feature is
useful if you do not have a board support package (BSP) for your target board.
The host debugger implements these services. Therefore, the host OS service routines are
available only when you are debugging a program on a target board or simulator.
NOTE
The OS service routines provided must comply with an
industry-accepted standard. The definitions of the system
service functions provided are a subset of Single UNIX
Specification (SUS).
CodeWarrior Development Studio for Power Architecture Processors Targeting Manual, Rev. 10.5.0,
06/2015
114
Freescale Semiconductor, Inc.
Chapter 4 Debug Configurations
Figure 4-8. Debugger Options-System Call Services page
The table below lists the various options available on the System Call Services page.
Table 4-9. System Call Services Page Options
Option
Description
Activate Supportfor System Services
Check this option to enable support for system services. All the other
options on the System Call Services panel are enabled only if you check
this checkbox.
stdout/stderr
By default, the output written to stdout and stderr appears in a
CodeWarrior IDE "console" window. To redirect console output to a file,
select the stdout/stderr checkbox. Click Browse to display a dialog box
and specify the path and name of this file.
Use shared console window
Check this option if you wish to share the same console window between
different debug targets. This setting is useful in multi-core or multi-target
debugging.
Trace level
Use this drop-down list to specify the system call trace level. The place
where the debugger displays the traced system service requests is
determined by the Trace checkbox.The system call trace level options
available are:
• No Trace - system calls are not traced
• Summary - the requests for system services are displayed
• Detailed - the requests for system services are displayed along with
the arguments/parameters of the request
Trace
By default, traced system service requests appear in a CodeWarrior IDE
"console" window. To log traced system service requests to a file, select
the Trace checkbox. Click Browse to display a dialog box and define the
path and name of this file. In a project created through the Power
Architecture New Project Wizard, use the library syscall.a rather than
a UART library for handling the output.
Table continues on the next page...
CodeWarrior Development Studio for Power Architecture Processors Targeting Manual, Rev. 10.5.0,
06/2015
Freescale Semiconductor, Inc.
115
Using Debug Configurations Dialog Box
Table 4-9. System Call Services Page Options
(continued)
Option
Description
Root folder
The directory on the host system which contains the OS routines that the
bareboard program uses for system calls.
4.1.3.6 Other Executables
Use this page to specify additional ELF files to download or debug in addition to the
main executable file associated with the launch configuration.
Figure 4-9. Debugger Options-Other Executables Page
The table below lists the various options available on the Other Executables page.
Table 4-10. Debugger Options - Other Executables
Option
File list
Description
Shows files and projects that the debugger uses during each debug session.
Debug column:
Table continues on the next page...
CodeWarrior Development Studio for Power Architecture Processors Targeting Manual, Rev. 10.5.0,
06/2015
116
Freescale Semiconductor, Inc.
Chapter 4 Debug Configurations
Table 4-10. Debugger Options - Other Executables (continued)
Option
Description
• Checked-The debugger loads
symbolics for the file.
• Cleared-The debugger does not
load symbolics for the file.
Download column:
• Checked-The debugger
downloads the file to the Target
Device.
• Cleared-The debugger does not
download the file to the Target
Device.
Add
Click to open the Debug Other Executable dialog box, and add other executable
file to debug while debugging this target.
Use this dialog box to specify the following settings:
• Specify the location of the additional executable - Enter the path to the
executable file that the debugger controls in addition to the current project's
executable file. Alternatively, click Workspace, File System, or Variables to
specify the file path.
• Load symbols - Check to have the debugger load symbols for the specified
file. Clear to prevent the debugger from loading the symbols. The Debug
column of the File list corresponds this setting.
• Download to device - Check to have the debugger download the specified
file to the target device. Specify the path of the file in the Specify the remote
download path text box. Clear the Download to device checkbox to
prevent the debugger from downloading the file to the device. The
Download column of the File list corresponds to the Download to device
setting.
• OK - Click to add the information that you specify in the Debug Other
Executable dialog box to the File list.
Change
Click to change the settings for the entry currently selected in the File list column.
Change this information as needed, then click the OK button to update the entry in
the File list.
Remove
Click to remove the entry currently selected in the File list.
4.1.3.7 Symbolics
Use this page to specify whether the IDE keeps symbolics in memory.
Symbolics represent an application's debugging and symbolic information. Keeping
symbolics in memory, known as caching symbolics, is beneficial when you debug a
large-size application.
Consider a situation in which the debugger loads symbolics for a large application, but
does not download content to a hardware device and the project uses custom makefiles
with several build steps to generate this application. In such a situation, caching
CodeWarrior Development Studio for Power Architecture Processors Targeting Manual, Rev. 10.5.0,
06/2015
Freescale Semiconductor, Inc.
117
Using Debug Configurations Dialog Box
symbolics helps speed up the debugging process. The debugger uses the readily available
cached symbolics during subsequent debugging sessions. Otherwise, the debugger spends
significant time creating an in-memory representation of symbolics during subsequent
debugging sessions.
NOTE
Caching symbolics provides the most benefit for large
applications, where doing so speeds up application-launch time.
If you debug a small application, caching symbolics does not
significantly improve the launch times.
Figure 4-10. Debugger Options-Symbolics page
The table below lists the various options available on the Symbolics page.
Table 4-11. Debugger Options - Symbolics
Option
Cache Symbolics Between Sessions
Description
Check this option to have the debugger cache symbolics between
debugging sessions. If you check this checkbox and clear the Create and
Use Copy of Executable checkbox, the executable file remains locked
after the debugging session ends. In the Debug view, right-click the locked
file and select Un-target Executables to have the debugger delete its
symbolics cache and release the file lock. The IDE enables this menu
command when there are currently unused cached symbolics that it can
purge.
Clear this option so that the debugger does not cache symbolics between
debugging sessions.
Table continues on the next page...
CodeWarrior Development Studio for Power Architecture Processors Targeting Manual, Rev. 10.5.0,
06/2015
118
Freescale Semiconductor, Inc.
Chapter 4 Debug Configurations
Table 4-11. Debugger Options - Symbolics (continued)
Option
Create and Use Copy of Executable
Description
Check this option to have the debugger create and use a copy of the
executable file. Using the copy helps avoid file-locking issues with the
build system. If you check this checkbox, the IDE can build the executable
file in the background during a debugging session.
Clear this option so that the debugger does not create and use a copy of
the executable file.
4.1.3.8 OS Awareness
Use this page to specify the operating system (OS) that resides on the target device.
Figure 4-11. Debugger Options-OS Awareness page
CodeWarrior Development Studio for Power Architecture Processors Targeting Manual, Rev. 10.5.0,
06/2015
Freescale Semiconductor, Inc.
119
Using Debug Configurations Dialog Box
The table below lists the options available on the OS Awareness page.
Table 4-12. OS Awareness Page Options
Option
Description
Target OS
Use the Target OS list box to specify the OS that runs on the
target device, or specify None to have the debugger use the
bareboard.
Boot Parameters tab
Enable Command Line Settings: Check this option to specify
settings for regular initialization. Enter the specific command
line parameters in the Command Line and Base Address
text boxes.
Enable Initial RAM Disk Settings: Check this option to specify
settings for flattened device tree initialization that downloads
parameters to the kernel during its initialization. You can
specify a .dts file that contains initialization information.
• File Path: Specifies the path of the RAM disk that you
transferred from the Linux machine
• Address: Specifies the address specified in Linux, initrdstart from the dts file
• Size: Specifies the size of the dts file
• Download to target: Downloads the initial RAM disk
settings to the target
Open Firmware Device Tree Settings: Check this option to
load parameters to the kernel from a bootloader on Power
Architecture processors
• File Path: Specifies the path to the dtb file for kernel
debug
• Address: Specifies the address specified in Linux, initrdstart from the dts file
Debug tab
Specifies the parameters required for Linux kernel debug.
• Enable Memory Translation: Check this option to
translate memory by specifying the following values:
• Physical Base Address: This is the
CONFIG_PHYSICAL_START option of the kernel
configuration
• Virtual Base Address: This is the
CONFIG_KERNEL_START option of the kernel
configuration
• Memory Size: This is the
CONFIG_LOWMEM_SIZE option of the kernel
configuration
Note: The virtual memory space should not overflow the 32bit memory space. This indicates that the Virtual Base
Address + Memory Size should not be greater than
0xFFFFFFFF. CodeWarrior displays an error when this
happens.
• Enable Threaded Debugging Support: Check this option
to enable support for Linux kernel threaded debugging
Table continues on the next page...
CodeWarrior Development Studio for Power Architecture Processors Targeting Manual, Rev. 10.5.0,
06/2015
120
Freescale Semiconductor, Inc.
Chapter 4 Debug Configurations
Table 4-12. OS Awareness Page Options (continued)
Option
Description
• Update Background Threads on Stop: Check this option
only if you want to update the background threads on
stop. Keep this option unchecked as it may increase
debug speed.
• Enable Delayed Software Breakpoint Support: Check
this option to enable support for delayed software
breakpoints during kernel debug
Modules tab
This tab allows you to add modules to the Linux kernel project
and configure the module's symbolics mapping. For more
information on the Modules tab, see Configuring the Modules'
Symbolics Mapping.
4.1.4 Trace and Profile
Use this tab to configure the selected launch configuration for simulator and hardware
profiling.
CodeWarrior Development Studio for Power Architecture Processors Targeting Manual, Rev. 10.5.0,
06/2015
Freescale Semiconductor, Inc.
121
Using Debug Configurations Dialog Box
Figure 4-12. Debug Configurations-Trace and Profile Tab
The table below lists the various options available on the Trace and Profile tab page.
Table 4-13. Trace and Profile Tab Options
Option
Description
Start a trace session
Select to start the trace session immediately on launch.
Default trace Configuration
Select the default trace configuration. The Show all configurations option
will display all the trace configurations available in the Default trace
Configuration drop-down list and the Only show configurations for the
associated project option will display those configurations which are
related to the selected project.
Edit
Click to modify the selected configuration.
Trace Collection
Select the trace collection mode.
Table continues on the next page...
CodeWarrior Development Studio for Power Architecture Processors Targeting Manual, Rev. 10.5.0,
06/2015
122
Freescale Semiconductor, Inc.
Chapter 4 Debug Configurations
Table 4-13. Trace and Profile Tab Options (continued)
Option
CodeWarrior configures the target and enables
trace collection
Description
Select to configure and control trace collection. If the target is running
and must be suspended to configure trace hardware - Click to
suspend the target to configure trace hardware.
• Suspend and resume the target automatically - Select to
suspend the target automatically for trace configuration. If this option
is enabled and you choose to configure trace while the target is
running, the target suspends immediately while trace configuration is
applied, and then resumes automatically.
• Wait until the target is resumed manually - Select to suspend and
resume the target for trace configuration manually. If this option is
enabled and you choose to configure trace while the target is
running, the configuration is changed, but not applied to the target
until the target is suspended and resumed.
After configuring trace hardware, start trace collection - Select the
option to start trace collection after configuring the trace hardware.
• Automatically - Select to start trace collection immediately after
configuring trace hardware.
• Manually from the toolbar or by an Analysis Point - Click to start
your trace session and configure trace hardware with trace collection
disabled. Trace collection will be enabled later by clicking Start
Collection or by executing code at an Analysis Point
Stop trace collection when the core is suspended - Select to stop trace
collection. When the trace collection stops, upload trace results Select to upload trace results after the trace collection is stopped.
• Automatically - Click to save data to the Trace.dat file
automatically after collection completes or is stopped.
• Manually from the toolbar - Click to save the trace data manually
to the Trace.dat file.
The application configures the target and
enables trace collection
Click to start collecting new trace data for the trace session using your
application.
Trace display
Display new trace data automatically
NOTE
For more information on Trace, see the Tracing and Analysis
Tools User Guide available in the <CWInstallDir>\PA\Help\PDF
folder, where CWInstallDir is the installation directory of your
CodeWarrior software.
4.1.5 Source
Use this tab to specify the location of source files used when debugging a C application.
By default, this information is taken from the build path of your project.
CodeWarrior Development Studio for Power Architecture Processors Targeting Manual, Rev. 10.5.0,
06/2015
Freescale Semiconductor, Inc.
123
Using Debug Configurations Dialog Box
Figure 4-13. Debug Configurations-Source tab
The table below lists the various options available on the Source tab page.
Table 4-14. Source Tab Options
Option
Description
Source Lookup Path
Lists the source paths used to load an image after connecting
the debugger to the target.
Add
Click to add new source containers to the Source Lookup
Path search list.
Edit
Click to modify the content of the selected source container.
Remove
Click to remove selected items from the Source Lookup
Path list.
Up
Click to move selected items up the Source Lookup Path
list.
Down
Click to move selected items down the Source Lookup Path
list.
Restore Default
Click to restore the default source search list.
Search for duplicate source files on the path
Select to search for files with the same name on a selected
path.
4.1.6 Environment
CodeWarrior Development Studio for Power Architecture Processors Targeting Manual, Rev. 10.5.0,
06/2015
124
Freescale Semiconductor, Inc.
Chapter 4 Debug Configurations
Use this tab to specify the environment variables and values to use when an application
runs.
Figure 4-14. Debug Configuration-Environment tab
The table below lists the various options available on the Environment tab page.
Table 4-15. Environment Tab Options
Option
Description
Environment Variables to set
Lists the environment variable name and its value.
New
Click to create a new environment variable.
Select
Click to select an existing environment variable.
Edit
Click to modify the name and value of a selected environment
variable.
Remove
Click to remove selected environment variables from the list.
Append environment to native environment
Select to append the listed environment variables to the
current native environment.
Replace native environment with specified environment
Select to replace the current native environment with the
specified environment set.
4.1.7 Common
CodeWarrior Development Studio for Power Architecture Processors Targeting Manual, Rev. 10.5.0,
06/2015
Freescale Semiconductor, Inc.
125
Using Debug Configurations Dialog Box
Use this tab to specify the location to store your run configuration, standard input and
output, and background launch options.
Figure 4-15. Debug Configuration-Common tab
The table below lists the various options available on the Common tab page.
Table 4-16. Common Tab Options
Option
Description
Local file
Select to save the launch configuration locally.
Shared file
Select to specify the path of, or browse to, a workspace to store the launch
configuration file, and be able to commit it to a repository.
Display in favorites menu
Select to add the configuration name to Run or Debug menus for easy selection.
Encoding
Select an encoding scheme to use for console output.
Allocate Console (necessary for
input)
Select to assign a console view to receive the output. You must select this option if you
want to use the host CodeWarrior to view the output of the debugged application.
File
Specify the file name to save output. For Linux applications, this option provides a way
to select a host-side file to redirect the output forwarded by CodeWarrior TRK to host
CodeWarrior (if redirections are specified in the Arguments tab, then this feature makes
no sense because redirections are using target-side files).
Workspace
Specifies the path of, or browse to, a workspace to store the output file.
File System
Specifies the path of, or browse to, a file system directory to store the output file.
Variables
Select variables by name to include in the output file.
Table continues on the next page...
CodeWarrior Development Studio for Power Architecture Processors Targeting Manual, Rev. 10.5.0,
06/2015
126
Freescale Semiconductor, Inc.
Chapter 4 Debug Configurations
Table 4-16. Common Tab Options (continued)
Option
Description
Append
Select to append output. Clear to recreate file each time. Selecting this option means
that the file (host-side file, in case of Linux applications) mentioned in the File text box
will not be overwritten for new content. Instead, the new content will be appended to
the file.
Port
Select to redirect standard output ( stdout, stderr) of a process being debugged to
a user specified socket.
NOTE: You can also use the redirect command in debugger shell to redirect
standard output streams to a socket.
Act as Server
Select to redirect the output from the current process to a local server socket bound to
the specified port.
Hostname/IP Address
Select to redirect the output from the current process to a server socket located on the
specified host and bound to the specified port. The debugger will connect and write to
this server socket via a client socket created on an ephemeral port
Launch in background
Select to launch configuration in background mode.
4.2 Customizing Debug Configurations
When you use the CodeWarrior wizard to create a new project, the wizard sets the
project's launch configurations to default values.
You can change the default values of your project's launch configurations, according to
your program's requirements.
To modify the launch configurations:
1. Start the CodeWarrior IDE.
2. From the main menu bar of the IDE, select Run > Debug Configurations.
The Debug Configurations dialog box appears. The left side of this dialog box has a
list of debug configurations that apply to the current application.
3. Expand the CodeWarrior configuration.
4. From the expanded list, select the debug configuration that you want to modify.
The follwoing figure shows the Debug Configurations dialog box with the settings
for the debug configuration you selected.
CodeWarrior Development Studio for Power Architecture Processors Targeting Manual, Rev. 10.5.0,
06/2015
Freescale Semiconductor, Inc.
127
Customizing Debug Configurations
Figure 4-16. CodeWarrior Debug Configuration-Main tab
5. In the group of tabs in the upper-right side of the dialog box, click a tab.
6. Change the settings on the debug configuration page as per your requirements. See
Using Debug Configurations Dialog Box for details on the various settings of this
page.
7. Click Apply to save the new settings.
When you finish, you can click Debug to start a new debugging session, or click Close to
save your changes and close the Debug Configurations dialog box.
CodeWarrior Development Studio for Power Architecture Processors Targeting Manual, Rev. 10.5.0,
06/2015
128
Freescale Semiconductor, Inc.
Chapter 4 Debug Configurations
4.3 Reverting Debug Configuration Settings
After making some modifications in a debug configuration's settings, you can either save
the pending (unsaved) changes or revert to last saved settings.
To save the pending changes, click the Apply button of the Debug Configurations
dialog box, or click the Close button and then the Yes button.
To undo pending changes and restore the last saved settings, click the Revert button at
the bottom of the Debug Configurations dialog box.
The IDE restores the last set of saved settings to all pages of the Debug Configurations
dialog box. Also, the IDE disables the Revert button until you make new pending
changes.
CodeWarrior Development Studio for Power Architecture Processors Targeting Manual, Rev. 10.5.0,
06/2015
Freescale Semiconductor, Inc.
129
Reverting Debug Configuration Settings
CodeWarrior Development Studio for Power Architecture Processors Targeting Manual, Rev. 10.5.0,
06/2015
130
Freescale Semiconductor, Inc.
Chapter 5
Working with Debugger
This chapter explains various aspects of CodeWarrior debugging, such as debugging a
project, connection types, setting breakpoints and watchpoints, working with registers,
viewing memory, viewing cache, and debugging externally built executable files.
NOTE
This chapter documents debugger features that are specific to
CodeWarrior Development Studio for Power Architecture. For
more information on debugger features that are common in all
CodeWarrior products, see CodeWarrior Development Studio
Common Features Guide.
This chapter explains:
•
•
•
•
•
•
•
•
•
•
•
•
•
•
•
•
•
Debugging a CodeWarrior project
Consistent debug control
Connection types
JTAG diagnostics tests
Editing remote system configuration
Memory translations
CodeWarrior Command-Line Debugger
Working with Breakpoints
Working with Watchpoints
Working with Registers
Viewing memory
Viewing Cache
Changing Program Counter Value
Hard resetting
Setting Stack Depth
Import a CodeWarrior Executable file Wizard
Debugging Externally Built Executable Files
CodeWarrior Development Studio for Power Architecture Processors Targeting Manual, Rev. 10.5.0,
06/2015
Freescale Semiconductor, Inc.
131
Debugging a CodeWarrior project
5.1 Debugging a CodeWarrior project
This section explains how to change the debugger settings and how to debug a
CodeWarrior project.
The CodeWarrior Bareboard Project Wizard or the CodeWarrior Linux Project Wizard
sets the debugger settings of a project's launch configurations to default values. You can
change these default values as per your requirements.
To change the debugger settings and start debugging a CodeWarrior project, perform
these steps:
1. From the CodeWarrior IDE menu bar, select Run > Debug Configurations. The
CodeWarrior IDE uses the settings in the launch configuration to generate debugging
information and initiate communications with the target board.
The Debug Configurations dialog box appears. The left side of this dialog box has a
list of debug configurations that apply to the current application.
2. Expand the CodeWarrior configuration.
3. From the expanded list, select the debug configuration that you want to modify.
4. Click Apply to save the new settings.
Tip
You can click Revert to undo any of the unsaved changes.
The CodeWarrior IDE restores the last set of saved settings
to all pages of the Debug Configurations dialog box. Also,
the IDE disables Revert until you make new pending
changes.
5. Click Debug to start the debugging session.
You just modified the debugger settings and initialized a debugging session.
5.2 Consistent debug control
This section describes the consistent debug control feature of the CodeWarrior debugger.
CodeWarrior Development Studio for Power Architecture Processors Targeting Manual, Rev. 10.5.0,
06/2015
132
Freescale Semiconductor, Inc.
Chapter 5 Working with Debugger
When you attempt to stop the target during a debugging session, the consistent debug
control feature enables the debugger to report core's Doze and Nap low power
management states.
In addition, the debugger at the same time grants you access to the system states, such as
core registers, TLB registers, caches, and so on.
When you attempt to resume the debugging session, the debugger displays a warning
message and puts the respective core in the same power management state (Doze or Nap,
whichever is the previous one). The debugger waits for the core to exit out of Doze or
Nap state to continue with the attempted operation.
5.3 Connection types
This section describes the different connection types provided by CodeWarrior debugger
for connecting the target board to a computer.
The connection types supported by CodeWarrior debugger are:
•
•
•
•
•
•
•
•
CCSSIM2 ISS
Ethernet TAP
Gigabit TAP + Trace
Gigabit TAP
Simics
TCF
USB TAP
CodeWarrior TAP
5.3.1 CCSSIM2 ISS
Select this connection type to connect to simulators based on the CCSSIM2 ISS interface.
To configure the settings of the CCSSIM2 ISS connection type, perform the following
steps:
1. Select Run > Debug Configurations.
The Debug Configurations dialog box appears.
2. In the Connection group, click Edit next to the Connection drop-down list.
CodeWarrior Development Studio for Power Architecture Processors Targeting Manual, Rev. 10.5.0,
06/2015
Freescale Semiconductor, Inc.
133
Connection types
The Properties for <connection launch configuration> window appears.
3. Select CCSSIM2 ISS from the Connection type drop-down list.
The Connection and Advanced tabs display options with respect to the settings of
the selected connection type.
The table below describes various options available on the Connection tab page.
Table 5-1. CCSSIM2 ISS - Connection Tab Options
Option
CCS server
Description
Automatic launch
Select to automatically launch the specified CCS
server on the specified port.
Server port number
Specifies the port number to launch the CCS
server on.
CCS executable
Select to specify the path of, or browse to, the
executable file of the CCS server.
Manual launch
Select to manually launch the specified CCS
server on the specified port.
Server hostname/IP
Specifies hostname or the IP address of the CCS
server.
Server port number
Specifies the port number to launch the CCS
server on.
Connect server to TAP
Select to enable the CCS server to connect to
the TAP.
The table below describes the various options available on the Advanced tab page.
Table 5-2. CCSSIM2 ISS - Advanced Tab Options
Option
Target connection lost settings
Advanced CCS settings
Description
Try to reconnect
If this option is selected, the lost CCS connection
between the target and host is reset. Select the
Timeout checkbox to specify the time interval (in
seconds) after which the connection will be lost.
Terminate the debug session
If this option is selected, the debug session is
terminated and the lost connection between
JTAG and CCS server is not reset.
Ask me
This is the default setting. If the CCS connection
is lost between the target and host, the user is
asked if the connection needs to be reset or
terminated.
CCS timeout
Specifies the CCS timeout period. If the target
does not respond in the provided time-interval,
you receive a CCS timeout error.
Enable logging
Select to display protocol logging in console.
CodeWarrior Development Studio for Power Architecture Processors Targeting Manual, Rev. 10.5.0,
06/2015
134
Freescale Semiconductor, Inc.
Chapter 5 Working with Debugger
5.3.2 Ethernet TAP
Select this connection type when Ethernet network is used as interface to communicate
with the hardware device.
To configure the settings of an Ethernet TAP connection type, perform the following
steps:
1. Select Run > Debug Configurations.
The Debug Configurations dialog box appears.
2. In the Connection group, click Edit next to the Connection drop-down list.
The Properties for <connection launch configuration> window appears.
3. Select the Ethernet TAP from the Connection type drop-down list.
The Connection and Advanced tabs display options with respect to the settings of
the selected connection type.
The table below describes various options available on the Connection tab page.
Table 5-3. Ethernet TAP - Connection Tab Options
Option
Description
Ethernet TAP
Hostname/IP
Specifies hostname or the IP address of the TAP.
JTAG settings
JTAG clock speed (kHz)
Specifies the JTAG clock speed. By default, set
to 10230 kHz.
CCS server
Automatic launch
Select to automatically launch the specified CCS
server on the specified port.
Server port number
Specifies the port number to launch the CCS
server on.
CCS executable
Click to specify the path of, or browse to, the
executable file of the CCS server.
Manual launch
Select to manually launch the specified CCS
server on the specified port.
Server hostname/IP
Specifies hostname or the IP address of the CCS
server.
Server port number
Specifies the port number to launch the CCS
server on.
Connect server to TAP
Select to enable the CCS server to connect to
the TAP.
The table below describes the various options available on the Advanced tab page.
CodeWarrior Development Studio for Power Architecture Processors Targeting Manual, Rev. 10.5.0,
06/2015
Freescale Semiconductor, Inc.
135
Connection types
Table 5-4. Ethernet TAP - Advanced Tab Options
Option
Target connection lost settings
Advanced CCS settings
Description
Try to reconnect
If this option is selected, the lost CCS connection
between the target and host is reset. Select the
Timeout checkbox to specify the time interval (in
seconds) after which the connection will be lost.
Terminate the debug session
If this option is selected, the debug session is
terminated and the lost connection between
JTAG and CCS server is not reset.
Ask me
This is the default setting. If the CCS connection
is lost between the target and host, the user is
asked if the connection needs to be reset or
terminated.
CCS timeout
Specifies the CCS timeout period. If the target
does not respond in the provided time-interval,
you receive a CCS timeout error.
Enable logging
Select to display protocol logging in console.
JTAG config file
Advanced TAP settings
This panel displays the JTAG configuration file
being used. This panel is populated only if you
have selected a JTAG configuration file for your
project. If a JTAG configuration file is not
selected, this panel displays a None value. For
more details on JTAG configuration files, see the
JTAG Configuration Files chapter.
Force shell download
Select to force a reload of the TAP shell
software.
Disable fast download
Select to disable fast download.
NOTE: This option is not available for e500mc,
e5500, and e6500 core based targets.
Enable JTAG diagnostics
When selected, the option enables performing
advanced diagnostics of the JTAG connection to
be used during custom board bring-up. After the
connection to the probe has been established the
debugger performs the JTAG diagnostics tests
(Power at probe, IR scan check, Bypass (DR)
scan check, Arbitrary TAP state move, IDCODE
scan check) and the result of the tests are printed
to the console log and in case of an error, a
CodeWarrior Alert box appears. When this option
is not selected, the CodeWarrior debugger only
performs a limited test while configuring the
JTAG chain. It checks if the PWR pin is correctly
connected and displays a Cable disconnected
error if not connected properly. The connection
details are provided in the CCS protocol log
along with the JTAG ID and in case of an error, a
CodeWarrior Alert box appears. See JTAG
diagnostics tests for more information on JTAG
diagnostics tests.
Secure debug key
Select to enable the debugger to unlock the
secured board with the secure debug key
provided in the associated text box. If this option
is not selected, you will receive a secure debug
Table continues on the next page...
CodeWarrior Development Studio for Power Architecture Processors Targeting Manual, Rev. 10.5.0,
06/2015
136
Freescale Semiconductor, Inc.
Chapter 5 Working with Debugger
Table 5-4. Ethernet TAP - Advanced Tab Options (continued)
Option
Description
violation error when you try to debug on the
locked board.
NOTE: If you provide a wrong key and an
unlock sequence is run by the debugger
with the erroneous key, the associated
part will be locked until a rest occurs
and you will need to reset the target to
connect again. For the P1010
processor, if you have one failed
attempt with a wrong key then a
subsequent unlock sequence with a
valid key will succeed. But, if you
provide a wrong key twice, you will need
to hard reset the board before the next
attempt.
Reset Delay (ms)
Specifies the time in milliseconds that
CodeWarrior takes to gain control of the target,
after issuing a reset. The default value for this
option is 200 ms. The delay needs to be
increased if the debugger connection does not
work reliably, after issuing the reset. This can
happen for specific boards and in scenarios
where the pre-boot loader (PBL) is used to
perform boot image manipulation (for example,
copying U-Boot from SPI flash to internal cache/
SRAM during reset) that does not complete
within the default reset timeout window. A good
start value to test out board-specific requirements
in such cases is 1000 ms; however, this value
may need to be increased for very large PBL
transfers.
NOTE: Reset delay is supported for processors
based on the e500mc, e5500, and
e6500 cores.
5.3.3 Gigabit TAP + Trace
Select this connection type when Gigabit TAP and Trace is used as interface to
communicate with the hardware device.
To configure the settings of a Gigabit TAP + Trace connection type, perform the
following steps:
1. Select Run > Debug Configurations.
The Debug Configurations dialog box appears.
CodeWarrior Development Studio for Power Architecture Processors Targeting Manual, Rev. 10.5.0,
06/2015
Freescale Semiconductor, Inc.
137
Connection types
2. In the Connection group, click Edit next to the Connection drop-down list.
The Properties for <connection launch configuration> window appears.
3. Select the Gigabit TAP + Trace from the Connection type drop-down list.
The Connection and Advanced tabs display the options with respect to the settings
of the selected connection type.
The table below describes various options available on the Connection tab page.
Table 5-5. Gigabit TAP + Trace - Connection Tab Options
Option
Gigabit TAP + Trace
Description
Hostname/IP
Specifies hostname or the IP address of the TAP.
Debug connection
Specifies the type of debug connection to use.
The options available are JTAG over JTAG cable
connection, JTAG over Aurora cable connection,
and Aurora connection.
JTAG settings
JTAG clock speed (kHz)
Specifies the JTAG clock speed. By default, set
to 10230 kHz.
Aurora settings
Aurora data rate
Specifies the Aurora data rate, which refers to
the frequency with which the raw data bits are
transferred on the wire. The Aurora connection is
used only for trace analysis.
CCS server
Automatic launch
Select to automatically launch the specified CCS
server on the specified port.
Server port number
Specifies the port number to launch the CCS
server on.
CCS executable
Select to specify the path of, or browse to, the
executable file of the CCS server.
Manual launch
Select to manually launch the specified CCS
server on the specified port.
Server hostname/IP
Specifies hostname or the IP address of the CCS
server.
Server port number
Specifies the port number to launch the CCS
server on.
Connect server to TAP
Select to enable the CCS server to connect to
the TAP.
The table below describes the various options available on the Advanced tab page.
Table 5-6. Gigabit TAP + Trace - Advanced Tab Options
Option
Target connection lost settings
Description
Try to reconnect
If this option is selected, the lost CCS connection
between the target and host is reset. Select the
Timeout checkbox to specify the time interval (in
seconds) after which the connection will be lost.
Table continues on the next page...
CodeWarrior Development Studio for Power Architecture Processors Targeting Manual, Rev. 10.5.0,
06/2015
138
Freescale Semiconductor, Inc.
Chapter 5 Working with Debugger
Table 5-6. Gigabit TAP + Trace - Advanced Tab Options (continued)
Option
Advanced CCS settings
Description
Terminate the debug session
If this option is selected, the debug session is
terminated and the lost connection between
JTAG and CCS server is not reset.
Ask me
This is the default setting. If the CCS connection
is lost between the target and host, the user is
asked if the connection needs to be reset or
terminated.
CCS timeout
Specifies the CCS timeout period. If the target
does not respond in the provided time-interval,
you receive a CCS timeout error.
Enable logging
Select to display protocol logging in console.
JTAG config file
Advanced TAP settings
This panel displays the JTAG configuration file
being used. This panel is populated only if you
have selected a JTAG configuration file for your
project. If a JTAG configuration file is not
selected, this panel displays a None value. For
more details on JTAG configuration files, see the
JTAG Configuration Files chapter.
Force shell download
Select to force a reload of the TAP shell
software.
Disable fast download
Select to disable fast download.
NOTE: This option is not available for
processors based on e500mc, e5500,
and e6500 cores.
Enable JTAG diagnostics
When selected, the option enables performing
advanced diagnostics of the JTAG connection to
be used during custom board bring-up. After the
connection to the probe has been established the
debugger performs the JTAG diagnostics tests
(Power at probe, IR scan check, Bypass (DR)
scan check, Arbitrary TAP state move, IDCODE
scan check) and the result of the tests are printed
to the console log and in case of an error, a
CodeWarrior Alert box appears. When this option
is not selected, the CodeWarrior debugger only
performs a limited test while configuring the
JTAG chain. It checks if the PWR pin is correctly
connected and displays a Cable disconnected
error if not connected properly. The connection
details are provided in the CCS protocol log
along with the JTAG ID and in case of an error, a
CodeWarrior Alert box appears. See JTAG
diagnostics tests for more information on JTAG
diagnostics tests.
Secure debug key
Select to enable the debugger to unlock the
secured board with the secure debug key
provided in the associated text box. If this option
is not selected, you will receive a secure debug
violation error when you try to debug on the
locked board.
Table continues on the next page...
CodeWarrior Development Studio for Power Architecture Processors Targeting Manual, Rev. 10.5.0,
06/2015
Freescale Semiconductor, Inc.
139
Connection types
Table 5-6. Gigabit TAP + Trace - Advanced Tab Options (continued)
Option
Description
NOTE: If you provide a wrong key and an
unlock sequence is run by the debugger
with the erroneous key, the associated
part will be locked until a rest occurs
and you will need to reset the target to
connect again. For the P1010
processor, if you have one failed
attempt with a wrong key then a
subsequent unlock sequence with a
valid key will succeed. But, if you
provide a wrong key twice, you will need
to hard reset the board before the next
attempt.
Reset Delay (ms)
Specifies the time in milliseconds that
CodeWarrior takes to gain control of the target,
after issuing a reset. The default value for this
option is 200 ms. The delay needs to be
increased if the debugger connection does not
work reliably, after issuing the reset. This can
happen for specific boards and in scenarios
where the PBL is used to perform boot image
manipulation (for example, copying U-Boot from
SPI flash to internal cache/SRAM during reset)
that does not complete within the default reset
timeout window. A good start value to test out
board-specific requirements in such cases is
1000 ms; however, this value may need to be
increased for very large PBL transfers.
NOTE: Reset delay is supported for processors
based on the e500mc, e5500, and
e6500 cores.
5.3.4 Gigabit TAP
Select this connection type when Gigabit TAP is used as interface to communicate with
the hardware device.
To configure the settings of a Gigabit TAP connection type, perform the following steps:
1. Select Run > Debug Configurations.
The Debug Configurations dialog box appears.
2. In the Connection group, click Edit next to the Connection drop-down list.
The Properties for <connection launch configuration> window appears.
CodeWarrior Development Studio for Power Architecture Processors Targeting Manual, Rev. 10.5.0,
06/2015
140
Freescale Semiconductor, Inc.
Chapter 5 Working with Debugger
3. Select the Gigabit TAP from the Connection type drop-down list.
The Connection and Advanced tabs display options with respect to the settings of
the selected connection type.
The table below describes various options available on the Connection tab page.
Table 5-7. Gigabit TAP - Connection Tab Options
Option
Description
Gigabit TAP
Hostname/IP
Specifies hostname or the IP address of the TAP.
JTAG settings
JTAG clock speed (kHz)
Specifies the JTAG clock speed. By default, set
to 10230 kHz.
CCS server
Automatic launch
Select to automatically launch the specified CCS
server on the specified port.
Server port number
Specifies the port number to launch the CCS
server on.
CCS executable
Click to specify the path of, or browse to, the
executable file of the CCS server.
Manual launch
Select to manually launch the specified CCS
server on the specified port.
Server hostname/IP
Specifies hostname or the IP address of the CCS
server.
Server port number
Specifies the port number to launch the CCS
server on.
Connect server to TAP
Select to enable the CCS server to connect to
the TAP.
The table below describes the various options available on the Advanced tab page.
Table 5-8. Gigabit TAP - Advanced Tab Options
Option
Target connection lost settings
Advanced CCS settings
Description
Try to reconnect
If this option is selected, the lost CCS connection
between the target and host is reset. Select the
Timeout checkbox to specify the time interval (in
seconds) after which the connection will be lost.
Terminate the debug session
If this option is selected, the debug session is
terminated and the lost connection between
JTAG and CCS server is not reset.
Ask me
This is the default setting. If the CCS connection
is lost between the target and host, the user is
asked if the connection needs to be reset or
terminated.
CCS timeout
Specifies the CCS timeout period. If the target
does not respond in the provided time-interval,
you receive a CCS timeout error.
Enable logging
Select to display protocol logging in console.
Table continues on the next page...
CodeWarrior Development Studio for Power Architecture Processors Targeting Manual, Rev. 10.5.0,
06/2015
Freescale Semiconductor, Inc.
141
Connection types
Table 5-8. Gigabit TAP - Advanced Tab Options (continued)
Option
Description
JTAG config file
Advanced TAP settings
This panel displays the JTAG configuration file
being used. This panel is populated only if you
have selected a JTAG configuration file for your
project. If a JTAG configuration file is not
selected, this panel displays a None value. For
more details on JTAG configuration files, see the
JTAG Configuration Files chapter.
Force shell download
Select to force a reload of the TAP shell
software.
Disable fast download
Select to disable fast download.
NOTE: This option is not available for
processors based on e500mc, e5500,
and e6500 cores.
Enable JTAG diagnostics
When selected, the option enables performing
advanced diagnostics of the JTAG connection to
be used during custom board bring-up. After the
connection to the probe has been established the
debugger performs the JTAG diagnostics tests
(Power at probe, IR scan check, Bypass (DR)
scan check, Arbitrary TAP state move, IDCODE
scan check) and the result of the tests are printed
to the console log and in case of an error, a
CodeWarrior Alert box appears. When this option
is not selected, the CodeWarrior debugger only
performs a limited test while configuring the
JTAG chain. It checks if the PWR pin is correctly
connected and displays a Cable disconnected
error if not connected properly. The connection
details are provided in the CCS protocol log
along with the JTAG ID and in case of an error, a
CodeWarrior Alert box appears. See JTAG
diagnostics tests for more information on JTAG
diagnostics tests.
Secure debug key
Select to enable the debugger to unlock the
secured board with the secure debug key
provided in the associated text box. If this option
is not selected, you will receive a secure debug
violation error when you try to debug on the
locked board.
NOTE: If you provide a wrong key and an
unlock sequence is run by the debugger
with the erroneous key, the associated
part will be locked until a rest occurs
and you will need to reset the target to
connect again. For the P1010
processor, if you have one failed
attempt with a wrong key then a
subsequent unlock sequence with a
valid key will succeed. But, if you
provide a wrong key twice, you will need
to hard reset the board before the next
attempt.
Table continues on the next page...
CodeWarrior Development Studio for Power Architecture Processors Targeting Manual, Rev. 10.5.0,
06/2015
142
Freescale Semiconductor, Inc.
Chapter 5 Working with Debugger
Table 5-8. Gigabit TAP - Advanced Tab Options (continued)
Option
Description
Reset Delay (ms)
Specifies the time in milliseconds that
CodeWarrior takes to gain control of the target,
after issuing a reset. The default value for this
option is 200 ms. The delay needs to be
increased if the debugger connection does not
work reliably, after issuing the reset. This can
happen for specific boards and in scenarios
where the PBL is used to perform boot image
manipulation (for example, copying U-Boot from
SPI flash to internal cache/SRAM during reset)
that does not complete within the default reset
timeout window. A good start value to test out
board-specific requirements in such cases is
1000 ms; however, this value may need to be
increased for very large PBL transfers.
NOTE: Reset delay is supported for processors
based on the e500mc, e5500, and
e6500 cores.
5.3.5 Simics
Select this connection type when Simics simulator is used.
To configure the settings of a Simics connection type, perform the following steps:
1. Select Run > Debug Configurations.
The Debug Configurations dialog box appears.
2. In the Connection group, click Edit next to the Connection drop-down list.
The Properties for <connection launch configuration> window appears.
3. Select Simics from the Connection type drop-down list.
The Connection and Advanced tabs display the options with respect to the settings
of the selected connection type.
The table below describes various options available on the Connection tab page.
Table 5-9. Simics - Connection Tab Options
Option
Simics settings
Description
Model startup script
Specifies the Simics startup script.
Table continues on the next page...
CodeWarrior Development Studio for Power Architecture Processors Targeting Manual, Rev. 10.5.0,
06/2015
Freescale Semiconductor, Inc.
143
Connection types
Table 5-9. Simics - Connection Tab Options (continued)
Option
CCS server
Description
Simics executable
Specifies the Simics executable file.
CodeWarrior add-on
Specifies the Simics add-on for CodeWarrior
IDE.
Show Simics Control window
Select to allow control of the Simics environment.
Automatic launch
Select to automatically launch the specified CCS
server on the specified port.
Server port number
Specifies the port number to launch the CCS
server on.
CCS executable
Click to specify the path of, or browse to, the
executable file of the CCS server.
Manual launch
Select to manually launch the specified CCS
server on the specified port.
Server hostname/IP
Specifies hostname or the IP address of the CCS
server.
Server port number
Specifies the port number to launch the CCS
server on.
The table below describes the various options available on the Advanced tab page.
Table 5-10. Simics - Advanced Tab Options
Option
Target connection lost settings
Advanced CCS settings
Description
Try to reconnect
If this option is selected, the lost CCS connection
between the target and host is reset. Select the
Timeout checkbox to specify the time interval (in
seconds) after which the connection will be lost.
Terminate the debug session
If this option is selected, the debug session is
terminated and the lost connection between
JTAG and CCS server is not reset.
Ask me
This is the default setting. If the CCS connection
is lost between the target and host, the user is
asked if the connection needs to be reset or
terminated.
CCS timeout (seconds)
Specifies the CCS timeout period. If the target
does not respond in the provided time-interval,
you receive a CCS timeout error.
Enable logging
Select to display protocol logging in console.
5.3.6 TCF
Select this connection type when Simics simulator is used.
CodeWarrior Development Studio for Power Architecture Processors Targeting Manual, Rev. 10.5.0,
06/2015
144
Freescale Semiconductor, Inc.
Chapter 5 Working with Debugger
To configure the settings of a TCF connection type, perform the following steps:
1. Select Run > Debug Configurations.
The Debug Configurations dialog box appears.
2. In the Connection group, click Edit next to the Connection drop-down list.
The Properties for <connection launch configuration> window appears.
3. Select TCF from the Connection type drop-down list.
The Connection and Advanced tabs display the options with respect to the settings
of the selected connection type.
The table below describes various options available on the Connection tab page.
Table 5-11. TCF - Connection Tab Options
Option
Connection
Agent
Description
Hostname/IP
Specifies hostname or IP address of the host,
TCF agent runs on. 127.0.0.1 is used if the
agent runs locally.
Port
Specifies the TCP port the agent is listening on.
Enable Logging
Select to enable logging of all ongoing TCF traffic
in the Console view.
Connection timeout
Specifies connection timeout in seconds.
Start Agent
Select to start the agent and specify the run-time
properties.
Path to executable
Specifies the path to the TCF agent executable
file.
Arguments to pass
Specifies all the command line arguments to be
passed to the TCF agent while starting up.
Redirect stdout
Select to have the standard output and standard
error output redirected to the Console view in
CodeWarrior IDE.
The table below describes the various options available on the Advanced tab page.
Table 5-12. TCF - Advanced Tab Options
Option
Target connection lost settings
Description
Try to reconnect
If this option is selected, the lost CCS connection
between the target and host is reset. Select the
Timeout checkbox to specify the time interval (in
seconds) after which the connection will be lost.
Terminate the debug session
If this option is selected, the debug session is
terminated and the lost connection between
JTAG and CCS server is not reset.
Table continues on the next page...
CodeWarrior Development Studio for Power Architecture Processors Targeting Manual, Rev. 10.5.0,
06/2015
Freescale Semiconductor, Inc.
145
Connection types
Table 5-12. TCF - Advanced Tab Options (continued)
Option
Description
Ask me
This is the default setting. If the CCS connection
is lost between the target and host, the user is
asked if the connection needs to be reset or
terminated.
5.3.7 USB TAP
Select this connection type when USB TAP is used as interface to communicate with the
hardware device.
To configure the settings of a USB TAP connection type, perform the following steps:
1. Select Run > Debug Configurations.
The Debug Configurations dialog box appears.
2. In the Connection group, click Edit next to the Connection drop-down list.
The Properties for <connection launch configuration> window appears.
3. Select USB TAP from the Connection type drop-down list.
The Connection and Advanced tabs display the options with respect to the settings
of the selected connection type.
4. n
The table below describes various options available on the Connection tab page.
Table 5-13. USB TAP - Connection Tab Options
Option
Description
USB TAP
USB serial number
Select and specify the USB serial number of the
USB TAP, required only if using multiple USB
TAPs.
JTAG settings
JTAG clock speed (kHz)
Specifies the JTAG clock speed. By default, set
to 10230 kHz.
CCS server
Automatic launch
Select to automatically launch the specified CCS
server on the specified port.
Server port number
Specifies the port number to launch the CCS
server on.
CCS executable
Click to specify the path of, or browse to, the
executable file of the CCS server.
Table continues on the next page...
CodeWarrior Development Studio for Power Architecture Processors Targeting Manual, Rev. 10.5.0,
06/2015
146
Freescale Semiconductor, Inc.
Chapter 5 Working with Debugger
Table 5-13. USB TAP - Connection Tab Options (continued)
Option
Description
Manual launch
Select to manually launch the specified CCS
server on the specified port.
Server hostname/IP
Specifies hostname or the IP address of the CCS
server.
Server port number
Specifies the port number to launch the CCS
server on.
Connect server to TAP
Select to enable the CCS server to connect to
the TAP.
The table below describes the various options available on the Advanced tab page.
Table 5-14. USB TAP - Advanced Tab Options
Option
Target connection lost settings
Advanced CCS settings
Description
Try to reconnect
If this option is selected, the lost CCS connection
between the target and host is reset. Select the
Timeout checkbox to specify the time interval (in
seconds) after which the connection will be lost.
Terminate the debug session
If this option is selected, the debug session is
terminated and the lost connection between
JTAG and CCS server is not reset.
Ask me
This is the default setting. If the CCS connection
is lost between the target and host, the user is
asked if the connection needs to be reset or
terminated.
CCS timeout
Specifies the CCS timeout period. If the target
does not respond in the provided time-interval,
you receive a CCS timeout error.
Enable logging
Select to display protocol logging in console.
JTAG config file
Advanced TAP settings
This panel displays the JTAG configuration file
being used. This panel is populated only if you
have select a JTAG configuration file for your
project. If a JTAG configuration file is not
selected, this panel displays a None value. For
more details on JTAG configuration files, see the
JTAG Configuration Files chapter.
Force shell download
Select to force a reload of the TAP shell
software.
Disable fast download
Select to disable fast download.
NOTE: This option is not available for
processors based on e500mc, e5500,
and e6500 cores.
Enable JTAG diagnostics
When selected, the option enables performing
advanced diagnostics of the JTAG connection to
be used during custom board bring-up. After the
connection to the probe has been established the
debugger performs the JTAG diagnostics tests
(Power at probe, IR scan check, Bypass (DR)
Table continues on the next page...
CodeWarrior Development Studio for Power Architecture Processors Targeting Manual, Rev. 10.5.0,
06/2015
Freescale Semiconductor, Inc.
147
Connection types
Table 5-14. USB TAP - Advanced Tab Options (continued)
Option
Description
scan check, Arbitrary TAP state move, IDCODE
scan check) and the result of the tests are printed
to the console log and in case of an error, a
CodeWarrior Alert box appears. When this option
is not selected, the CodeWarrior debugger only
performs a limited test while configuring the
JTAG chain. It checks if the PWR pin is correctly
connected and displays a Cable disconnected
error if not connected properly. The connection
details are provided in the CCS protocol log
along with the JTAG ID and in case of an error, a
CodeWarrior Alert box appears. See JTAG
diagnostics tests for more information on JTAG
diagnostics tests.
Secure debug key
Select to enable the debugger to unlock the
secured board with the secure debug key
provided in the associated text box. If this option
is not selected, you will receive a secure debug
violation error when you try to debug on the
locked board.
NOTE: If you provide a wrong key and an
unlock sequence is run by the debugger
with the erroneous key, the associated
part will be locked until a rest occurs
and you will need to reset the target to
connect again. For the P1010
processor, if you have one failed
attempt with a wrong key then a
subsequent unlock sequence with a
valid key will succeed. But, if you
provide a wrong key twice, you will need
to hard reset the board before the next
attempt.
Reset Delay (ms)
Specifies the time in milliseconds that
CodeWarrior takes to gain control of the target,
after issuing a reset. The default value for this
option is 200 ms. The delay needs to be
increased if the debugger connection does not
work reliably, after issuing the reset. This can
happen for specific boards and in scenarios
where the PBL is used to perform boot image
manipulation (for example, copying U-Boot from
SPI flash to internal cache/SRAM during reset)
that does not complete within the default reset
timeout window. A good start value to test out
board-specific requirements in such cases is
1000 ms; however, this value may need to be
increased for very large PBL transfers.
NOTE: Reset delay is supported for processors
based on the e500mc, e5500, and
e6500 cores.
CodeWarrior Development Studio for Power Architecture Processors Targeting Manual, Rev. 10.5.0,
06/2015
148
Freescale Semiconductor, Inc.
Chapter 5 Working with Debugger
5.3.8 CodeWarrior TAP
Select this connection type when either the CodeWarrior TAP is used as interface to
communicate with the hardware device.
To configure the settings of a CodeWarrior TAP connection type, perform the
following steps:
1. Select Run > Debug Configurations.
The Debug Configurations dialog box appears.
2. In the Connection group, click Edit next to the Connection drop-down list.
The Properties for <connection launch configuration> window appears.
3. Select CodeWarrior TAP from the Connection type drop-down list.
The Connection and Advanced tabs display the options with respect to the settings
of the selected connection type.
The table below describes various options available on the Connection tab page.
Table 5-15. CodeWarrior TAP - Connection Tab Options
Option
CodeWarrior TAP
Description
Hardware Connection
Specifies CodeWarrior TAP interface to
communicate with the hardware device.
CodeWarrior TAP supports both USB and
Ethernet network interfaces.
Hostname/IP
Specifies hostname or the IP address of the TAP.
NOTE: Enabled only if Hardware Connection
is set to Ethernet.
Serial Number
Select and specify the USB serial number of the
USB TAP; required only if using multiple
CodeWarror TAPs (over USB).
JTAG settings
JTAG clock speed (kHz)
Specifies the JTAG clock speed. By default, set
to 10230 kHz.
CCS server
Automatic launch
Select to automatically launch the specified CCS
server on the specified port.
Server port number
Specifies the port number to launch the CCS
server on.
CCS executable
Click to specify the path of, or browse to, the
executable file of the CCS server.
Manual launch
Select to manually launch the specified CCS
server on the specified port.
Table continues on the next page...
CodeWarrior Development Studio for Power Architecture Processors Targeting Manual, Rev. 10.5.0,
06/2015
Freescale Semiconductor, Inc.
149
Connection types
Table 5-15. CodeWarrior TAP - Connection Tab Options (continued)
Option
Description
Server hostname/IP
Specifies hostname or the IP address of the CCS
server.
Server port number
Specifies the port number to launch the CCS
server on.
Connect server to TAP
Select to enable the CCS server to connect to
the CodeWarrior TAP.
The table below describes the various options available on the Advanced tab page.
Table 5-16. CodeWarrior TAP - Advanced Tab Options
Option
Target connection lost settings
Advanced CCS settings
Description
Try to reconnect
If this option is selected, the lost CCS connection
between the target and host is reset. Select the
Timeout checkbox to specify the time interval (in
seconds) after which the connection will be lost.
Terminate the debug session
If this option is selected, the debug session is
terminated and the lost connection between
JTAG and CCS server is not reset.
Ask me
This is the default setting. If the CCS connection
is lost between the target and host, the user is
asked if the connection needs to be reset or
terminated.
CCS timeout
Specifies the CCS timeout period. If the target
does not respond in the provided time-interval,
you receive a CCS timeout error.
Enable logging
Select to display protocol logging in console.
JTAG config file
Advanced TAP settings
This panel displays the JTAG configuration file
being used. This panel is populated only if you
have select a JTAG configuration file for your
project. If a JTAG configuration file is not
selected, this panel displays a None value. For
more details on JTAG configuration files, see the
JTAG Configuration Files chapter.
Force shell download
Select to force a reload of the TAP shell
software.
Disable fast download
Select to disable fast download.
NOTE: This option is not available for e500mc,
e5500, and e6500 core based targets.
Enable JTAG diagnostics
When selected, the option enables performing
advanced diagnostics of the JTAG connection to
be used during custom board bring-up. After the
connection to the probe has been established the
debugger performs the JTAG diagnostics tests
(Power at probe, IR scan check, Bypass (DR)
scan check, Arbitrary TAP state move, IDCODE
scan check) and the result of the tests are printed
to the console log and in case of an error, a
Table continues on the next page...
CodeWarrior Development Studio for Power Architecture Processors Targeting Manual, Rev. 10.5.0,
06/2015
150
Freescale Semiconductor, Inc.
Chapter 5 Working with Debugger
Table 5-16. CodeWarrior TAP - Advanced Tab Options (continued)
Option
Description
CodeWarrior Alert box appears. When this option
is not selected, the CodeWarrior debugger only
performs a limited test while configuring the
JTAG chain. It checks if the PWR pin is correctly
connected and displays a Cable disconnected
error if not connected properly. The connection
details are provided in the CCS protocol log
along with the JTAG ID and in case of an error, a
CodeWarrior Alert box appears. See JTAG
diagnostics tests for more information on JTAG
diagnostics tests.
Secure debug key
Select to enable the debugger to unlock the
secured board with the secure debug key
provided in the associated text box. If this option
is not selected, you will receive a secure debug
violation error when you try to debug on the
locked board.
NOTE: If you provide a wrong key and an
unlock sequence is run by the debugger
with the erroneous key, the associated
part will be locked until a rest occurs
and you will need to reset the target to
connect again. For the P1010
processor, if you have one failed
attempt with a wrong key then a
subsequent unlock sequence with a
valid key will succeed. But, if you
provide a wrong key twice, you will need
to hard reset the board before the next
attempt.
Reset Delay (ms)
Specifies the time in milliseconds that
CodeWarrior takes to gain control of the target,
after issuing a reset. The default value for this
option is 200 ms. The delay needs to be
increased if the debugger connection does not
work reliably, after issuing the reset. This can
happen for specific boards and in scenarios
where the PBL is used to perform boot image
manipulation (for example, copying U-Boot from
SPI flash to internal cache/SRAM during reset)
that does not complete within the default reset
timeout window. A good start value to test out
board-specific requirements in such cases is
1000 ms; however, this value may need to be
increased for very large PBL transfers.
NOTE: Reset delay is supported for processors
based on the e500mc, e5500, and
e6500 cores.
CodeWarrior Development Studio for Power Architecture Processors Targeting Manual, Rev. 10.5.0,
06/2015
Freescale Semiconductor, Inc.
151
JTAG diagnostics tests
5.4 JTAG diagnostics tests
JTAG diagnostics tests are advanced diagnostics tests performed on the JTAG connection
to be used during custom board bring-up.
Once connection to the probe has been established, the debugger performs JTAG
diagnostics tests and prints the test results to the console log.
Five JTAG header pins (TDI, TDO, TMS, TCK, and TRST) are used in JTAG
diagnostics tests. Failing of any of these pins can generate errors. Other JTAG header
pins, such as HRESET are architecture-specific and not directly related to JTAG.
JTAG diagnostics tests available in CodeWarrior are:
•
•
•
•
•
Power at probe test
IR scan test
Bypass scan test
Arbitrary TAP state move test
Reading JTAG IDCODEs test
5.4.1 Power at probe test
This test checks if the PWR pin is correctly connected. If not, an error message, Error:
No target power detected, is displayed.
5.4.2 IR scan test
The IR scan test uses the TCK and TMS pins to move the target into the Shift-IR state,
and then sends a long test pattern through the IR by holding TMS=0, clocking TCK, and
feeding the test pattern bits in the TDI pin. It captures the bits coming out on the TDO
pin. If the connection is working correctly, the TDI bits pass through the IR shift register
(instruction register) and eventually show up on the TDO pin. The test compares the
TDO data it captures against the TDI test pattern it sent to see if TDO contains the test
pattern. It expects to find the test pattern in the TDO, but bit-shifted to the left by some
number of bits (corresponding to the IR length).
If it fails to find the test pattern, then the test reports an error, Error testing IR scan.
CodeWarrior Development Studio for Power Architecture Processors Targeting Manual, Rev. 10.5.0,
06/2015
152
Freescale Semiconductor, Inc.
Chapter 5 Working with Debugger
If the test fails to measure the length of the instruction register, then an error, Error
measuring IR length, is thrown.
The error might be due to one or more of the following reasons:
• TRST stuck low: This may hold the target JTAG logic in reset, preventing any shifts
to occur.
• TMS disconnected or stuck: This may prevent the target from making any JTAG
state changes.
• TCK disconnected or stuck: This may prevent any state changes or clocking of data.
• TDI disconnected or stuck: This may prevent the test pattern data from getting into
the target.
• TDO disconnected or stuck: This may prevent the test pattern data from getting out
of the target.
If the test fails, then it is possible that there is a physical connection problem with the
JTAG pins, or the JTAG frequency is too high.
5.4.3 Bypass scan test
The bypass scan test uses the TCK and TMS pins to move the target into the Shift-Bypass
state, and then sends a long test pattern through the data register (DR) by holding
TMS=0, clocking TCK, and feeding the test pattern bits in the TDI pin. It captures the
bits coming out on the TDO pin. If the connection is working correctly, the TDI bits pass
through the DR shift register and eventually show up on TDO. The test compares the
TDO data it captures against the TDI test pattern it sent to see if TDO contains the test
pattern. It expects to find the test pattern in the TDO, but bit-shifted to the left by some
number of bits (corresponding to the bypass length).
If the test fails to find the test pattern, then it reports an error, Error testing bypass scan.
If the test fails to measure the length of the data register, then an error, Error measuring
bypass length, is thrown.
The error might be due to one or more of the following reasons:
• TRST stuck low: This would hold the target JTAG logic in reset, preventing any
shifts to occur.
• TMS disconnected or stuck: This would prevent the target from making any JTAG
state changes.
• TCK disconnected or stuck: This would prevent any state changes or clocking of
data.
CodeWarrior Development Studio for Power Architecture Processors Targeting Manual, Rev. 10.5.0,
06/2015
Freescale Semiconductor, Inc.
153
Editing remote system configuration
• TDI disconnected or stuck: This would prevent the test pattern data from getting into
the target.
• TDO disconnected or stuck: This would prevent the test pattern data from getting out
of the target.
If the test fails, then it is possible that there is a physical connection problem with the
JTAG pins, or the JTAG frequency is too high.
5.4.4 Arbitrary TAP state move test
The arbitrary TAP state move test tries to exercise the TMS pin more rigorously than the
other tests. Usually, there is a little bit of TMS activity at the beginning and end of every
test, but this test keeps it toggling frequently during the entire test. If other tests are
passing and this test is failing, then it might be due to a signal integrity problem on the
TMS pin.
Errors may occur at the first TAP state move operation (Error performing first TAP state
move) or at the second TAP state move operation (Error performing second TAP state
move), or the IR scan operation may fail after performing the state move operations
(Error on IR scan after state moves).
5.4.5 Reading JTAG IDCODEs test
This test scans all JTAG IDCODEs on the JTAG chain and displays the detected JTAG
IDCODEs. If the test fails, then an error, Failed to scan the JTAG IDCODEs on the
chain, is displayed.
The method used to scan the IDCODEs depends on a feature that is recommended by the
JTAG standard, but is not mandatory. It works on most parts, but not on all parts. If the
JTAG chain has a part (provided by Freescale or third party) that does not implement the
recommended behavior, then the test results might be wrong and misleading, and
confirming the successful completion of the test will be difficult.
5.5 Editing remote system configuration
CodeWarrior Development Studio for Power Architecture Processors Targeting Manual, Rev. 10.5.0,
06/2015
154
Freescale Semiconductor, Inc.
Chapter 5 Working with Debugger
The remote system configuration model defines the connection and system configurations
where you can define a single system configuration that can be referred to by multiple
connection configurations.
To edit the system configuration, perform these steps:
1. Select Run > Debug Configurations.
The Debug Configurations dialog box appears.
2. In the Connection panel, click Edit next to the Connection drop-down list.
The Properties for <connection launch configuration> window appears.
3. Click Edit next to the Target drop-down list.
The Properties for <system launch configuration> window appears.
4.
5.
6.
7.
Select the appropriate system type from the Target type drop-down list.
Make the respective settings in Initialization tab, Memory tab and Advanced tab.
Click OK to save the settings.
Click OK to close the Properties window.
In this section:
• Initialization tab
• Memory tab
• Advanced tab
5.5.1 Initialization tab
Use the Initialization tab to specify target initialization file for various cores.
CodeWarrior Development Studio for Power Architecture Processors Targeting Manual, Rev. 10.5.0,
06/2015
Freescale Semiconductor, Inc.
155
Editing remote system configuration
Figure 5-1. USB TAP connection type - Initialization tab
The table below lists the various options available on the Initialization tab page.
Table 5-17. Initialization tab options
Option
Description
Execute Target reset
Select to execute target system reset.
Core reset
Select to include the respective core for core reset operation.
Run out of reset
Select to include the respective core for run out of reset operation.
Initialize target
Click to specify a target initialization file for the respective core.
Initialize target script
Lists the path to a Debugger Shell Tcl script that runs when launching a debug session
for the respective core. To edit, select a cell, then click the ellipsis (...) button to open
the Target InitializationFile dialog box. The settings for a group of cores can be
changed all at once by editing the cell of a common ancestor node in the Target
hierarchy.
5.5.2 Memory tab
Use the Memory tab to specify memory configuration file for various cores.
CodeWarrior Development Studio for Power Architecture Processors Targeting Manual, Rev. 10.5.0,
06/2015
156
Freescale Semiconductor, Inc.
Chapter 5 Working with Debugger
Figure 5-2. USB TAP connection type - Memory tab
Figure 5-3. Memory tab
The table below lists the various options available on the Memory tab page.
Table 5-18. Memory tab options
Option
Description
Target
Lists the targets and the supported cores.
Memory configuration
Select to specify a memory configuration file for the respective core.
Memory configuration file
Lists the path to the memory configuration file for the respective core. To edit, select a
cell, then click the ellipsis button to open the Memory Configuration File dialog box.
The settings for a group of cores can be changed all at once by editing the cell of a
common ancestor node in the Target hierarchy.
CodeWarrior Development Studio for Power Architecture Processors Targeting Manual, Rev. 10.5.0,
06/2015
Freescale Semiconductor, Inc.
157
Memory translations
5.5.3 Advanced tab
Use the Advanced tab to specify that Palladium is used to emulate the target.
Figure 5-4. USB TAP connection type - Advanced tab
5.6 Memory translations
This section tells how to inform the CodeWarrior debugger about the Memory
Management Unit (MMU) translations.
When debugging a Linux kernel, the debugger is automatically aware of the memory
translations.
When debugging a bareboard system, there are two mutually exclusive ways of
informing the debugger about memory translations:
• A memory configuration file containing translate directives can be used to instruct
the debugger about memory translations. These translations are considered to be
static for the duration of the debug session.
• The debugger can actively monitor the target MMU and read the currently active
translations. This MMU awareness feature is activated only if there are no translate
directives defined in the memory configuration file (or no such file is specified).
CodeWarrior Development Studio for Power Architecture Processors Targeting Manual, Rev. 10.5.0,
06/2015
158
Freescale Semiconductor, Inc.
Chapter 5 Working with Debugger
NOTE
The MMU awareness for bareboard is supported only for
processors based on e500v2, e500mc, e5500, and e6500
cores.
Choose one of the two alternatives based on processor support (see Note above), the type
of application being debugged (whether the translations are static or can change
dynamically at runtime), and performance (note that constantly reading the MMU from
the target can have a certain performance penalty on the debugger operation).
NOTE
Stationary projects in CodeWarrior are pre-configured to use a
memory configuration file. To enable the debugger MMU
awareness, you need to remove the translate directives from the
memory configuration file for processors that support this
feature (e500v2, e500mc, e5500, and e6500 cores).
36-Bit Physical Address Support
In general, a 32-bit processor core (including e500v2 and e500mc) has virtual memory
support for 232 bytes of effective address space and real memory support for 236 bytes of
physical address space. Therefore, only the physical address space is 36-bit wide;
whereas the effective address space remains 32-bit wide.
The processor executes in the effective address space. Therefore, to have the processor
use the entire 36-bit physical address space, you need to configure the MMU to translate
32-bit effective addresses to 36-bit real addresses.
When debugging a bareboard system, you can either use a memory configuration file to
instruct the debugger about non 1:1 MMU translations, or let the debugger read the
MMU translations automatically from the target.
Tip
A memory configuration file must not be related directly/only
to the 36-bit addressing features.
For more information on memory configuration files, see the Memory Configuration
Files chapter.
5.7 CodeWarrior Command-Line Debugger
CodeWarrior Development Studio for Power Architecture Processors Targeting Manual, Rev. 10.5.0,
06/2015
Freescale Semiconductor, Inc.
159
CodeWarrior Command-Line Debugger
CodeWarrior supports a command-line interface that you can use to interact with
CodeWarrior debugger, by issuing commands.
You can use the command-line interface together with various scripting engines, such as
the Microsoft® Visual Basic® script engine, the Java™ script engine, TCL, Python, and
Perl. You can even issue a command that saves your command-line activity to a log file.
You use the Debugger Shell view to issue command lines to the IDE. For example, you
enter the command debug in this window to start a debugging session. The window
displays the standard output and standard error streams of command-line activity.
To open the Debugger Shell view, follow these steps:
1. Switch the IDE to the Debug perspective and start a debugging session.
2. Select Window > Show View > Other.
The Show View dialog box appears.
3. Expand the Debug group.
4. Select Debugger Shell.
5. Click OK.
The Debugger Shell view appears in the view stack at the bottom of the IDE.
To issue a command-line command, type the desired command at the command prompt
(%>) in the Debugger Shell view, then press Enter or Return. The command-line
debugger executes the specified command.
NOTE
To display a list of the commands the command-line debugger
supports, type help at the command prompt and press Enter.
The help command lists each supported command along with a
brief description of each command.
CodeWarrior Development Studio for Power Architecture Processors Targeting Manual, Rev. 10.5.0,
06/2015
160
Freescale Semiconductor, Inc.
Chapter 5 Working with Debugger
Figure 5-5. Debugger Shell View
If you work with hardware as part of your project, you can use the command-line
debugger to issue commands to the debugger while the hardware is running.
Tip
To view page-wise listing of the debugger shell commands,
right-click in the Debugger Shell view and select Paging from
the context menu. Alternatively, click the Enable Paging icon
from the view toolbar.
The table below lists the instructions for common command-line debugging tasks.
Table 5-19. Common Command-Line Debugging Tasks
Task
Instruction
Comments
Select Windows > Show View > Other
> Debugger Shell
The Debugger Shell view appears.
Use the help command
1. On the Debugger shell command
prompt (%>), type help.
2. Press Enter key.
The command list for CodeWarrior
appears.
Enter a command.
1. On the Debugger shell, type a
command followed by a space.
2. Type any valid command-line
options, separating each with a
space.
3. Press Enter key.
You can use shortcuts instead of
complete command names, such as k
for kill.
Open the Debugger Shell view
View debug command hints.
Type alias followed by a space.
The syntax for the rest of the command
appears.
Table continues on the next page...
CodeWarrior Development Studio for Power Architecture Processors Targeting Manual, Rev. 10.5.0,
06/2015
Freescale Semiconductor, Inc.
161
Working with Breakpoints
Table 5-19. Common Command-Line Debugging Tasks (continued)
Task
Instruction
Review previous commands.
Comments
Press Up Arrow and Down Arrow keys.
Clear command from the command line. Press the Esc key.
Stop an executing script.
Press the Esc key.
Toggle between insert/overwrite mode.
Press the Insert key.
Scroll up/ down a page.
Press Page Up or Page Down key.
Scroll left/right one column.
Press Ctrl+Left Arrow or Ctrl+Right
Arrow keys.
Scroll to beginning or end of buffer.
Press Ctrl+Home or Ctrl+End keys.
5.8 Working with Breakpoints
A breakpoint is set on an executable line of a program; if the breakpoint is enabled when
you debug, the execution suspends before that line of code executes.
The different breakpoint types that you can set are listed below:
• Software breakpoints: The debugger sets a software breakpoint into target memory.
When program execution reaches the breakpoint, the processor stops and activates
the debugger. The breakpoint remains in the target memory until the user removes it.
The breakpoint can only be set in writable memory, such as SRAM or DDR. You
cannot use this type of breakpoints in ROM.
• Hardware breakpoints: Selecting the Hardware menu option causes the debugger to
use the internal processor breakpoints. These breakpoints are usually very few and
can be used with all types of memories (ROM/RAM) because they are implemented
by using processor registers.
Tip
You can also set breakpoint types by issuing the bp
command in the Debugger Shell view.
In this section:
•
•
•
•
Setting Breakpoints
Setting Hardware Breakpoints
Removing Breakpoints
Removing Hardware Breakpoints
CodeWarrior Development Studio for Power Architecture Processors Targeting Manual, Rev. 10.5.0,
06/2015
162
Freescale Semiconductor, Inc.
Chapter 5 Working with Debugger
5.8.1 Setting Breakpoints
This section explains how to set breakpoints within a program in CodeWarrior IDE.
To set a breakpoint, perform the following steps:
1. Switch to the Debug perspective in CodeWarrior IDE.
2. Open the Debug view if it is not already open by selecting Window > Show View >
Debug.
The Debug view appears, shown in the figure below.
Figure 5-6. Debug View
3. Expand the Thread group.
4. Under the Thread group, select the thread that has the main() function.
The source code appears in the Editor view (shown in the figure below). The small
blue arrow to the left of the source code indicates which code statement the
processor's program counter is set to execute next.
CodeWarrior Development Studio for Power Architecture Processors Targeting Manual, Rev. 10.5.0,
06/2015
Freescale Semiconductor, Inc.
163
Working with Breakpoints
Figure 5-7. Editor View
5. In the Editor view, place the cursor on the line that has this statement: printf("Welcome
to CodeWarrior!\r\n");
6. Select Run > Toggle Line Breakpoint.
A blue dot appears in the marker bar to the left of the line (shown in the figure
below). This dot indicates an enabled breakpoint. After the debugger installs the
breakpoint, a blue checkmark appears beside the dot. The debugger installs a
breakpoint by loading into the Java™ virtual machine the code in which you set that
breakpoint.
Tip
An alternate way to set a breakpoint is to double-click the
marker bar to the left of any source-code line. If you set the
breakpoint on a line that does not have an executable
statement, the debugger moves the breakpoint to the closest
subsequent line that has an executable statement. The
marker bar shows the installed breakpoint location. If you
want to set a hardware breakpoint instead of a software
breakpoint, use the bp command in the Debugger Shell
view. You can also right-click on the marker bar to the left
of any source-code line, and select Set Special Breakpoint
from the context menu that appears.
CodeWarrior Development Studio for Power Architecture Processors Targeting Manual, Rev. 10.5.0,
06/2015
164
Freescale Semiconductor, Inc.
Chapter 5 Working with Debugger
Figure 5-8. Editor View - After Setting Breakpoints
7. From the menu bar, select Run > Resume.
The debugger executes all lines up to, but not including, the line at which you set the
breakpoint. The editor view highlights the line at which the debugger suspended
execution (shown in the figure below). Note also that the program counter (blue
arrow) is positioned here.
Figure 5-9. Editor Vie w - After Reaching a Breakpoint
5.8.2 Setting Hardware Breakpoints
This section explains how to set hardware breakpoints within a program in CodeWarrior
IDE.
CodeWarrior Development Studio for Power Architecture Processors Targeting Manual, Rev. 10.5.0,
06/2015
Freescale Semiconductor, Inc.
165
Working with Breakpoints
There are two ways to set hardware breakpoints:
• Using IDE to Set Hardware Breakpoints
• Using Debugger Shell to Set Hardware Breakpoints
5.8.2.1 Using IDE to Set Hardware Breakpoints
To set a hardware breakpoint using the IDE, follow these steps:
1. In the CodeWarrior IDE, select Run > Breakpoint Types > C/C++ Hardware
Breakpoints.
2. In the Editor view, click in the source line where you want to place the breakpoint.
3. Select Run > Toggle Breakpoint.
A hardware breakpoint appears in the marker bar on the left side of the source line.
5.8.2.2 Using Debugger Shell to Set Hardware Breakpoints
You can use the Debugger Shell view to set hardware breakpoints. Follow these steps to
set a hardware breakpoint using the Debugger Shell view:
1. Open the Debugger Shell view.
2. Begin the command line with the text:
bp -hw
3. Complete the command line by specifying the function, address, or file at which you
want to set the hardware breakpoint.
For example, to set a breakpoint for line 6 in your program, type:
bp -hw 6
4. Press the Enter key.
The debugger shell executes the command and sets the hardware breakpoint.
Tip
Enter help bp at the command-line prompt to see examples
of the bp command syntax and usage.
CodeWarrior Development Studio for Power Architecture Processors Targeting Manual, Rev. 10.5.0,
06/2015
166
Freescale Semiconductor, Inc.
Chapter 5 Working with Debugger
5.8.3 Removing Breakpoints
This section explains how to remove breakpoints from a program in CodeWarrior IDE.
To remove a breakpoint from your program, you have two options:
• Remove Breakpoints using Marker Bar
• Remove Breakpoints using Breakpoints View
5.8.3.1 Remove Breakpoints using Marker Bar
To remove an existing breakpoint using the marker bar, follow these steps:
1. Right-click the breakpoint in the marker bar.
2. Select Toggle Breakpoint from the menu that appears.
5.8.3.2 Remove Breakpoints using Breakpoints View
To remove an existing breakpoint using the Breakpoints view, follow these steps:
1. Open the Breakpoints view if it is not already open by selecting Window > Show
View > Breakpoints.
The Breakpoints view appears, displaying a list of breakpoints.
2. Right-click on the breakpoint you wish to remove and select Remove from the menu
that appears.
The selected breakpoint is removed, and it disappears from the both the marker bar
and the list in the view.
NOTE
To remove all of the breakpoints from the program at once,
select Remove All from the menu.
5.8.4 Removing Hardware Breakpoints
CodeWarrior Development Studio for Power Architecture Processors Targeting Manual, Rev. 10.5.0,
06/2015
Freescale Semiconductor, Inc.
167
Working with Breakpoints
This section explains how to remove hardware breakpoints from a program in
CodeWarrior IDE.
There are two ways to remove existing hardware breakpoints:
• Remove Hardware Breakpoints using the IDE
• Remove Hardware Breakpoints using Debugger Shell
5.8.4.1 Remove Hardware Breakpoints using the IDE
To remove a hardware breakpoint, follow these steps:
1. Right-click on the existing breakpoint in the marker bar.
2. Select Toggle Breakpoint from the menu that appears.
Alternatively, you can remove the breakpoint from the Breakpoints view, using the
following steps:
1. Open the Breakpoints view if it is not already open by choosing Window > Show
View > Breakpoints.
The Breakpoints view appears, displaying a list of breakpoints.
2. Right-click on the hardware breakpoint you wish to remove and select Remove from
the menu that appears.
The selected breakpoint is removed, and it disappears from the both the marker bar
and the list in the view.
5.8.4.2 Remove Hardware Breakpoints using Debugger Shell
To remove a hardware breakpoint using the Debugger Shell view, follow these steps:
1. Open the debugger shell.
2. Begin the command line with the text:
bp -hw
3. Complete the command line by specifying the function, address, or file at which you
want to remove the hardware breakpoint.
For example, to remove a breakpoint at line 6 in your program, type:
bp -hw 6 off
CodeWarrior Development Studio for Power Architecture Processors Targeting Manual, Rev. 10.5.0,
06/2015
168
Freescale Semiconductor, Inc.
Chapter 5 Working with Debugger
4. Press the Enter key.
The debugger shell executes the command and removes the hardware breakpoint.
5.9 Working with Watchpoints
A watchpoint is another name for a data breakpoint that you can set on an address or a
range of addresses in the memory.
The debugger halts execution each time the watchpoint location is read, written, or
accessed (read or written). You can set a watchpoint using the Add Watchpoint dialog
box. To open the Add Watchpoint dialog box, use one of the following views:
• Breakpoints view
• Memory view
• Variables view
The debugger handles both watchpoints and breakpoints in similar manners. You can use
the Breakpoints view to manage both watchpoints and breakpoints. It means, you can
use the Breakpoints view to add, remove, enable, and disable both watchpoints and
breakpoints. The debugger attempts to set the watchpoint if a session is in progress based
on the active debugging context (the active context is the selected project in the Debug
view).
If the debugger sets the watchpoint when no debugging session is in progress, or when restarting a debugging session, the debugger attempts to set the watchpoint at startup as it
does for breakpoints. The Problems view displays error messages when the debugger
fails to set a watchpoint. For example, if you set watchpoints on overlapping memory
ranges, or if a watchpoint falls out of execution scope, an error message appears in the
Problems view. You can use this view to see additional information about the error.
The following sections explain how to set or remove watchpoints:
• Setting Watchpoints
• Removing Watchpoints
5.9.1 Setting Watchpoints
CodeWarrior Development Studio for Power Architecture Processors Targeting Manual, Rev. 10.5.0,
06/2015
Freescale Semiconductor, Inc.
169
Working with Watchpoints
Use the Add Watchpoint dialog box to create a watchpoint for a memory range. You can
specify these parameters for a watchpoint:
•
•
•
•
An address (including memory space)
An expression that evaluates to an address
A memory range
An access type on which to trigger
To open the Add Watchpoint dialog box, follow these steps:
1. Open the Debug perspective.
2. Click one of these tabs:
• Breakpoints
• Memory
• Variables
The corresponding view appears.
3. Right-click the appropriate content inside the view as mentioned in the table below.
Table 5-20. Opening the Add Watchpoint dialog
box
In the View...
Right-Click...
Breakpoints
An empty area inside the view.
Memory
The cell or range of cells on which you want to set the watchpoint.
Variables
A global variable.
NOTE
The debugger does not support setting a watchpoint on a
stack variable or a register variable.
4. Select Add Watchpoint (C/C++) from the context menu that appears.
The Add Watchpoint dialog box appears (shown in the figure below). The debugger
sets the watchpoint according to the settings that you specify in the Add Watchpoint
dialog box. The Breakpoints view shows information about the newly set
watchpoint. The Problems view shows error messages when the debugger fails to set
the watchpoint.
CodeWarrior Development Studio for Power Architecture Processors Targeting Manual, Rev. 10.5.0,
06/2015
170
Freescale Semiconductor, Inc.
Chapter 5 Working with Debugger
Figure 5-10. Add Watchpoint Dialog Box
The table below describes the options available in the Add Watchpoint dialog box.
Table 5-21. Add Watchpoint dialog box options
Option
Expression to watch
Description
Enter an expression that evaluates to an address on the target device. When the
specified expression evaluates to an invalid address, the debugger halts execution and
displays an error message. You can enter these types of expressions:
• An r-value, such as &variable
• A register-based expression. Use the $ character to denote register names. For
example, enter $SP-12 to have the debugger set a watchpoint on the stack
pointer address minus 12 bytes.
The Add Watchpoint dialog box does not support entering expressions that evaluate
to registers.
Memory space
Select this option to specify an address, including memory space, at which to set the
watchpoint. Use the text box to specify the address or address range on which to set
the watchpoint. If a debugging session is not active, the text/list box is empty, but you
can still type an address or address range.
Units
Enter the number of addressable units that the watchpoint monitors.
Write
Select this option to enable the watchpoint to monitor write activity on the specified
memory space and address range. Clear this option if you do not want the watchpoint
to monitor write activity.
Read
Select this option to enable the watchpoint to monitor read activity on the specified
memory space and address range. Clear this option if you do not want the watchpoint
to monitor read activity.
5.9.2 Removing Watchpoints
To remove a watchpoint, perform these steps:
CodeWarrior Development Studio for Power Architecture Processors Targeting Manual, Rev. 10.5.0,
06/2015
Freescale Semiconductor, Inc.
171
Working with Registers
1. Open the Breakpoints view if it is not already open by selecting Window > Show
View > Breakpoints.
The Breakpoints view appears, displaying a list of watchpoints.
2. Right-click on the watchpoint you wish to remove and select Remove from the menu
that appears.
The selected watchpoint is removed, and it disappears from the list in the
Breakpoints view.
5.10 Working with Registers
Use the Registers view to display and modify the contents of the registers of the
processor on your target board.
To display the Registers view, select Window > Show View > Other > Debug >
Registers. The Registers view appears (shown in the figure below). The default state of
the Registers view provides details on the processor's registers.
The Registers view displays categories of registers in a tree format. To display the
contents of a particular category of registers, expand the tree element of the register
category of interest. The figure below shows the Registers view with the General
Purpose Registers tree element expanded.
Tip
You can also view and update registers by issuing the reg,
change, and display commands in the Debugger Shell view.
CodeWarrior Development Studio for Power Architecture Processors Targeting Manual, Rev. 10.5.0,
06/2015
172
Freescale Semiconductor, Inc.
Chapter 5 Working with Debugger
Figure 5-11. Registers View
In this section:
•
•
•
•
•
•
Changing Bit Value of a Register
Viewing Register Details
Registers View Context Menu
Working with Register Groups
Working with TLB Registers
Working with IMMR
5.10.1 Changing Bit Value of a Register
You can change the bit value of a register in the Registers view.
To change a bit value in a register, first switch the IDE to the Debug perspective and start
a debugging session. Then proceed as follows:
1. Open the Registers view by selecting Window > Show View > Other > Debug >
Registers.
2. In the Registers view, expand the register group that contains the register with the bit
value that you want to change.
3. Click the register's current bit value in the view's Value column.
The value becomes editable.
4. Type in the new value.
5. Press the Enter key.
CodeWarrior Development Studio for Power Architecture Processors Targeting Manual, Rev. 10.5.0,
06/2015
Freescale Semiconductor, Inc.
173
Working with Registers
The debugger updates the bit value. The bit value in the Value column changes to
reflect your modification.
5.10.2 Viewing Register Details
This section explains how to use the Registers view to show the details of a register.
To open the Registers view, you must first start a debugging session.
To see the registers and their descriptions, follow these steps:
1. In the Debug perspective, click the Registers view tab.
The Registers view appears.
2. Click the View Menu button (the inverted triangle) on the Registers view toolbar.
3. Select Layout > Vertical or Layout > Horizontal to show register details.
NOTE
Selecting Layout > Registers View Only hides the register
details.
The details of the register, selected by default in the Registers view, are displayed, as
shown in the figure below.
Figure 5-12. Registers View - Register Details
4. Expand a register group to see individual registers.
5. Select a specific register by clicking it.
CodeWarrior Development Studio for Power Architecture Processors Targeting Manual, Rev. 10.5.0,
06/2015
174
Freescale Semiconductor, Inc.
Chapter 5 Working with Debugger
The details of the selected register get displayed.
NOTE
Use the Format list box to change the format of data
displayed for the selected register.
6. Examine register details. For example,
• Use the Bit Fields group to see a graphical representation of the selected
register's bit fields. You can use this graphical representation to select specific
bits or bit fields.
• Use the Actions group to perform operations, such as update bit field values and
format the displayed register data.
• Use the Description group to see an explanation of the selected register, bit
field, or bit value.
Tip
To enlarge the Registers view, click Maximize on the
view's toolbar. After you finish looking at the register
details, click Restore on the view's toolbar to return the
view to its previous size. Alternatively, right-click the
Registers tab and select Detached. The Registers view
becomes a floating window that you can resize. After you
finish looking at the register details, right-click the
Registers tab of the floating window and select Detached
again. You can rearrange the re-attached view by dragging
its tab to a different collection of view tabs.
In this section:
•
•
•
•
Bit Fields
Changing Bit Fields
Actions
Description
5.10.2.1 Bit Fields
The Bit Fields group of the Registers view (see the figure below) shows a graphical
representation of the selected register's bit values. This graphical representation shows
how the register organizes bits. You can use this representation to select and change the
register's bit values. Hover the cursor over each part of the graphical representation to see
additional information.
CodeWarrior Development Studio for Power Architecture Processors Targeting Manual, Rev. 10.5.0,
06/2015
Freescale Semiconductor, Inc.
175
Working with Registers
Figure 5-13. Register Details - Bit Fields Group
Tip
You can also view register details by issuing the reg command
in the Debugger Shell view.
A bit field is either a single bit or a collection of bits within a register. Each bit field has a
mnemonic name that identifies it. You can use the Field list box to view and select a
particular bit field of the selected register. The list box shows the mnemonic name and
bit-value range of each bit field. In the Bit Fields graphical representation, a box
surrounds each bit field. A red box surrounds the bit field shown in the Field list box.
After you use the Field list box to select a particular bit field, you see its current value in
the = text box. If you change the value shown in the text box, the Registers view shows
the new bit field value.
5.10.2.2 Changing Bit Fields
To change a bit field in a register, you must first start a debugging session, and then open
the Registers view.
To change a bit field, perform these steps:
1. In the Registers view, view register details.
2. Expand the register group that contains the bit field you want to change.
Register details appear in the Registers view (shown in the figure below).
CodeWarrior Development Studio for Power Architecture Processors Targeting Manual, Rev. 10.5.0,
06/2015
176
Freescale Semiconductor, Inc.
Chapter 5 Working with Debugger
Figure 5-14. Registers View - Register Details
3. From the expanded register group above the register details, select the name of the
register that contains the bit field that you want to change.
The Bit Fields group displays a graphical representation of the selected bit field. The
Description group displays explanatory information about the selected bit field and
parent register.
4. In the Bit Fields group, click the bit field that you want to change. Alternatively, use
the Field list box to specify the bit field that you want to change.
5. In the = text box, type the new value that you want to assign to the bit field.
6. In the Action group, click Write.
The debugger updates the bit field value. The bit values in the Value column and the
Bit Fields group change to reflect your modification.
NOTE
Click Revert to discard your changes and restore the
original bit field value.
5.10.2.3 Actions
CodeWarrior Development Studio for Power Architecture Processors Targeting Manual, Rev. 10.5.0,
06/2015
Freescale Semiconductor, Inc.
177
Working with Registers
Use the Actions group of the Registers view (see the figure below) to perform various
operations on the selected register's bit field values.
Figure 5-15. Register View - Actions Group
The table below lists each item in the Actions group and explains the purpose of each.
Table 5-22. Actions Group Items
Item
Description
Revert
Discard your changes to the current bit field value and restore the original value. The
debugger disables this button if you have not made any changes to the bit field value.
Write
Save your changes to the current bit field value and write those changes into the
register's bit field. The debugger disables this button after writing the new bit field
value, or if you have not made any changes to that value.
Reset
Change each bit of the bit field value to its register-reset value. The register takes on
this value after a target-device reset occurs. To confirm the bit field change, click Write.
To cancel the change, click Revert.
Summary
Display Description group content in a pop-up window. Press the Esc key to close the
pop-up window.
Format
Specify the data format of the displayed bit field values.
5.10.2.4 Description
The Description group of the Registers view (see the figure below) shows explanatory
information for the selected register.
Figure 5-16. Register View - Description Group
The register information covers:
• Current value
CodeWarrior Development Studio for Power Architecture Processors Targeting Manual, Rev. 10.5.0,
06/2015
178
Freescale Semiconductor, Inc.
Chapter 5 Working with Debugger
• Description
• Bit field explanations and values
Some registers have multiple modes (meaning that the register's bits can have multiple
meanings, depending on the current mode). If the register you examine has multiple
modes, you must select the appropriate mode.
5.10.3 Registers View Context Menu
The Registers view context menu provides you various options for working with
registers.
To display the Registers view context menu, right-click a register in the Registers view.
The table below lists the options of the Registers view context menu.
Table 5-23. Registers View Context Menu Options
Option
Description
Select All
Selects the entire contents of the current register.
Copy Registers
Copies to the system clipboard the contents of the selected register.
Enable
Allows the debugger to access the selected register.
Disable
Prevents the debugger from accessing the selected register.
View Memory
Displays the corresponding memory for the selected register.
Format
Use to specify the displayed data format for the selected register:
• Natural: Default data format
• Decimal: Decimal data format
• Hexadecimal: Hexadecimal data format
• Binary: Binary data format
• Fractional: Fractional data formats, Q0-Q31
Cast to Type
Opens a dialog box that you can use to cast the selected register value to a different
data type.
Restore Original Type
Reverts the selected register value to its default data type.
Find
Opens a dialog box that you can use to select a particular register.
Change Value
Opens a dialog box that you can use to change the current register value.
Show Details As
Allows you to specify how the debugger displays the register's contents. The options
are:
• Default Viewer: The register's contents are displayed as a hexadecimal value.
• Register Details Panel: The register's values are display in a bit format, along
with a description of their purpose.
Add Register Group
Opens a dialog box that you can use to create a new collection of registers to display in
the Registers view.
Restore Default Register Groups
Resets the custom groups of registers created using the Add Register Group option,
and restores the default groups provided by the debugger as they were when
Table continues on the next page...
CodeWarrior Development Studio for Power Architecture Processors Targeting Manual, Rev. 10.5.0,
06/2015
Freescale Semiconductor, Inc.
179
Working with Registers
Table 5-23. Registers View Context Menu Options (continued)
Option
Description
CodeWarrior was installed. Note that if you select this option, all custom groupings of
registers done by you are lost.
Add Watchpoint (C/C++)
Opens the Add Watchpoint dialog box, proposing to set a watchpoint on an
expression representing the register. The debugger sets the watchpoint according to
the settings that you specify in the Add Watchpoint dialog box. The Breakpoints view
shows information about the newly set watchpoint. The Problems view shows error
messages when the debugger fails to set the watchpoint.
Watch
Adds a new watch-expression entry to the Expressions view.
5.10.4 Working with Register Groups
This section describes different operations that can be performed on register groups.
You can perform the following operations on the register groups:
• Adding a Register Group
• Editing a Register Group
• Removing a Register Group
5.10.4.1 Adding a Register Group
The default display of the Registers view groups related registers into a tree structure.
You can add a custom group of registers to the default register tree structure.
To add a new register group, perform these steps:
1. Right-click in the Registers view.
A context menu appears.
2. Select Add Register Group from the context menu.
The Register Group dialog box appears, as shown in the figure below.
CodeWarrior Development Studio for Power Architecture Processors Targeting Manual, Rev. 10.5.0,
06/2015
180
Freescale Semiconductor, Inc.
Chapter 5 Working with Debugger
Figure 5-17. Register Group Dialog Box
3. Enter in the Group Name text box a descriptive name for the new group.
4. Select the checkbox next to each register you want to appear in the new group.
Tip
Click Select All to check all of the checkboxes. Click
Deselect All to clear all of the checkboxes.
5. Click OK.
The Register Group dialog box closes. The new group name appears in the
Registers view.
5.10.4.2 Editing a Register Group
In the Registers view, you can edit both the default register groups and the groups that
you add.
To do so, use the following steps:
1. In the Registers view, right-click the name of the register group you want to edit.
CodeWarrior Development Studio for Power Architecture Processors Targeting Manual, Rev. 10.5.0,
06/2015
Freescale Semiconductor, Inc.
181
Working with Registers
A context menu appears.
2. Select Edit Register Group from the context menu.
The Register Group dialog box appears.
3. If you wish, enter in the Group Name text box a new name for the group.
4. Check the checkbox next to each register you want to appear in the group.
Tip
Click Select All to check all of the checkboxes. Click
Deselect All to clear all of the checkboxes.
5. Click OK.
The Register Group dialog box closes. The new group name appears in the
Registers view.
5.10.4.3 Removing a Register Group
In the Registers view, you can remove register groups.
To remove a register group, follow these steps:
1. In the Registers view, right-click the name of register group that you wish to
remove.
A context menu appears.
2. Select Remove Register Group from the context menu.
The selected register group disappears from the Registers view.
5.10.5 Working with TLB Registers
This section explains how to work with translation look-aside buffer (TLB) registers.
TLB registers can be classified into the following three categories:
• TLB0: A 256-entry, 2-way (e500v1) or 512-entry, 4-way (e500v2, e500mc, e5500)
or 1024-entry, 8-way (e6500) set-associative unified (for instruction and data
accesses) array supporting only 4 KB pages.
CodeWarrior Development Studio for Power Architecture Processors Targeting Manual, Rev. 10.5.0,
06/2015
182
Freescale Semiconductor, Inc.
Chapter 5 Working with Debugger
• TLB1: A 16-entry (e500v1, e500v2) or 64-entry (e500mc, e5500, e6500) fullyassociative unified (for instruction and data accesses) array supporting a range of
variable-sized pages (VSP) page sizes.
• Real Address Translation (LRAT): An 8-element, fully associative array. LRAT
registers are available only for e6500 core.
In this section:
•
•
•
•
Viewing TLB Registers in Registers View
Reading TLB Registers from Debugger Shell
Initializing TLB Registers
TLB Register Details
5.10.5.1 Viewing TLB Registers in Registers View
This section explains how to find TLB registers using the Registers view.
To view TLB registers in the Registers view, follow these steps:
1. Start the CodeWarrior IDE.
2. Open (or create) a project that targets the Power Architecture system you want to
debug.
3. From the CodeWarrior IDE menu bar, select Run > Debug.
The IDE starts a debug session, connects to the target system, and halts the system at
the program entry point.
4. Select Window > Show View > Registers.
The Registers view appears, as shown in the figure below.
CodeWarrior Development Studio for Power Architecture Processors Targeting Manual, Rev. 10.5.0,
06/2015
Freescale Semiconductor, Inc.
183
Working with Registers
Figure 5-18. Registers View - TLB Register Groups Displayed
The Registers view shows all registers supported by the target system. The Registers
view groups all regPPCTLB0 registers and regPPCTLB1 registers in the separate groups (see the
figure above).
To view all of the elements of a TLB register group, double-click the group you want to
view. A window appears that displays all of the elements of the selected TLB.
This window shows all of the TLB registers, and their contents. To modify TLB registers
during a CodeWarrior debug session, select the TLB register you want to modify from
the Registers view, as shown in the figure below.
CodeWarrior Development Studio for Power Architecture Processors Targeting Manual, Rev. 10.5.0,
06/2015
184
Freescale Semiconductor, Inc.
Chapter 5 Working with Debugger
Figure 5-19. Registers View
This window allows you to view register contents in different formats, and change
portions of the selected register.
5.10.5.2 Reading TLB Registers from Debugger Shell
This section explains how to read TLB registers from the Debugger Shell view.
CodeWarrior Development Studio for Power Architecture Processors Targeting Manual, Rev. 10.5.0,
06/2015
Freescale Semiconductor, Inc.
185
Working with Registers
TLB registers are very complex, so to easily understand TLB register information, the
information should be provided in a format that is easy to read and understand. The
Debugger Shell command, displaytlb, extracts the meaningful information about a TLB
register set and presents it in an easy to understand format. This command outputs only
valid entries from the TLB register set. The displaytlb command is very useful when
debugging a Linux kernel.
The syntax of the displaytlb command is as follows:
displaytlb [TLBSetNumber] ?[printInvalid]?
The command arguments are explained below:
• TLBSetNumber: Indicates a number representing the TLB register set that the user
wants to print. Each value for this argument corresponds to one TLB register set
displayed in the Registers view. The table below shows all the values taken by the
TLBSetNumber argument.
Table 5-24. TLBSetNumber
Values
TLBSetNumber Value
TLB Register Set Name
0
regPPCTLB0
1
regPPCTLB1
2
LRAT (available only for e6500 core)
• printInvalid: Determines whether only valid TLB register set entries will get
displayed or all entries will get displayed. It is an optional argument. If no value is
given to this argument, it takes the value, 0, which means only valid TLB register set
entries will be displayed in the output. If a non-zero value is given to this argument,
then all the TLB register set entries will get displayed in the output.
To use the displaytlb command, perform the following steps:
1. From the CodeWarrior IDE menu bar, select Window > Show View > Other.
The Show View dialog box appears.
2. Expand the Debug group.
3. Select Debugger Shell.
4. Click OK.
The Debugger Shell view appears in the view stack at the bottom of the IDE.
5. In the Debugger Shell view, run the following command:
displaytlb 1
The command output is shown in the figure below.
CodeWarrior Development Studio for Power Architecture Processors Targeting Manual, Rev. 10.5.0,
06/2015
186
Freescale Semiconductor, Inc.
Chapter 5 Working with Debugger
Figure 5-20. Output of Running the displaytlb 1 Command for P2040DS
5.10.5.3 Initializing TLB Registers
This section describes how to initialize TLB registers using commands.
You can use reg, writereg128/writereg192 commands in the debugger initialization files to
set up TLB registers at target system startup. For more details, see writereg128.
CodeWarrior Development Studio for Power Architecture Processors Targeting Manual, Rev. 10.5.0,
06/2015
Freescale Semiconductor, Inc.
187
Working with Registers
5.10.5.4 TLB Register Details
This section provides detailed information on TLB registers, categorizing the registers
based on the processor core used.
This section explains the following registers:
•
•
•
•
•
e500 Registers
e500v2 Registers
e500mc Registers
e5500 Registers
e6500 Registers
5.10.5.4.1
e500 Registers
This section provides information about e500 TLB0 registers, starting from
L2MMU_TLB0 through L2MMU_TLB255.
Table 5-25. e500 TLB0 Registers (L2MMU_TLB0 through L2MMU_TLB255)
Offset Range
Field
Description
0:0
V
Valid bit for entry
1:1
TS
Translation address space (compared with AS bit of the current access)
2:5
TSIZE
Encoded
Page size
0000
Reserved
0001
4 Kbyte
0010
16 Kbyte
0011
64 Kbyte
0100
256 Kbyte
0101
1 Mbyte
0110
4 Mbyte
0111
16 Mbyte
1000
64 Mbyte
1001
256 Mbyte
6:7
-
RESERVED
8 : 15
TID
Translation ID (compared with PID0, PID1, PID2 or TIDZ (all zeros))
16 : 17
NV
Next Victim bits used for LRU replacement algorithm.
18 : 31
-
RESERVED
Table continues on the next page...
CodeWarrior Development Studio for Power Architecture Processors Targeting Manual, Rev. 10.5.0,
06/2015
188
Freescale Semiconductor, Inc.
Chapter 5 Working with Debugger
Table 5-25. e500 TLB0 Registers (L2MMU_TLB0 through L2MMU_TLB255) (continued)
Offset Range
Field
Description
32 : 36
WIMGE
Memory/cache attributes (write-through, cache-inhibit, memory coherence required,
guarded, endian)
37 : 37
-
RESERVED
38 : 38
X0
Extra system attribute bits (for definition by system software)
39 : 39
X1
Extra system attribute bits (for definition by system software)
40 : 43
U0 - U3
User attribute bits, used only by software. These bits exist in the L2 MMU TLBs only
(TLB1 and TLB0)
44 : 44
-
RESERVED
45 : 45
SR
Supervisor read permission bit
46 : 46
SW
Supervisor write permission bit
47 : 47
SX
Supervisor execute permission bit
48 : 48
UR
User read permission bit
49 : 49
UW
User write permission bit
50 : 50
UX
User execute permission bit
51:59
-
RESERVED
60 : 63
Extended RPN
64 : 83
RPN
Real page number
84: 95
-
RESERVED
96 : 115
EPN
Effective page number
116 : 127
-
RESERVED
The table below shows e500 TLB1 registers, starting from L2MMU_CAM0 through
L2MMU_CAM15.
Table 5-26. e500 TLB1 Registers (L2MMU_CAM0 through L2MMU_CAM15)
Offset Range
0:3
Field
TSIZE
Description
Encoded
Page size
0000
Reserved
0001
4 Kbyte
0010
16 Kbyte
0011
64 Kbyte
0100
256 Kbyte
0101
1 Mbyte
0110
4 Mbyte
0111
16 Mbyte
1000
64 Mbyte
1001
256 Mbyte
4:4
TS
Translation address space (compared with AS bit of the current access)
5:7
-
RESERVED
Table continues on the next page...
CodeWarrior Development Studio for Power Architecture Processors Targeting Manual, Rev. 10.5.0,
06/2015
Freescale Semiconductor, Inc.
189
Working with Registers
Table 5-26. e500 TLB1 Registers (L2MMU_CAM0 through L2MMU_CAM15) (continued)
Offset Range
Field
Description
8 : 15
TID
Translation ID (compared with PID0, PID1, PID2 or TIDZ (all zeros))
16 : 23
MASK
SIZE
MASK
4 KB
0x0000000000
16 KB
0x0000000001
64 KB
0x0000000011
256 KB
0x0000000111
1 MB
0x0000001111
4 MB
0x0000011111
16 MB
0x0000111111
64 MB
0x0001111111
256 MB
0x0011111111
24 : 26
-
RESERVED
27 : 31
WIMGE
Memory/cache attributes (write-through, cache-inhibit, memory coherence required,
guarded, endian)
32 : 32
UR
User read permission bit
33 : 33
UW
User write permission bit
34 : 34
UX
User execute permission bit
35 : 35
SR
Supervisor read permission bit
36 : 36
SW
Supervisor write permission bit
37 : 37
SX
Supervisor execute permission bit
38 : 38
X0
Extra system attribute bits (for definition by system software)
39 : 39
X1
Extra system attribute bits (for definition by system software)
40 : 43
U0 - U3
User attribute bits, used only by software. These bits exist in the L2 MMU TLBs only
(TLB1 and TLB0)
44 : 44
IPROT
Invalidation protection (exists in TLB1 only)
45 : 63
-
RESERVED
64 : 83
RPN
Real page number
84 : 95
-
RESERVED
96 : 115
EPN
Effective page number
116 : 126
-
RESERVED
127 : 127
V
Valid bit for entry
5.10.5.4.2
e500v2 Registers
CodeWarrior Development Studio for Power Architecture Processors Targeting Manual, Rev. 10.5.0,
06/2015
190
Freescale Semiconductor, Inc.
Chapter 5 Working with Debugger
This section provides information about e500v2 TLB0 registers, starting from
L2MMU_TLB0 through L2MMU_TLB511.
Table 5-27. e500v2 TLB0 Registers (L2MMU_TLB0 through
L2MMU_TLB511)
Offset Range
Field
Description
0:0
V
Valid bit for entry
1:1
TS
Translation address space (compared with AS bit of the current access)
2:5
TSIZE
Encoded
Page size
0000
Reserved
0001
4 Kbyte
0010
16 Kbyte
0011
64 Kbyte
0100
256 Kbyte
0101
1 Mbyte
0110
4 Mbyte
0111
16 Mbyte
1000
64 Mbyte
1001
256 Mbyte
1010
1 Gbyte
1011
4 Gbyte
6:7
-
RESERVED
8 : 15
TID
Translation ID (compared with PID0, PID1, PID2, or TIDZ (all zeros))
16 : 17
NV
Next Victim bits used for LRU replacement algorithm.
18 : 31
-
RESERVED
32 : 36
WIMGE
Memory/cache attributes (write-through, cache-inhibit, memory coherence required,
guarded, endian)
37 : 37
-
RESERVED
38 : 38
X0
Extra system attribute bits (for definition by system software)
39 : 39
X1
Extra system attribute bits (for definition by system software)
40 : 43
U0 - U3
User attribute bits, used only by software. These bits exist in the L2 MMU TLBs only
(TLB1 andTLB0)
44 : 44
-
RESERVED
45 : 45
SR
Supervisor read permission bit
46 : 46
SW
Supervisor write permission bit
47 : 47
SX
Supervisor execute permission bit
48 : 48
UR
User read permission bit
49 : 49
UW
User write permission bit
50 : 50
UX
User execute permission bit
51:59
-
RESERVED
60 : 63
Extended RPN
64 : 83
RPN
Real page number
Table continues on the next page...
CodeWarrior Development Studio for Power Architecture Processors Targeting Manual, Rev. 10.5.0,
06/2015
Freescale Semiconductor, Inc.
191
Working with Registers
Table 5-27. e500v2 TLB0 Registers (L2MMU_TLB0 through L2MMU_TLB511) (continued)
Offset Range
Field
Description
84: 95
-
RESERVED
96 : 115
EPN
Effective page number
116 : 127
-
RESERVED
The table below shows e500v2 TLB1 registers, starting from L2MMU_CAM0 through
L2MMU_CAM15.
Table 5-28. e500v2 TLB1 Registers (L2MMU_CAM0 through
L2MMU_CAM15)
Offset Range
0:3
Field
TSIZE
Description
Encoded
Page size
0000
Reserved
0001
4 Kbyte
0010
16 Kbyte
0011
64 Kbyte
0100
256 Kbyte
0101
1 Mbyte
0110
4 Mbyte
0111
16 Mbyte
1000
64 Mbyte
1001
256 Mbyte
1010
1 Gbyte
1011
4 Gbyte
4:4
TS
Translation address space (compared with AS bit of the current access)
5:7
-
RESERVED
8 : 15
TID
Translation ID (compared with PID0, PID1, PID2 or TIDZ (all zeros))
16 : 25
MASK
SIZE
MASK
4 KB
0x0000000000
16 KB
0x0000000001
64 KB
0x0000000011
256 KB
0x0000000111
1 MB
0x0000001111
4 MB
0x0000011111
16 MB
0x0000111111
64 MB
0x0001111111
256 MB
0x0011111111
1 GB
0x0111111111
Table continues on the next page...
CodeWarrior Development Studio for Power Architecture Processors Targeting Manual, Rev. 10.5.0,
06/2015
192
Freescale Semiconductor, Inc.
Chapter 5 Working with Debugger
Table 5-28. e500v2 TLB1 Registers (L2MMU_CAM0 through L2MMU_CAM15) (continued)
Offset Range
Field
Description
4 GB
0x1111111111
26 : 26
-
RESERVED
27 : 31
WIMGE
Memory/cache attributes (write-through, cache-inhibit, memory coherence required,
guarded, endian)
32 : 32
UR
User read permission bit
33 : 33
UW
User write permission bit
34 : 34
UX
User execute permission bit
35 : 35
SR
Supervisor read permission bit
36 : 36
SW
Supervisor write permission bit
37 : 37
SX
Supervisor execute permission bit
38 : 38
X0
Extra system attribute bits (for definition by system software)
39 : 39
X1
Extra system attribute bits (for definition by system software)
40 : 43
U0 - U3
User attribute bits, used only by software. These bits exist in the L2 MMU TLBs only
(TLB1 and TLB0)
44 : 44
IPROT
Invalidation protection (exists in TLB1 only)
45 : 59
-
RESERVED
60 : 63
Extended RPN
64 : 83
RPN
Real page number
84 : 95
-
RESERVED
96 : 115
EPN
Effective page number
116 : 126
-
RESERVED
127 : 127
V
Valid bit for entry
5.10.5.4.3
e500mc Registers
This section provides information about e500mc TLB0 registers, starting from
L2MMU_TLB0 through L2MMU_TLB511.
Table 5-29. e500mc TLB0 Registers (L2MMU_TLB0 through
L2MMU_TLB511)
Offset Range
Field
Description
0:0
V
Valid bit for entry.
1:1
TS
Translation space. Compared with MSR[IS] (instruction fetch) or MSR[DS] (memory
reference) to determine if this TLB entry may be used for translation.
2:5
TSIZE
Defines the page size of the TLB entry.
6:7
Reserved
-
8:15
TID
Translation identity. Defines the process ID for this TLB entry.
16:17
NV
Next victim. Can be used to identify the next victim to be targeted for a TLB miss
replacement operation for those TLBs that support the NV field.
Table continues on the next page...
CodeWarrior Development Studio for Power Architecture Processors Targeting Manual, Rev. 10.5.0,
06/2015
Freescale Semiconductor, Inc.
193
Working with Registers
Table 5-29. e500mc TLB0 Registers (L2MMU_TLB0 through L2MMU_TLB511) (continued)
Offset Range
Field
Description
18:31
Reserved
-
32:32
W
Write-through
33:33
I
Caching-inhibited
34:34
M
Memory coherency required
35:35
G
Guarded
36:36
E
Endianness. Determines endianness for the corresponding page.
37:37
Reserved
-
38:38
X0
Implementation-dependent page attribute. Implemented as storage.
39:39
X1
Implementation-dependent page attribute. Implemented as storage.
40:43
U0-U3
User attribute bits. These bits are associated with a TLB entry and can be used by
system software.
44:44
Reserved
-
45:45
SR
Supervisor read permission bit.
46:46
SW
Supervisor write permission bit.
47:47
SX
Supervisor execute permission bit.
48:48
UR
User read permission bit.
49:49
UW
User write permission bit.
50:50
UX
User execute permission bit.
51:51
Reserved
-
52:52
GS
Translation guest space.
53:53
VF
Virtualization fault. Controls whether a DSI occurs on data accesses to the page,
regardless of permission bit settings.
54:59
LPIDR
Translation logical partition ID.
60:83
RPN
Real page number
84:95
Reserved
-
96:115
EPN
Effective page number
116:127
Reserved
-
The table below shows e500mc TLB1 registers, starting from L2MMU_CAM0 through
L2MMU_CAM63.
Table 5-30. e500mc TLB1 Registers (L2MMU_CAM0 through
L2MMU_CAM63)
Offset Range
Field
Description
0:3
TSIZE
Defines the page size of the TLB entry.
4:4
TS
Translation space. Compared with MSR[IS] (instruction fetch) or MSR[DS] (memory
reference) to determine if this TLB entry may be used for translation.
5:7
Reserved
-
8:15
TID
Translation identity. Defines the process ID for this TLB entry.
16:25
MASK
SIZE
MASK
Table continues on the next page...
CodeWarrior Development Studio for Power Architecture Processors Targeting Manual, Rev. 10.5.0,
06/2015
194
Freescale Semiconductor, Inc.
Chapter 5 Working with Debugger
Table 5-30. e500mc TLB1 Registers (L2MMU_CAM0 through L2MMU_CAM63) (continued)
Offset Range
Field
Description
4 KB
0x0000000000
16 KB
0x0000000001
64 KB
0x0000000011
256 KB
0x0000000111
1 MB
0x0000001111
4 MB
0x0000011111
16 MB
0x0000111111
64 MB
0x0001111111
256 MB
0x0011111111
1 GB
0x0111111111
4 GB
0x1111111111
26:26
Reserved
-
27:27
W
Write-through
28:28
I
Caching-inhibited
29:29
M
Memory coherency required
30:30
G
Guarded
31:31
E
Endianness. Determines endianness for the corresponding page.
32:32
UR
User read permission bit.
33:33
UW
User write permission bit.
34:34
UX
User execute permission bit.
35:35
SR
Supervisor read permission bit.
36:36
SW
Supervisor write permission bit.
37:37
SX
Supervisor execute permission bit.
38:38
X0
Implementation-dependent page attribute. Implemented as storage.
39:39
X1
Implementation-dependent page attribute. Implemented as storage.
40:43
U0-U3
User attribute bits. These bits are associated with a TLB entry and can be used by
system software.
44:44
IPROT
Invalidate protect. Set to protect this TLB entry from invalidate operations from tlbivax,
tlbilx, or MMUCSR0 TLB flash invalidates.
45:51
Reserved
-
52:52
GS
Translation guest space.
53:53
VF
Virtualization fault. Controls whether a DSI occurs on data accesses to the page,
regardless of permission bit settings.
54:59
LPIDR
Translation logical partition ID.
60:83
RPN
Real page number
84:95
Reserved
-
96:115
EPN
Effective page number
116:126
Reserved
-
127:127
V
Valid bit for entry.
CodeWarrior Development Studio for Power Architecture Processors Targeting Manual, Rev. 10.5.0,
06/2015
Freescale Semiconductor, Inc.
195
Working with Registers
5.10.5.4.4
e5500 Registers
This section provides information about e5500 TLB0 registers, starting from
L2MMU_TLB0 through L2MMU_TLB511.
Table 5-31. e5500 TLB0 Registers (L2MMU_TLB0 through L2MMU_TLB511)
Offset Range
Field
Description
0:0
V
Valid bit for entry.
1:1
TS
Translation space. Compared with MSR[IS] (instruction fetch) or MSR[DS] (memory
reference) to determine if this TLB entry may be used for translation.
2:5
TSIZE
Defines the page size of the TLB entry.
6:7
Reserved
-
8:15
TID
Translation identity. Defines the process ID for this TLB entry.
16:17
NV
Next victim. Can be used to identify the next victim to be targeted for a TLB miss
replacement operation for those TLBs that support the NV field.
18:31
Reserved
-
32:32
W
Write-through
33:33
I
Caching-inhibited
34:34
M
Memory coherency required
35:35
G
Guarded
36:36
E
Endianness. Determines endianness for the corresponding page.
37:37
Reserved
-
38:38
X0
Implementation-dependent page attribute. Implemented as storage.
39:39
X1
Implementation-dependent page attribute. Implemented as storage.
40:43
U0-U3
User attribute bits. These bits are associated with a TLB entry and can be used by
system software.
44:44
Reserved
-
45:45
SR
Supervisor read permission bit.
46:46
SW
Supervisor write permission bit.
47:47
SX
Supervisor execute permission bit.
48:48
UR
User read permission bit.
49:49
UW
User write permission bit.
50:50
UX
User execute permission bit.
51:51
Reserved
-
52:52
GS
Translation guest space.
53:53
VF
Virtualization fault. Controls whether a DSI occurs on data accesses to the page,
regardless of permission bit settings.
54:59
LPIDR
Translation logical partition ID.
60:91
Reserved
-
92:115
RPN
Real page number
116:127
Reserved
Table continues on the next page...
CodeWarrior Development Studio for Power Architecture Processors Targeting Manual, Rev. 10.5.0,
06/2015
196
Freescale Semiconductor, Inc.
Chapter 5 Working with Debugger
Table 5-31. e5500 TLB0 Registers (L2MMU_TLB0 through L2MMU_TLB511) (continued)
Offset Range
Field
Description
128:179
EPN
Effective page number
180:191
Reserved
-
The table below shows e5500 TLB1 registers, starting from L2MMU_CAM0 through
L2MMU_CAM63.
Table 5-32. e5500 TLB1 Registers (L2MMU_CAM0 through L2MMU_CAM63)
Offset Range
Field
Description
0:3
TSIZE
Defines the page size of the TLB entry.
4:4
TS
Translation space. Compared with MSR[IS] (instruction fetch) or MSR[DS] (memory
reference) to determine if this TLB entry may be used for translation.
5:7
Reserved
-
8:15
TID
Translation identity. Defines the process ID for this TLB entry.
16:25
MASK
SIZE
MASK
4 KB
0x0000000000
16 KB
0x0000000001
64 KB
0x0000000011
256 KB
0x0000000111
1 MB
0x0000001111
4 MB
0x0000011111
16 MB
0x0000111111
64 MB
0x0001111111
256 MB
0x0011111111
1 GB
0x0111111111
4 GB
0x1111111111
26:26
Reserved
-
27:27
W
Write-through
28:28
I
Caching-inhibited
29:29
M
Memory coherency required
30:30
G
Guarded
31:31
E
Endianness. Determines endianness for the corresponding page.
32:32
UR
User read permission bit.
33:33
UW
User write permission bit.
34:34
UX
User execute permission bit.
35:35
SR
Supervisor read permission bit.
36:36
SW
Supervisor write permission bit.
37:37
SX
Supervisor execute permission bit.
38:38
X0
Implementation-dependent page attribute. Implemented as storage.
Table continues on the next page...
CodeWarrior Development Studio for Power Architecture Processors Targeting Manual, Rev. 10.5.0,
06/2015
Freescale Semiconductor, Inc.
197
Working with Registers
Table 5-32. e5500 TLB1 Registers (L2MMU_CAM0 through L2MMU_CAM63) (continued)
Offset Range
Field
Description
39:39
X1
Implementation-dependent page attribute. Implemented as storage.
40:43
U0-U3
User attribute bits. These bits are associated with a TLB entry and can be used by
system software.
44:44
IPROT
Invalidate protect. Set to protect this TLB entry from invalidate operations from tlbivax,
tlbilx, or MMUCSR0 TLB flash invalidates.
45:51
Reserved
-
52:52
GS
Translation guest space.
53:53
VF
Virtualization fault. Controls whether a DSI occurs on data accesses to the page,
regardless of permission bit settings.
54:59
LPIDR
Translation logical partition ID.
60:91
Reserved
-
92:115
RPN
Real page number
116:127
Reserved
-
128:179
EPN
Effective page number
180:190
Reserved
-
191:191
V
Valid bit for entry.
5.10.5.4.5
e6500 Registers
This section provides information about e6500 TLB0 registers, starting from
L2MMU_TLB0 through L2MMU_TLB1023.
Table 5-33. e6500 TLB0 Registers (L2MMU_TLB0 through
L2MMU_TLB1023)
Offset Range
Field
Description
0:0
V
Valid bit for entry.
1:1
TS
Translation address space (compared with AS bit of the current access.)
2:6
TSIZE
Encoded page size. Only present in TLB1, however software should always set page
sizes for TLB0 for future compatibility.
7:9
-
Reserved
10:23
TID
Translation ID (compared with PID)
24:26
NV
27:31
-
Reserved
32:36
WIMGE
Memory/cache attributes (write-through, cache-inhibit, memory coherence required,
guarded, endian)
37:37
-
Reserved
38:38
X0
Extra system attribute bit
39:39
X1
Extra system attribute bit
40:43
U0-U3
User attribute bits, used only by software.
Table continues on the next page...
CodeWarrior Development Studio for Power Architecture Processors Targeting Manual, Rev. 10.5.0,
06/2015
198
Freescale Semiconductor, Inc.
Chapter 5 Working with Debugger
Table 5-33. e6500 TLB0 Registers (L2MMU_TLB0 through L2MMU_TLB1023) (continued)
Offset Range
Field
Description
44:44
-
Reserved
45:45
SR
Supervisor read permission bit
46:46
SW
Supervisor write permission bit
47:47
SX
Supervisor execute permission bit
48:48
UR
User read permission bit
49:49
UW
User write permission bit
50:50
UX
User execute permission bit
51:51
-
Reserved
52:52
GS
Translation guest space
53:53
VF
Virtualization fault
54:59
LPIDR
Translation logical partition ID
60:87
-
Reserved
88:115
RPN
Real page number
116:127
-
Reserved
128:179
EPN
Effective page number
180:191
-
Reserved
The table below shows e6500 TLB1 registers, starting from L2MMU_CAM0 through
L2MMU_CAM63.
Table 5-34. e6500 TLB1 Registers (L2MMU_CAM0 through L2MMU_CAM63)
Offset Range
0:4
Field
TSIZE
Description
Encoded
Page size
0b00010
4 KB
0b00011
8 KB
0b00100
16 KB
0b00101
32 KB
0b00110
64 KB
0b00111
128 KB
0b01000
256 KB
0b01001
512 KB
0b01010
1 MB
0b01011
2 MB
0b01100
4 MB
0b01101
8 MB
0b01110
16 MB
0b01111
32 MB
0b10000
64 MB
Table continues on the next page...
CodeWarrior Development Studio for Power Architecture Processors Targeting Manual, Rev. 10.5.0,
06/2015
Freescale Semiconductor, Inc.
199
Working with Registers
Table 5-34. e6500 TLB1 Registers (L2MMU_CAM0 through L2MMU_CAM63) (continued)
Offset Range
Field
Description
0b10001
128 MB
0b10010
256 MB
0b10011
512 MB
0b10100
1 GB
0b10101
2 GB
0b10110
4 GB
0b10111
8 GB
0b11000
16 GB
0b11001
32 GB
0b11010
64 GB
0b11011
128 GB
0b11100
256 GB
0b11101
512 GB
5:5
Reserved
6:6
IND
Indirect bit. When set, this TLB entry is an indirect entry used to locate a page table.
7:7
TS
Translation address space (compared with AS bit of the current access.)
8:9
Reserved
10:23
TID
24:26
Reserved
27:31
WIMGE
Memory/cache attributes (write-through, cache-inhibit, memory coherence required,
guarded, endian)
32:32
UR
User read permission bit
33:33
UW
User write permission bit
34:34
UX
User execute permission bit
35:35
SR
Supervisor read permission bit
36:36
SW
Supervisor write permission bit
37:37
SX
Supervisor execute permission bit
38:38
X0
Extra system attribute bit
39:39
X1
Extra system attribute bit
40:43
U0-U3
User attribute bits, used only by software.
44:44
IPROT
Invalidation protection
45:51
Reserved
52:52
GS
Translation guest space
53:53
VF
Virtualization fault
54:59
LPIDR
Translation logical partition ID
60:87
Reserved
88:115
RPN
116:127
Reserved
Translation ID (compared with PID)
Real page number (depending on page size, only the bits associated with a page
boundary are valid. Bits that represent offsets within a page are ignored and should be
zero)
Table continues on the next page...
CodeWarrior Development Studio for Power Architecture Processors Targeting Manual, Rev. 10.5.0,
06/2015
200
Freescale Semiconductor, Inc.
Chapter 5 Working with Debugger
Table 5-34. e6500 TLB1 Registers (L2MMU_CAM0 through L2MMU_CAM63) (continued)
Offset Range
Field
128:179
EPN
180:190
Reserved
191:191
V
Description
Effective page number (Depending on page size, only the bits associated with a page
boundary are valid. Bits that represent offsets within a page are ignored and should be
zero.)
Valid bit for entry.
The table below shows e6500 LRAT registers, starting from L2MMU_LRAT0 through
L2MMU_LRAT7.
Table 5-35. e6500 LRAT Registers (L2MMU_LRAT0 through
L2MMU_LRAT7)
Offset Range
Field
0:4
LSIZE
5:25
Reserved
26:31
LPID
32:55
Reserved
56:83
LRPN
84:119
Reserved
120:147
LPN
148:158
Reserved
159:159
V
Description
Logical page size. Describes the size of the logical page of the LRAT entry. The
possible values are the same as for TSIZE field from TLB0 and TLB1.
Logical partition ID value. Is compared with LPIDR during translation to help select an
LRAT entry.
Real page number
Logical page number. Describes the logical address of the start of the page.
LRAT valid bit
5.10.6 Working with IMMR
This section describes internal memory map register (IMMR).
Use the Debugger Shell: eppc::setMMRBaseAddr command to define the memory location of
the IMMR. This information lets the CodeWarrior debugger find the IMMR register
during a debug session.
NOTE
The Change IMMR command is applicable to 825x or 826x
processors.
CodeWarrior Development Studio for Power Architecture Processors Targeting Manual, Rev. 10.5.0,
06/2015
Freescale Semiconductor, Inc.
201
Viewing memory
5.11 Viewing memory
This section explains how to view memory of a target processor.
The debugger allocates multiple memory spaces in the IDE for flexible control over the
memory access. The number of supported memory spaces and their properties depends
upon the debugged processor.
You can display and access the supported memory spaces for a target in the Memory and
Memory Browser views, in the Import/Export/Fill Memory Action Task View or in the
Debugger Shell view using the designated memory space prefix. Use the mem -ms
command to list the supported memory spaces for a processor.
To display the Memory view, select Window > Show View > Other > Debug >
Memory. The figure below shows a Memory view displaying physical memory address
space.
Figure 5-21. Memory View
NOTE
The Memory view seamlessly displays 32-bit, 36-bit, 40-bit,
and 64-bit addresses depending upon the selected memory
space and the target processor currently under debug process.
5.11.1 Adding Memory Monitor
This section describes how to add memory monitor in the Memory view.
CodeWarrior Development Studio for Power Architecture Processors Targeting Manual, Rev. 10.5.0,
06/2015
202
Freescale Semiconductor, Inc.
Chapter 5 Working with Debugger
To display the supported memory spaces for a target in the Memory view, perform the
following steps:
1. In the Memory view, click the Add Memory Monitor icon
.
The Monitor Memory dialog box appears (shown in the figure below).
2. Specify the address in the Enter address or expression to monitor drop-down list.
Figure 5-22. Monitor Memory Dialog Box
3. Select one of the supported memory spaces from the Memory space drop-down list.
• Virtual (v)
Indicates that the specified address space is same as the address space in which
the processor executes. When you select the Virtual option, the debugger
performs virtual to physical translations based on the MMU translations read
from the target or based on the translate directives specified in the memory
configuration file (for bareboard debugging) or the kernel awareness plug-in (for
Linux debugging). In addition, the Virtual memory space is the one that is
relevant for the Program Counter (PC) and the Stack Pointer (SP) registers. The
width of the Virtual memory space is determined by the target processor's
effective address size. For e500v2 and e500mc processors the width of the
Virtual memory space is 32-bit. For e5500 and e6500 processors, the width of
the Virtual memory is 64-bit. Note that the Virtual memory space is the default
memory space in the Disassembly view.
• Physical (p)
Indicates that the specified address is interpreted as a physical address. The
debugger does not attempt to perform virtual to physical translations, therefore it
simply accesses the specified address as a physical address. When you select the
CodeWarrior Development Studio for Power Architecture Processors Targeting Manual, Rev. 10.5.0,
06/2015
Freescale Semiconductor, Inc.
203
Viewing memory
Physical option, any translations read from the target MMU or defined in the
memory configuration file or the kernel awareness plug-in are disregarded. In
addition, the behavior is cache-coherent. If the data is in cache, the debugger gets
it from there, otherwise the access goes to the memory. Note that a Physical
cacheable read access can cause modified cache lines to be flushed to the
memory before being accessed.
For processors based on e500v2, e500mc, e5500 cores, the width of the physical
memory address space is 36-bit. The e6500 core has a 40-bit physical memory
space. Older cores like e300 and e500 only support 32-bit physical addresses.
• Physical Cache Inhibited
The Physical Cache Inhibited option disregards the cache and accesses whatever
is in the memory. This option allows you to access the data directly from the
main memory, even if the data or address is available in one of the caches. The
Physical Cache Inhibited memory space is only available on processors based on
e500mc/e5500/e6500 cores.
CAUTION
The e500mc/e5500/e6500 core architecture specifies
that it is a programming error to inter-mix cacheinhibited with cacheable accesses to the same memory
range. If this error is encountered, it can lead to a
number of problems like stale data, and un-intended
corruption of neighboring locations.
Also, you should not perform a cacheable access to a
memory range which is defined as cache-inhibited in
the MMU.
When using the Virtual memory space, the debugger performs virtual to physical
translations, and based on the MMU setup it requires the correct cacheable/cacheinhibited attribute for the particular memory range.
• For Linux debugging, CodeWarrior uses the Kernel Awareness plug-in to
automatically extract the cacheable/cache-inhibited attribute from the CAM/TLB
registers (I bit of the WIMGE) or the PTE kernel structure.
• For bareboard debugging, when CodeWarrior is not configured for reading the
MMU, it relies on the information available in the memory configuration file. The
translate directives are used to inform the debugger of MMU translations and
cacheable/cache-inhibited attribute (even for 1:1 translations), using the appropriate
memory space, for example:
CodeWarrior Development Studio for Power Architecture Processors Targeting Manual, Rev. 10.5.0,
06/2015
204
Freescale Semiconductor, Inc.
Chapter 5 Working with Debugger
translate v:<v_addr> p:<p_addr> - for cacheable ranges
translate v:<v_addr> i:<p_addr> - for cache-inhibited ranges
• CodeWarrior can also automatically read the translations from the target while
debugging bareboard applications for most processors based on e500v2, e500mc,
e5500, and e6500 cores, relieving the user from specifying the translations in the
memory configuration file. For more information, see Memory translations.
5.12 Viewing Cache
This section provides detailed information on working with caches.
The CodeWarrior debugger allows you to view and modify the instruction cache and data
cache of the target system during a debug session.
In this section:
•
•
•
•
•
•
•
Cache View
Cache View Toolbar Menu
Components of Cache View
Using Debugger Shell to View Caches
Debugger Shell Global Cache Commands
Debugger Shell Cache Line Commands
Processor-Specific Cache Features
5.12.1 Cache View
This section describes how to use Cache view.
Use the Cache view to examine L1 cache (such as instruction cache or data cache). Also,
you can use the viewer to display L2 and L3 cache for targets that support it.
To open the Cache view, use the following steps:
1. Start a debugging session.
2. From the CodeWarrior IDE menu bar, select Window > Show View > Other.
The Show View dialog box appears.
3. Expand the Debug group.
4. Select Cache.
5. Click OK.
CodeWarrior Development Studio for Power Architecture Processors Targeting Manual, Rev. 10.5.0,
06/2015
Freescale Semiconductor, Inc.
205
Viewing Cache
The Cache view appears, as shown in the figure below.
Tip
You can use the type filter text box as a shortcut to specify
the Cache view. Start typing cache into the text box. The
Show View dialog box shortens the list of views to those
whose names match the characters you type. The list
continues to shorten as you type each additional character.
When the list shows just the Cache view, select it and click
OK to open that view. You can click Clear (
the text box and restore the full list of views.
) to empty
Figure 5-23. Cache View
6. Use the Choose a Cache list box to specify the cache that you want to examine.
NOTE
If the Choose a Cache list box is grayed out, the current
target does not support viewing cache. If a cache line
appears in red, it indicates that the line has been changed by
the processor in the cache but has not been updated in the
storage. This is also suggested by the Dirty flag that reads
Yes in this case.
5.12.2 Cache View Toolbar Menu
CodeWarrior Development Studio for Power Architecture Processors Targeting Manual, Rev. 10.5.0,
06/2015
206
Freescale Semiconductor, Inc.
Chapter 5 Working with Debugger
Use the Cache view toolbar menu is to configure the cache information.
To display this menu, click the Menu button (inverted triangle) in the Cache view
toolbar.
Tip
The Cache view toolbar buttons are alternative ways to
implement the control actions defined in the toolbar menu.
NOTE
Certain toolbar buttons are unavailable (grayed out) if the target
hardware does not support their corresponding functions, or if a
specific operation can be performed in assembly language and
is not supported by the Cache view.
The table below describes the Cache view toolbar menu options.
Table 5-36. Cache View Toolbar Menu Options
Option
Description
Write
Commits content changes from the Cache view to the cache
registers on the target hardware (if the target hardware
supports doing so).
Refresh
Reads data from the target hardware and updates the Cache
view display.
Invalidate
Discards the cache.
Flush
Flushes the entire contents of the cache. This option commits
uncommitted data to the next level of the memory hierarchy,
then invalidates the data within the cache.
Lock
Locks the cache and prevent the debugger from fetching new
lines or discarding current valid lines.
Enable/Disable
Turns on/off the cache.
Disable LRU
Removes the Least Recently Used (LRU) attribute from the
existing display for each cache line. This option is never
activated because the function does not apply to Power
Architecture processors.
Enable/Disable Parity
Turns on/off the line data parity checksum calculation.
Inverse LRU
Displays the inverse of the Least Recently Used attribute for
each cache line. This option is never activated because the
function does not apply to Power Architecture processors.
Copy Cache
Copies the cache contents to the system clipboard.
Export Cache
Exports the cache contents to a file.
Search
Finds an occurrence of a string in the cache lines.
Search Again
Finds the next occurrence of a string in the cache lines.
Preserve Sorting
Preserves sorting of the cache when the cache data is
updated and the cache is refreshing. This option is disabled
by default. If enabled, every operation that triggers cache
refresh (such as step, run to breakpoint) will have to wait for
cache data loading and sorting.
Table continues on the next page...
CodeWarrior Development Studio for Power Architecture Processors Targeting Manual, Rev. 10.5.0,
06/2015
Freescale Semiconductor, Inc.
207
Viewing Cache
Table 5-36. Cache View Toolbar Menu Options (continued)
Option
Description
View Memory
Allows you to view the corresponding memory for the selected
cache lines.
Lock Line
Locks the selected cache lines.
Invalidate Line
Invalidates the selected cache lines.
Flush Line
Flushes the entire contents of the selected cache lines.
Synchronize Line
Synchronizes selected cache data with memory data.
Lock Way
Locks the cache ways specified with the Lock Ways menu
option. Locking a cache way means that the data contained in
that way must not change. If the cache needs to discard a
line, it will not discard locked lines (such as lines explicitly
locked, or lines belonging to locked ways).
Unlock Way
Unlocks the cache ways specified with the Lock Ways menu
option.
Lock Ways
Specifies the cache ways on which the Lock Way and
Unlock Way menu options operate.
5.12.3 Components of Cache View
Below the toolbar, there are two panes in the window, separated by another vertical
divider line. The pane to the left of the divider line displays the attributes for each
displayed cache line. The pane to the right of the divider line displays the actual contents
of each displayed cache line. You can modify information in this pane and click Write to
apply those changes to the cache on the target board.
Above the cache line display panes are Refresh and Write and the View As drop-down
menu. Click Refresh to clear the entire contents of the cache, re-read status information
from the target hardware, and update the cache lines display panes. Click Write to
commit cache content changes from this window to the cache memory on the target
hardware (if the target hardware supports doing so). Select Raw Data or Disassembly
from the View As drop-down menu to change the way the IDE displays the data in the
cache line contents pane on the right side of the window.
You can perform all cache operations from assembly code in your programs. For details
about assembly code, see the core documentation for the target processor.You can also
perform cache operations by clicking Menu, shown as an inverted triangle, which opens
a pull-down menu that contain actions for the Cache view.
CodeWarrior Development Studio for Power Architecture Processors Targeting Manual, Rev. 10.5.0,
06/2015
208
Freescale Semiconductor, Inc.
Chapter 5 Working with Debugger
5.12.4 Using Debugger Shell to View Caches
Another way to manipulate the processor's caches is by using the Debugger Shell view.
To display the Debugger Shell view, follow these steps:
1. Start a debugging session.
2. Select Window > Show View > Other.
The Show View dialog box appears.
3. Expand the Debug group.
4. Select Debugger Shell.
5. Click OK.
The Debugger Shell view appears.
To display a list of the commands supported by the Debugger Shell view, enter this at
the command prompt:
help -tree
For more information about the Debugger Shell support of cache commands, enter these
commands at the command prompt:
help cmdwin::ca
help cmdwin::caln
The next sections describe these commands in detail.
5.12.5 Debugger Shell Global Cache Commands
The cmdwin::ca cache commands manage global cache operations. That is, they affect the
operation of the entire cache. For multi-core processors, these commands operate on a
specific cache if an optional ID number is provided. If the ID number is absent, the
command operates on the cache that was assigned as the default by the last
cmdwin::ca::default command.
The table below lists the cache commands.
CodeWarrior Development Studio for Power Architecture Processors Targeting Manual, Rev. 10.5.0,
06/2015
Freescale Semiconductor, Inc.
209
Viewing Cache
Table 5-37. Debugger Shell Global Cache Commands
Command
Description
cmdwin::ca::default
Set specified cache as default
cmdwin::ca::enable
Enable/disable cache
cmdwin::ca::flush
Flushes cache
cmdwin::ca::inval
Invalidates cache
cmdwin::ca::lock
Lock/Unlock cache
cmdwin::ca::show
Show the architecture of the cache
The basic format of a shell global cache command is:
command [<cache ID>] [on | off]
The optional cache ID number argument selects the cache that the command affects.
The optional on or off argument changes a cache's state.
For example, to display a particular cache's characteristics:
%> cmdwin::ca:show 1
displays the characteristics of the second processor cache.
You use the cmd::ca::default to assign a default cache that becomes the target of global
cache commands. For example:
%> cmdwin::ca:default 0
makes the first processor cache the default cache. Subsequent global cache commands
that do not specify a cache ID will affect this cache.
Other cache commands require the off or on state argument. When specifying a particular
cache, the state argument follows the ID argument. For example:
%> cmdwin::ca:lock 2 on
locks the contents of the third processor cache, while:
%> cmdwin::ca:enable 1 off
disables the second processor cache.
5.12.6 Debugger Shell Cache Line Commands
The cmdwin::caln commands manage cache line operations. They affect memory elements
within a designated cache. The table below lists these commands.
CodeWarrior Development Studio for Power Architecture Processors Targeting Manual, Rev. 10.5.0,
06/2015
210
Freescale Semiconductor, Inc.
Chapter 5 Working with Debugger
Table 5-38. Debugger Shell Cache Line Commands
Command
Description
cmdwin::caln::get
Display cache line
cmdwin::caln::flush
Flush cache line
cmdwin::caln::inval
Invalidate cache line
cmdwin::caln::lock
Locks/unlocks cache line
cmdwin::caln::set
Writes specified data to cache line
The basic format for a shell cache line command is:
command [<cache ID>] <line> [<count>]
The optional cache ID argument specifies the cache that the command affects, otherwise
it affects the default cache, as set by the cmdwin::ca::default command.
The required line argument specifies the cache line to affect.
The optional count argument specifies the number of cache lines the command affects.
The default is one line. For example:
%> cmdwin::caln:flush 2
flushes line 2 of the default cache.
The cmdwin::caln:set command varies from the other commands in that you must specify
data words that fill the cache line. For example:
%> cmdwin::caln:set 2 = 0 1 1 2 3 5 8 13
Sets the contents of cache line two, where the first word has a value of 0, the second word
has a value of 1, the third word has a value of 1, the fourth word has a value of 2, and so
on.
NOTE
If the command specifies a list of data values that are less than
one line's worth of words, then the values are repeated from the
beginning of the list to complete the filling the cache line. If too
many data words are specified for the cache line to hold, the
extra values are discarded.
5.12.7 Processor-Specific Cache Features
This section lists the cache features and supported status flags by this product.
CodeWarrior Development Studio for Power Architecture Processors Targeting Manual, Rev. 10.5.0,
06/2015
Freescale Semiconductor, Inc.
211
Viewing Cache
The table below lists cache features supported by P4080 QorIQ processors.
Table 5-39. P4080 QorIQ - Supported Cache Operations
Cache
Features
Supported Operations
Supported Status Flags
L1 data cache
•
•
•
•
32 KB size
64 sets
8 ways
16 words / line
•
•
•
•
•
•
•
•
enable/disable cache
lock/unlock cache
invalidate cache
lock/unlock line
invalidate line
read/modify data
flush cache
flush line
•
•
•
•
•
•
valid
lock
shared
dirty
castout
plru
L1 instruction cache
•
•
•
•
32 KB size
64 sets
8 ways
16 words / line
•
•
•
•
•
•
enable/disable cache
lock/unlock cache
invalidate cache
lock/unlock line
invalidate line
read/modify data
• valid
• lock
• plru
L2 cache
•
•
•
•
128 KB size
256 sets
8 ways
16 words / line
•
•
•
•
•
•
•
•
enable/disable cache
lock/unlock cache
invalidate cache
lock/unlock line
invalidate line
read/modify data
flush cache
flush line
•
•
•
•
•
•
valid
lock
shared
dirty
non-coherent
plru
L3 cache
•
•
•
•
•
2 banks
512KB/bank
512 sets
32 ways
16 words/line
•
•
•
•
•
•
•
•
enable/disable cache
lock/unlock cache
invalidate cache
lock/unlock line
invalidate line
read/modify data
flush cache
flush line
•
•
•
•
valid
locked
modified
plru
The table below lists cache features supported by PowerQUICC II processors.
Table 5-40. PowerQUICC II Family - Supported Cache Operations
Cache
Features
Supported Operations
L1D L1 data cache
•
•
•
•
16 KB size
128 sets
4 ways
8 words / line
•
•
•
•
enable/disable cache
lock/unlock cache
invalidate cache
read/modify data
L1I L1 instruction cache
•
•
•
•
16 KB size
128 sets
4 ways
8 words / line
•
•
•
•
enable/disable cache
lock/unlock cache
invalidate cache
read/modify data
The table below lists cache features supported by PowerQUICC III processors.
CodeWarrior Development Studio for Power Architecture Processors Targeting Manual, Rev. 10.5.0,
06/2015
212
Freescale Semiconductor, Inc.
Chapter 5 Working with Debugger
Table 5-41. PowerQUICC III Family - Supported Cache Operations
Cache
Features
Supported Operations
L1D L1 data cache
•
•
•
•
32 KB size
128 sets
8 ways
8 words / line
•
•
•
•
•
•
enable/disable cache
lock/unlock cache
invalidate cache
lock/unlock line
invalidate line
read/modify data
L1I L1 instruction cache
•
•
•
•
32 KB size
128 sets
8 ways
8 words / line
•
•
•
•
•
•
enable/disable cache
lock/unlock cache
invalidate cache
lock/unlock line
invalidate line
read/modify data
L2 L2 cache (data only, instruction only,
unified)
•
•
•
•
256 KB/512 KB size
1024/2048 sets
8 ways
8 words / line
•
•
•
•
enable/disable cache
lock/unlock cache
invalidate cache
read/modify data
5.13 Changing Program Counter Value
This section explains how to change the program counter value in the CodeWarrior IDE
to make the debugger execute a specific line of code.
To change the program counter value, follow these steps:
1. Start a debugging session.
2. In the Editor view, place the cursor on the line that you want the debugger to execute
next.
3. Right-click in the Editor view.
A context menu appears.
4. From the context menu, select Move To Line.
The CodeWarrior IDE modifies the program counter according to the specified location.
The Editor view shows the new location.
5.14 Hard resetting
Use the reset hard command in the Debugger Shell view to send a hard reset signal to the
target processor.
CodeWarrior Development Studio for Power Architecture Processors Targeting Manual, Rev. 10.5.0,
06/2015
Freescale Semiconductor, Inc.
213
Setting Stack Depth
NOTE
The Hard Reset command is enabled only if the debug
hardware you are using supports it.
Tip
You can also perform a hard reset by clicking Reset (
the Debug perspective toolbar.
) on
5.15 Setting Stack Depth
This section describes how to control the depth of the call stack displayed by the
debugger.
Select Window > Preferences > C/C++ > Debug > Maximum stack crawl depth
option to set the depth of the stack to read and display. Showing all levels of calls when
you are examining function calls several levels deep can sometimes make stepping
through code more time consuming. Therefore, you can use this menu option to reduce
the depth of calls that the debugger displays.
5.16 Import a CodeWarrior Executable file Wizard
The Import a CodeWarrior Executable file wizard helps you to import a CodeWarrior
executable file and create a new project.
To use the Import a CodeWarrior Executable file wizard, perform these steps:
1. From the CodeWarrior IDE menu bar, select File > Import.
The Import wizard launches and the Select page appears.
2. Expand the CodeWarrior group.
3. Select the CodeWarrior Executable Importer to import a Power Architecture .elf
file.
4. Click Next.
The wizard name changes to Import a CodeWarrior Executable file and the
Import a CodeWarrior Executable file page appears.
The following sections describe the various pages that the wizard displays as it assists
you in importing an executable (.elf) file:
CodeWarrior Development Studio for Power Architecture Processors Targeting Manual, Rev. 10.5.0,
06/2015
214
Freescale Semiconductor, Inc.
Chapter 5 Working with Debugger
•
•
•
•
•
•
Import a CodeWarrior Executable file Page
Import C/C++/Assembler Executable Files Page
Processor Page
Linux Application Launch Configurations Page
Debug Target Settings Page
Configurations Page
5.16.1 Import a CodeWarrior Executable file Page
Use the Import a CodeWarrior Executable file page to specify the name and location
for your project.
The table below describes the options available on this page.
Table 5-42. Import a CodeWarrior Executable file page settings
Option
Description
Project name
Specify the name of the project. The specified name identifies the project created for
debugging (but not building) the executable file.
Use default location
If you select this option, the project files required to build the program are stored in the
current workspace directory of the workbench. If you clear this option, the project files
are stored in the directory that you specify in the Location option.
Location
Specifies the directory that contains the project files. Use the Browse button to navigate
to the desired directory. This option is only available when the Use default location
option is cleared.
5.16.2 Import C/C++/Assembler Executable Files Page
Use the Import C/C++/Assembler Executable Files page to select an executable file or
a folder to search for C/C++/assembler executable files.
The table below explains the options available on the page.
Table 5-43. Import C/C++/Assembler Executable Files page settings
Option
Description
File to import
Specifies the C/C++/assembler executable file. Click Browse
to choose an executable file.
Copy the selected file to current project folder
Select this option to copy the executable file in the project
folder.
CodeWarrior Development Studio for Power Architecture Processors Targeting Manual, Rev. 10.5.0,
06/2015
Freescale Semiconductor, Inc.
215
Import a CodeWarrior Executable file Wizard
5.16.3 Processor Page
Use the Processor page to specify the processor family for the imported executable file
and also specify the toolchain to be used.
The table below describes the options available on the page.
Table 5-44. Processor page settings
Option
Processor
Description
Expand the processor family and select the appropriate target processor for the
execution of the specified executable file. The toolchain uses this choice to generate
code that makes use of processor-specific features, such as multiple cores.
Tip: You can also type the processor name in the text box.
Toolchain
Chooses the compiler, linker, and libraries used to build the program. Each toolchain
generates code targeted for a specific platform. These are:
• Bareboard Application: Targets a hardware board without an operating system.
• Linux Application: Targets a board running the Linux operating system.
Target OS
Select if the board runs no operation system or imports a Linux kernel project to be
executed on the board. The option is applicable only for bareboard application projects.
5.16.4 Linux Application Launch Configurations Page
Use the Linux Application Launch Configurations page to specify how the debugger
communicates with the host Linux system and controls your Linux application.
NOTE
The Linux Application page appears, only when select the
Linux Application toolchain option on the Processor page in
the Import a CodeWarrior Executable file wizard.
NOTE
When debugging a Linux application, you must use the
CodeWarrior TRK to manage the communications interface
between the debugger and Linux system. For details, see Install
CodeWarrior TRK on Target System.
The table below lists the options available on the page.
CodeWarrior Development Studio for Power Architecture Processors Targeting Manual, Rev. 10.5.0,
06/2015
216
Freescale Semiconductor, Inc.
Chapter 5 Working with Debugger
Table 5-45. Linux Application Launch Configurations Page Setting
Option
Description
CodeWarrior TRK
Select to use the CodeWarrior Target Resident Kernel (TRK) protocol, to download and
control application on the Linux host system.
TAP Address
Specifies the IP address of the Linux host system, the project executes on.
Port
Specifies the port number that the debugger will use to communicate to the Linux host.
Remote Download Path
Specifies the host directory into which the debugger downloads the application.
5.16.5 Debug Target Settings Page
Use the Debug Target Settings page to specify debugger connection type, board type,
launch configuration type, and connection type for your project.
This page also allows you to configure connection settings for your project.
The table below describes the options available on the page.
Table 5-46. Debug Target Settings page settings
Option
Description
Debugger Connection Types
Specifies what target the program executes on.
• Hardware: Select to execute the program on the hardware available for the
product.
• Simulator: Select to execute the program on a software simulator.
• Emulator: Select to execute the program on a hardware emulator.
Board
Specifies the hardware (board) supported by the selected processor.
Launch
Specifies the launch configurations and corresponding connection configurations,
supported by the selected processor.
Connection Type
Specifies the interface to communicate with the hardware.
• USB TAP: Select to use the USB interface to communicate with the hardware
device.
• Ethernet TAP: Select to use the Ethernet interface to communicate with the
target hardware.
• CodeWarrior TAP (over USB): Select to use the CodeWarrior TAP interface
(over USB) to communicate with the hardware device.
• CodeWarrior TAP (over Ethernet): Select to use the CodeWarrior TAP interface
(over Ethernet) to communicate with the hardware device.
For more details on CodeWarrior TAP, see the CodeWarrior TAP User Guide available
in the <CWInstallDir>\\Help\PDF\ folder.
• Gigabit TAP: Corresponds to a Gigabit TAP that includes an Aurora daughter
card, which allows you to collect Nexus trace in a real-time non-intrusive fashion
from the high speed serial trace port (the Aurora interface).
Table continues on the next page...
CodeWarrior Development Studio for Power Architecture Processors Targeting Manual, Rev. 10.5.0,
06/2015
Freescale Semiconductor, Inc.
217
Debugging Externally Built Executable Files
Table 5-46. Debug Target Settings page settings (continued)
Option
Description
• Gigabit TAP + Trace (JTAG over JTAG cable): Select to use the Gigabit TAP
and Trace probe to send JTAG commands over the JTAG cable.
• Gigabit TAP + Trace (JTAG over Aurora cable): Select to use the Gigabit TAP
and Trace probe to send JTAG commands over the Aurora cable.
For more details on Gigabit TAP, see Gigabit TAP Users Guide available in the
<CWInstallDir>\PA\Help\PDF\ folder.
TAP address
Enter the IP address of the selected TAP device.
NOTE
The Debug Target Settings page may prompt you to either
create a new remote system configuration or select an existing
one.
A remote system is a system configuration that defines
connection, initialization, and target parameters. The remote
system explorer provides data models and frameworks to
configure and manage remote systems, their connections, and
their services. For more information, see the CodeWarrior
Development Studio Common Features Guide available in the
<CWInstallDir>\PA\Help\PDF\ folder.
5.16.6 Configurations Page
Use the Configurations page to select the processor core that executes the project.
The table below lists the options available on the page.
Table 5-47. Configurations Page
Options
Core Index
Description
Select the processor core that executes the project.
5.17 Debugging Externally Built Executable Files
CodeWarrior Development Studio for Power Architecture Processors Targeting Manual, Rev. 10.5.0,
06/2015
218
Freescale Semiconductor, Inc.
Chapter 5 Working with Debugger
You can use the Import a CodeWarrior Executable file wizard to debug an externally
built executable file, that is, an executable (.elf) file that has no associated CodeWarrior
project.
For example, you can debug a .elf file that was generated using a different IDE. The
process of debugging an externally built executable file can be divided into the following
tasks:
•
•
•
•
Import an Executable File
Edit the Launch Configuration
Specify the Source Lookup Path
Debug Executable File
5.17.1 Import an Executable File
First of all, you need to import the executable file that you want the CodeWarrior IDE to
debug.
The IDE imports the executable file into a new project.
To import an externally built executable file, follow these steps:
1. From the CodeWarrior IDE menu bar, select File > Import.
The Import wizard appears.
2. Expand the CodeWarrior group.
3. Select CodeWarrior Executable Importer to import a Power Architecture .elf file.
4. Click Next.
The wizard name changes to Import a CodeWarrior Executable file and the
Import a CodeWarrior Executable file page appears.
5. In the Project name text box, enter the name of the project. This name identifies the
project that the IDE creates for debugging (but not building) the executable file.
6. Clear the Use default location checkbox and click Browse to specify a different
location for the new project. By default, the Use default location checkbox is
selected.
7. Click Next.
The Import C/C++/Assembler Executable Files page appears.
8. Click Browse.
CodeWarrior Development Studio for Power Architecture Processors Targeting Manual, Rev. 10.5.0,
06/2015
Freescale Semiconductor, Inc.
219
Debugging Externally Built Executable Files
The Select file dialog box appears. Use the dialog box to navigate to the executable
file that you want to debug.
9. Select the required file and click Open.
The Select file dialog box closes. The path to the executable file appears in the File
to import text box.
Tip
You can also drag and drop a .elf file in the CodeWarrior
Eclipse IDE. When you drop the .elf file in the IDE, the
Import a CodeWarrior Executable file wizard appears
with the .elf file already specified in the Project Name and
File to Import text box.
10. Check the Copy the selected file to current project folder checkbox to copy the
executable file in the current workspace.
11. Click Next.
The Processor page appears.
12. Select the processor family for the executable file.
13. Select a toolchain from the Toolchain group.
Selected toolchain sets up the default compiler, linker, and libraries used to build the
new project. Each toolchain generates code targeted for a specific platform.
14. Select if the board runs no operation system or imports a Linux kernel project to be
executed on the board. The Target OS options are applicable only for bareboard
application projects.
15. Click Next.
The Debug Target Settings page appears.
16. Select a supported connection type, from the Debugger Connection Types group.
Your selection determines the launch configurations that you can include in your
project.
17. Select the hardware or simulator, you plan to use, from the Board drop-down list.
NOTE
Hardware or Simulators that supports the target processor
selected on the Processors page are only available for
selection.
18. Select the launch configurations that you want to include in your project and the
corresponding connection.
CodeWarrior Development Studio for Power Architecture Processors Targeting Manual, Rev. 10.5.0,
06/2015
220
Freescale Semiconductor, Inc.
Chapter 5 Working with Debugger
19. Select the interface to communicate with the hardware, from the Connection Type
drop-down list.
20. Enter the IP address of the TAP device in the TAP address text box. This option is
disabled and cannot be edited, if you select USB TAP from the Connection Type
drop-down list.
21. Click Next.
The Configurations page appears.
22. Select the processor core that executes the project, from the Core index list.
23. Click Finish.
The Import a CodeWarrior Executable file wizard ends. The project for the
imported .elf file appears in the CodeWarrior Projects view. You can now open
the Debug Configurations dialog box by selecting Run > Debug Configurations.
The Debug Configurations dialog box shows the current settings for the launch
configuration that you just created. A remote system is created with details of all the
connection, initialization, and target parameters you had set while importing the .elf
file.
CodeWarrior Development Studio for Power Architecture Processors Targeting Manual, Rev. 10.5.0,
06/2015
Freescale Semiconductor, Inc.
221
Debugging Externally Built Executable Files
Figure 5-24. Debug Configurations Dialog Box - Launch Configuration for Executable
File
5.17.2 Edit the Launch Configuration
Using the tabs of the Debug Configurations dialog box, you can change the launch
configuration settings that you specified while importing the .elf file.
To edit the launch configuration for your executable file, follow these steps:
1. On the Main tab, click Edit in the Connection panel.
The corresponding Connection page appears.
2. Use the Connection type list box to modify the current connection type.
CodeWarrior Development Studio for Power Architecture Processors Targeting Manual, Rev. 10.5.0,
06/2015
222
Freescale Semiconductor, Inc.
Chapter 5 Working with Debugger
3. Configure the various connection options as appropriate for your executable file by
using the various tabs available on the Connection page.
For example, specify the appropriate target processor, any initialization files, and
connection protocol.
4. Click OK to close the Connection page.
NOTE
For more information on how to modify settings using the
remote system explorer, see CodeWarrior Common
Features Guide from the <CWInstallDir>\PA\Help\PDF\ folder.
5.17.3 Specify the Source Lookup Path
Source lookup path is specified in terms of the compilation path and the local file system
path.
The CodeWarrior debugger uses both these paths to debug the executable file.
The compilation path is the path to the original project that built the executable file. If the
original project is from an IDE on a different computer, you need to specify the
compilation path in terms of the file system on that computer.
The local file system path is the path to the project that the CodeWarrior IDE creates to
debug the executable file.
To specify a source lookup path for your executable file, perform the following steps:
1. Click the Source tab of the Debug Configurations dialog box.
The corresponding page appears.
CodeWarrior Development Studio for Power Architecture Processors Targeting Manual, Rev. 10.5.0,
06/2015
Freescale Semiconductor, Inc.
223
Debugging Externally Built Executable Files
Figure 5-25. Debug Configurations Dialog Box - Source Page
2. Click Add.
The Add Source dialog box appears.
3. Select Path Mapping from the available list of sources.
CodeWarrior Development Studio for Power Architecture Processors Targeting Manual, Rev. 10.5.0,
06/2015
224
Freescale Semiconductor, Inc.
Chapter 5 Working with Debugger
Figure 5-26. Add Source Dialog Box
4. Click OK.
The Add Source dialog box closes. The Path Mappings dialog box appears.
5. In the Name text box, enter the name of the new path mapping.
6. Click Add.
The cursor blinks in the Compilation path column.
7. In the Compilation path column, enter the path to the parent project of the
executable file, relative to the computer that generated the file.
Suppose the computer on which you debug the executable file is not the same
computer that generated that executable file. On the computer that generated the
executable file, the path to the parent project is D:\workspace\originalproject. Enter this
path in the Compilation path text box.
Tip
You can use the IDE to discover the path to the parent
project of the executable file, relative to the computer that
generated the file. In the C/C++ Projects view of the C/C++
perspective, expand the project that contains the executable
file that you want to debug. Next, expand the group that has
the name of the executable file itself. A list of paths
appears, relative to the computer that generated the file.
Search this list for the names of source files used to build
the executable file. The path to the parent project of one of
these source files is the path you should enter in the
Compilation path column.
CodeWarrior Development Studio for Power Architecture Processors Targeting Manual, Rev. 10.5.0,
06/2015
Freescale Semiconductor, Inc.
225
Debugging Externally Built Executable Files
8. In the Local file system path text box, enter the path to the parent project of the
executable file, relative to your computer. Click the ellipsis button to specify the
parent project.
Suppose the computer on which you debug the executable file is not the same
computer that generated that executable file. On your current computer, the path to
the parent project of the executable file is C:\projects\thisproject. Enter this path in
the Local file system path text box.
9. Click OK.
The Path Mapping dialog box closes. The mapping information now appears under
the path mapping shown in the Source Lookup Path list of the Source page.
10. If needed, change the order in which the IDE searches the paths.
The IDE searches the paths in the order shown in the Source Lookup Path list,
stopping at the first match. To change this order, select a path, then click Up or
Down to change its position in the list.
11. Click Apply.
The IDE saves your changes.
5.17.4 Debug Executable File
You can use the CodeWarrior debugger to debug the externally built executable file.
To debug the executable file:
1. Select the project in the CodeWarrior Projects view.
2. Click the Debug button from the IDE toolbar.
The IDE switches to Debug perspective listing the debugging output.
CodeWarrior Development Studio for Power Architecture Processors Targeting Manual, Rev. 10.5.0,
06/2015
226
Freescale Semiconductor, Inc.
Chapter 6
Multi-Core Debugging
This chapter explains how to use the multi-core debugging capability of the CodeWarrior
debugger.
In this chapter:
• Debugging Multi-Core Projects
• Multi-Core Debugging Commands
6.1 Debugging Multi-Core Projects
This section explains how to set launch configurations and how to debug multiple cores
in a multi-core project.
The CodeWarrior debugger provides the facility to debug multiple Power Architecture
processors using a single debug environment. The run control operations can be operated
independently or synchronously. A common debug kernel facilitates multi-core, run
control debug operations for examining and debugging the interaction of the software
running on the different cores on the system.
NOTE
This procedure assumes that you have already created a multicore project, named board_project.
To debug a multi-core project, perform the steps given in the following sections:
• Setting Launch Configurations
• Debugging Multiple Cores
CodeWarrior Development Studio for Power Architecture Processors Targeting Manual, Rev. 10.5.0,
06/2015
Freescale Semiconductor, Inc.
227
Debugging Multi-Core Projects
6.1.1 Setting Launch Configurations
Setting a launch configuration allows you to specify all core-specific initializations.
To set up the launch configurations, follow these steps:
1. Open the CodeWarrior project you want to debug.
2. Switch to the Debug perspective.
3. Select Run > Debug Configurations.
The Debug Configurations dialog box appears (shown in the figure below) with a
list of debug configurations that apply to the current application.
4. Expand the CodeWarrior tree control.
5. From the expanded list, select the debug configuration for which you want to modify
the debugger settings. For example, board_project-core00_RAM_B4860_Download.
Figure 6-1. Debug Configurations Dialog Box
6. On the Main tab, select a connection from the Connection drop-down list.
7. Select a core from the Target list.
8. Click Edit next to the Connection drop-down list.
CodeWarrior Development Studio for Power Architecture Processors Targeting Manual, Rev. 10.5.0,
06/2015
228
Freescale Semiconductor, Inc.
Chapter 6 Multi-Core Debugging
The Properties for <connection> dialog box appears.
Figure 6-2. Properties for <connection> Dialog Box
9. Select a target from the Target drop-down list.
10. Select the required TAP connection from the Connection type drop-down list. For
example, CodeWarrior TAP.
11. On the Connection tab, specify the hostname/IP of the target board in the
Hostname/IP text box.
12. Enter the JTAG clock speed in the JTAG clock speed text box.
13. Specify the port number of the CCS server in the Server port number text box.
CodeWarrior Development Studio for Power Architecture Processors Targeting Manual, Rev. 10.5.0,
06/2015
Freescale Semiconductor, Inc.
229
Debugging Multi-Core Projects
Figure 6-3. Properties for <connection> Dialog Box - Connection Settings
14. Click OK.
15. Click the Debugger tab in the Debug Configurations dialog box.
The Debugger tab page appears.
16. Ensure that the Stop on startup at checkbox is selected and main is specified in the
User specified text box.
17. Click Apply to save the changes.
You have successfully configured a debug configuration.
18. Similarly, configure remaining debug configurations.
NOTE
To successfully debug multiple cores, the connection
settings must be identical for all debug configurations.
CodeWarrior Development Studio for Power Architecture Processors Targeting Manual, Rev. 10.5.0,
06/2015
230
Freescale Semiconductor, Inc.
Chapter 6 Multi-Core Debugging
6.1.2 Debugging Multiple Cores
The CodeWarrior debugger enables system developers to simultaneously develop and
debug applications on a system with multiple processors, within the same debug
environment.
NOTE
Ensure that you have attached a debug probe to the target board
and to the computer hosting the CodeWarrior IDE before
performing the steps listed in this section.
To debug multiple cores, follow these steps:
1. Select a multi-core project in the CodeWarrior Projects view.
2. Select Run > Debug.
The debugger downloads core 0 and switches to the Debug perspective. The
debugger halts execution at the first statement of main(). The Debug view displays all
the threads associated with the core.
Figure 6-4. Multi-Core Debugging - Debug Core 0
3. Download all other cores associated with the project.
4. Select a thread from core 0 in the Debug view.
All the views in the Debug perspective will be updated to display the debug session
for the selected core. The figure below displays the debug session for a selected
thread in core 0.
CodeWarrior Development Studio for Power Architecture Processors Targeting Manual, Rev. 10.5.0,
06/2015
Freescale Semiconductor, Inc.
231
Debugging Multi-Core Projects
Figure 6-5. Viewing Debug Information for Core 0
5. Select and expand the General Purpose Registers group.
6. Select Run > Step Over.
The following actions occur:
• Debugger executes the current statement and halts at the next statement.
• The program counter (PC) indicator moves to the next executable source line in
the Source view.
• In the Debug view, the status of the program changes to (Suspended).
• Modified register values are highlighted in yellow.
7. Select Window > New Window.
Another instance of the Debug perspective opens in a new window. The figure below
displays multiple instances of an active debug session.
CodeWarrior Development Studio for Power Architecture Processors Targeting Manual, Rev. 10.5.0,
06/2015
232
Freescale Semiconductor, Inc.
Chapter 6 Multi-Core Debugging
Figure 6-6. Viewing Multiple Instances of Active Debug Session
8. Select a thread from core 1 in the Debug view of the newly opened Debug <project> window.
All the views in the Debug perspective will be updated to display the debug session
for the selected core.
9. Select and expand the External Debug Registers group.
10. Select Run > Step Over.
The following actions occur:
• Debugger executes the current statement and halts at the next statement.
• The program counter (PC) indicator moves to the next executable source line in
the Source view.
11. Issue several more Step Over commands and watch the register values change.
12. Select main() thread from core 0 again.
Notice that the register values remain unchanged. This is because the CodeWarrior
debugger controls each core's execution individually.
13.
With core 0 still selected, click the Step Over
reach the printf() statement.
button several times until you
Debugger executes the current statement, the following statements, and halts at the
printf() statement.
CodeWarrior Development Studio for Power Architecture Processors Targeting Manual, Rev. 10.5.0,
06/2015
Freescale Semiconductor, Inc.
233
Multi-Core Debugging Commands
14. Switch to the other debug window.
15. Select the main() thread for core 1 by clicking it. Notice that the program counter icon
in the Source view did not move. The debugger controls the execution of each core
individually.
16.
In the Debug view, click the Resume
button.
Core 1 enters an infinite loop. The status of the program changes to (Running).
17.
In the Debug view, click the main() thread for core 0 and click the Resume
button.
Core 0 enters an infinite loop and core 1 continues to execute in its loop.
18.
Select main() thread from core 1 and click the Suspend
button.
The debugger halts core 1 at the current statement and the status of the program
changes to (Halted). Core 0 continues to execute.
19. Select Run > Multicore Terminate.
The debugger terminates the active debug session. The threads associated with each
core in the Debug view disappear.
6.2 Multi-Core Debugging Commands
This section describes the multi-core commands available in the Run menu of
CodeWarrior IDE and in the Debugger Shell.
If you are debugging a multi-core project, you can use single and multi-core debugging
commands to debug parts of each core project.
• Multi-Core Commands in CodeWarrior IDE
• Multi-Core Commands in Debugger Shell
6.2.1 Multi-Core Commands in CodeWarrior IDE
This section describes the multi-core commands in the CodeWarrior IDE.
CodeWarrior Development Studio for Power Architecture Processors Targeting Manual, Rev. 10.5.0,
06/2015
234
Freescale Semiconductor, Inc.
Chapter 6 Multi-Core Debugging
When you start a multi-core debug session, multi-core commands are enabled on the
CodeWarrior IDE Run menu. These commands, when issued, affect all cores
simultaneously. The table below describes each menu choice. For detailed information on
these commands, see CodeWarrior Development Studio Common Features Guide.
Table 6-1. Multi-Core Debugging Commands
Command
Icon
Description
Multicore Resume
Starts all cores of a multi-core system running simultaneously.
Multicore Suspend
Stops execution of all cores of a multi-core system simultaneously.
Multicore Restart
Restarts all the debug sessions for all cores of a multi-core system
simultaneously.
Multicore Terminate
Kills all the debug sessions for all cores of a multi-core system
simultaneously.
Multicore Groups
Use All Cores: If the selected debug context is a multi-core system, then
all cores are used for multi-core operations.
Disable Halt Groups: Disables breakpoint halt groups. For more
information on halt groups, see "Multicore Breakpoint Halt Groups" in
CodeWarrior Development Studio Common Features Guide.
Limit new breakpoints to current group: If selected, all new breakpoints
set during a debug session are reproduced only on cores belonging to the
group of the core on which the breakpoint is set.
Edit Target Types: Opens Target Types dialog box that lets you add and
remove system types.
Edit Multicore Groups: Opens the Multicore Groups dialog box to
create multi-core groups. You can also use this option to modify the
existing multi-core groups.
NOTE
For more information about creating/modifying multi-core
groups, or editing target type, see "Multicore Groups" in
CodeWarrior Development Studio Common Features Guide.
To use the multi-core commands from the Debug perspective, follow these steps:
1. Start a debugging session by selecting the appropriately configured launch
configuration.
2. If necessary, expand the desired core's list of active threads by clicking on the tree
control in the Debug view.
3. Click the thread you want to use with multi-core operations.
4. From the Run menu, specify the multi-core operation to perform on the thread.
NOTE
The keyboard shortcut for the Multicore Resume
operation is Alt+Shift+F8.
CodeWarrior Development Studio for Power Architecture Processors Targeting Manual, Rev. 10.5.0,
06/2015
Freescale Semiconductor, Inc.
235
Multi-Core Debugging Commands
6.2.2 Multi-Core Commands in Debugger Shell
This section describes the multi-core commands in debugger shell.
In addition to the multicore-specific toolbar buttons and menu commands available in the
Debug view, the Debugger Shell has multi-core specific commands that can control the
operation of one or more processor cores at the same time. Like the menu commands, the
multi-core debugger shell commands allow you to select, start, and stop a specific core.
You can also restart or kill sessions executing on a particular core. The table below lists
and defines the affect of each multi-core debugging command.
Table 6-2. Multi-Core Debugging Commands
Command
mc::config
Shortcut
mc::c
Description
List or edit multicore group options.
Syntax
mc::config
mc::go
mc::g
Resume multiple cores
Syntax
mc::go
Examples
mc::go
Resumes the selected cores associated with the current thread context.
mc::group
mc::gr
Display or edit multicore groups
Syntax
group group new <type-name> [<name>] group rename
<name>|<group-index> <new-name>group remove <name>|
<group-index> ... group removeall group enable|disable
<index> ...|all
Examples
mc::group
Shows the defined groups, including indices for use in the mc::group
rename|enable|remove set of commands.
mc::group new 8572
Creates a new group for system type 8572. The group name will be based
on the system name and will be unique. The enablement of the group
elements will be all non-cores enabled, all cores disabled.
mc::group rename 0 "My Group Name"
Renames the group at index 0 to "My Group Name".
mc::group enable 0 0.0
Table continues on the next page...
CodeWarrior Development Studio for Power Architecture Processors Targeting Manual, Rev. 10.5.0,
06/2015
236
Freescale Semiconductor, Inc.
Chapter 6 Multi-Core Debugging
Table 6-2. Multi-Core Debugging Commands (continued)
Command
Shortcut
Description
Enables the group at index 0 and the element at index 0.0 of the
mc::group command.
mc::group remove "My Group Name"
Removes the group named "My Group Name".
mc::group removeall
Removes all groups.
mc::kill
mc::kill
Terminates the debug session for selected cores associated with the
current thread context.
Syntax
mc::kill
Examples
mc::kill
Terminates multiple cores.
mc::reset
mc::reset
Resets multiple cores.
Syntax
mc::reset
mc::restart
mc::restart
Restarts the debug session for selected cores associated with the current
thread context.
Syntax
mc::restart
Examples
mc::restart
Restarts multiple cores.
mc::stop
mc::stop
Stops the selected cores associated with the current thread context.
Syntax
mc::stop
Examples
mc::stop
Suspends multiple cores.
mc::type
mc::t
Shows the system types available for multicore debugging as well as type
indices for use by the mc::type remove and mc::group new
commands.
Syntax
type type import <filename> type remove <filename>|
<type-index> ... type removeall
Examples
mc::type
Display or edit system types.
mc::type import 8572_jtag.txt
Creates a new type from the JTAG configuration file.
CodeWarrior Development Studio for Power Architecture Processors Targeting Manual, Rev. 10.5.0,
06/2015
Freescale Semiconductor, Inc.
237
Multi-Core Debugging Commands
Table 6-2. Multi-Core Debugging Commands
Command
Shortcut
Description
mc::type remove 8572_jtag.txt
Removes the type imported from the specified file.
mc::type removeall
Removes all imported types.
CodeWarrior Development Studio for Power Architecture Processors Targeting Manual, Rev. 10.5.0,
06/2015
238
Freescale Semiconductor, Inc.
Chapter 7
Debugging Embedded Linux Software
This chapter explains how to use the CodeWarrior Development Studio tools to debug
embedded Linux® software for Power Architecture® processors.
NOTE
This chapter documents debugger features that are specific to
the CodeWarrior for Power Architecture Processors product.
For more information on debugger features that are in all
CodeWarrior products, see CodeWarrior Development Studio
Common Features Guide from the <CWInstallDir>\PA\Help\PDF\
folder.
This chapter includes the following sections:
•
•
•
•
•
•
•
•
•
•
•
Debugging a Linux Application
Viewing multiple processes and threads
Debugging applications that use fork() and exec() system calls
Debugging a shared library
Preparing U-Boot for debugging
Debugging U-Boot using NOR, NAND, SPI, and SD Card/MMC Flash Devices
Debugging the Linux Kernel
Debugging Loadable Kernel Modules
Debugging Hypervisor Guest Applications
Debugging the P4080 Embedded Hypervisor
User Space Debugging with On-Chip Debug
7.1 Debugging a Linux Application
This section describes CodeWarrior Target-Resident Kernel (TRK) and provides
information related to using it with CodeWarrior projects.
CodeWarrior Development Studio for Power Architecture Processors Targeting Manual, Rev. 10.5.0,
06/2015
Freescale Semiconductor, Inc.
239
Debugging a Linux Application
For embedded Linux development, CodeWarrior TRK is a user-level application that
resides on target embedded Linux systems and accepts connections from the
CodeWarrior debugger. You use the CodeWarrior remote connections feature to
download and debug applications built with CodeWarrior projects. The CodeWarrior
debugger connects to CodeWarrior TRK on the remote target system through a serial or
ethernet connection.
On embedded Linux systems, CodeWarrior TRK is packaged as a regular Linux
application, named apptrk. This application runs on the remote target system along side
the program you are debugging to provide application-level debug services to the
CodeWarrior debugger.
To debug a Linux application using CodeWarrior TRK:
•
•
•
•
•
Install CodeWarrior TRK on Target System
Start CodeWarrior TRK on Target System
Create a CodeWarrior Download Launch Configuration for the Linux Application
Specify Console I/O Redirections for the Linux Application
Debug the Linux Application
7.1.1 Install CodeWarrior TRK on Target System
This section talks about installation of CodeWarrior TRK on target system.
To connect the CodeWarrior debugger to CodeWarrior TRK, the CodeWarrior TRK
binary executable file must be installed and running on the remote target system. Once
CodeWarrior TRK is running on the target system, the debugger can upload your
application and debug the application on the target system.
NOTE
If CodeWarrior TRK is not present on a given target system,
you need to use a file transfer facility, such as Secure Copy
(SCP) or File Transfer Protocol (FTP) to download the
CodeWarrior TRK binary executable file, AppTRK.elf, to a
suitable location on the file system of the target system. You
also need to place the unstripped versions of the ld.so,
libpthread.so, and libthread_db.so files in the /lib directory of the
target system to debug shared library code or multi-threaded
code with CodeWarrior TRK.
CodeWarrior Development Studio for Power Architecture Processors Targeting Manual, Rev. 10.5.0,
06/2015
240
Freescale Semiconductor, Inc.
Chapter 7 Debugging Embedded Linux Software
7.1.2 Start CodeWarrior TRK on Target System
This section explains how to start CodeWarrior TRK on target system.
How you start CodeWarrior TRK on the target hardware depends on the type of
connection between the host computer and that target hardware:
• Transmission Control Protocol / Internet Protocol (TCP/IP): The host computer
communicates with the target hardware over a TCP/IP connection
• Serial cable: A serial cable connecting the host computer to the target hardware
CodeWarrior TRK can be started as either a root user or a normal user; however, if the
application to be debugged requires root permission, then you need to start CodeWarrior
TRK as a root user. In other words, CodeWarrior TRK must have all the privileges
required by the application that it will debug. You also need to ensure that the download
directory specified in the Remote tab of the launch configuration matches the user
privileges of the CodeWarrior TRK running on the target system.
7.1.2.1 TCP/IP Connections
To start CodeWarrior TRK through a TCP/IP connection:
1. Connect to the remote target system.
a. On the host computer, open a new terminal window.
b. At the command prompt in the terminal window, enter the following command,
where IPAddress represents the target system's IP address:
telnet IPAddress
The telnet client connects to the telnet daemon on the target system.
2. Navigate to the directory that contains the AppTRK.elf binary executable file.
The system changes the current working directory.
3. Type the following command (where Port is the listening port number optionally
specified in the Connections panel of Debug window- typically 1000):
./AppTRK.elf :Port
CodeWarrior TRK starts on the target system, and listens to the specified TCP/IP
port for connections from the CodeWarrior IDE.
CodeWarrior Development Studio for Power Architecture Processors Targeting Manual, Rev. 10.5.0,
06/2015
Freescale Semiconductor, Inc.
241
Debugging a Linux Application
Tip
To continue use of the terminal session after launching
CodeWarrior TRK, start CodeWarrior TRK as a
background process by appending the ampersand symbol
(&) to the launch command. For example, to start
CodeWarrior TRK as a background process listening to
TCP/IP port number 6969, you would enter the following
command:
./AppTRK.elf :6969 &
7.1.2.2 Serial Connections
To launch CodeWarrior TRK through a serial connection:
Tip
To improve your debugging experience, we recommend the
host computer running the IDE have two serial ports. In an
ideal scenario, you would connect one serial port of the host
computer to the first serial port of the target board to monitor
startup and console log messages. You would then connect
another serial port of the host computer to the second serial port
of the target board; the debugger would use this connection to
communicate with CodeWarrior TRK on the target system.
1. Connect a serial cable between the host computer's serial port and the second serial
port of the target system.
2. On the host computer, start a terminal emulation program (such as minicom).
3. Configure the terminal emulation program with baud rate, stop bit, parity, and
handshake settings appropriate for the target system.
4. Connect the terminal emulator to the target system.
A command prompt appears in the terminal emulation program.
5. Boot the system. Log in as the root user.
6. Use the cd command at the command prompt to navigate to the directory where the
CodeWarrior TRK binary executable file, AppTRK.elf, resides on the target system.
The system changes the current working directory.
7. Configure the serial port on which CodeWarrior TRK is going to connect.
a. Enter this command: stty -F /dev/ttyS1 raw
CodeWarrior Development Studio for Power Architecture Processors Targeting Manual, Rev. 10.5.0,
06/2015
242
Freescale Semiconductor, Inc.
Chapter 7 Debugging Embedded Linux Software
This command configures the serial port for raw mode of operation. If you do
not use raw mode, special characters sent as part of packets may be interpreted
(dropped), causing the connection to break.
b. Enter this command: stty
-F /dev/ttyS1 ispeed 115200
The serial input speed is set to 115200 baud.
c. Enter this command: stty
-F /dev/ttyS1 ospeed 115200
The serial output speed is set to 115200 baud.
d. Enter this command: stty
-F /dev/ttyS1 crtscts
The terminal emulation program enables handshake mode
e. Enter this command: stty
-a -F /dev/ttyS1
The system displays the current device settings.
8. Enter the command: ./AppTRK.elf
/dev/ttyS1
CodeWarrior TRK launches on the remote target system.
7.1.3 Create a CodeWarrior Download Launch Configuration for
the Linux Application
This section explains how to create a CodeWarrior download launch configuration for
debugging a Linux application on target system.
To create a CodeWarrior download launch configuration, perform the following steps:
1. In the CodeWarrior Projects view of the C/C++ perspective, select the name of the
project that builds the Linux application.
2. Select Run > Debug Configurations.
The Debug Configurations dialog box appears.
3. Select CodeWarrior on the left-hand side of the Debug Configurations dialog box.
4. Click the New launch configuration toolbar button of the Debug Configurations
dialog box.
The IDE creates a new launch configuration under the CodeWarrior group. The
settings pages for this new launch configuration appear on the right-hand side of the
Debug Configurations dialog box.
CodeWarrior Development Studio for Power Architecture Processors Targeting Manual, Rev. 10.5.0,
06/2015
Freescale Semiconductor, Inc.
243
Debugging a Linux Application
5. In the Main tab of the Debug Configuration dialog box:
a. Select Download from the Debug session type group.
b. Click New next to the Connection drop-down list.
The New Connection wizard appears.
6. Expand the CodeWarrior Application Debugging group and select Linux
AppTRK, as shown in the figure below.
7. Click Next.
Figure 7-1. Remote System - New Connection Wizard
The Linux AppTRK page appears.
8. Specify the connection name, description, template and connection type on this page.
CodeWarrior Development Studio for Power Architecture Processors Targeting Manual, Rev. 10.5.0,
06/2015
244
Freescale Semiconductor, Inc.
Chapter 7 Debugging Embedded Linux Software
9. When you select the connection type, the corresponding Connection tab appears
(shown in the figure below).
Figure 7-2. Remote Linux AppTRK System Connection Page
10. Specify the settings as appropriate for the connection between the host computer and
the target hardware on this page.
11. Click Finish.
The new remote system that you just created appears in the Connection drop-down
list.
12. Click the Debugger tab.
The Debugger options panel appears with the respective tabs.
CodeWarrior Development Studio for Power Architecture Processors Targeting Manual, Rev. 10.5.0,
06/2015
Freescale Semiconductor, Inc.
245
Debugging a Linux Application
13. On the Debug tab, if required, specify a function or address in the application where
you want the program control to stop first in the debug session:
a. Select the Stop on startup at checkbox.
The IDE enables the corresponding text box.
b. Enter in the text box an address or a function inside the application.
14. Click the Remote tab.
The corresponding sub-page comes forward.
15. Enter in the Remote download path text box the path of a target-computer directory
to which the Linux application, running on the target hardware, can read and write
files.
NOTE
The specified directory must exist on the target system.
16. If required, specify information about other executable files to debug in addition to
the Linux application:
a. Click the Other Executables tab.
The corresponding sub-page appears.
b. Use the sub-page settings to specify information about each executable file.
17. Click Apply.
The IDE saves the pending changes you made to the launch configuration.
You just finished creating a CodeWarrior download launch configuration that you can
use to debug the Linux application.
7.1.4 Specify Console I/O Redirections for the Linux Application
CodeWarrior TRK allows you to specify I/O redirections as arguments for applications to
be debugged.
This feature allows users to use a file on the target or even the target console for file
descriptors, including stdin, stdout, and stderr. By default, the CodeWarrior TRK running
on the target forwards the output of the application to the host CodeWarrior. The host
CodeWarrior will be able to print the received output only if the Allocate Console
(necessary for input) checkbox is selected in the Common tab of the Debug
Configurations dialog box.
CodeWarrior Development Studio for Power Architecture Processors Targeting Manual, Rev. 10.5.0,
06/2015
246
Freescale Semiconductor, Inc.
Chapter 7 Debugging Embedded Linux Software
NOTE
The CodeWarrior console, allocated for the debugged
application, can only be used to view the output of the
application running on the target; forwarding the input from a
CodeWarrior console to the debugged application is not
supported currently for Linux applications.
The listing below displays the syntax to specify I/O redirections for the stdin, stdout, and
stderr file descriptors.
Listing 7-1. Specifying I/O Redirections
- '< <filename>' - stdin redirection from <filename>
- '> <filename>' - stdout redirection to <filename>
- '2> <filename>' - stderr redirection to <filename>
To specify I/O redirections for a Linux application:
1. In the CodeWarrior Projects view of the C/C++ perspective, select the name of the
project that builds the Linux application.
2. Select Run > Debug Configurations.
The Debug Configurations dialog box appears.
3. Expand CodeWarrior group and select the launch configuration associated with the
project.
The settings pages for the selected launch configuration appears on the right-hand
side of the Debug Configurations dialog box.
4. Click the Arguments tab.
5. Specify the I/O redirections in the Program arguments text box.
6. Click Apply to save the changes.
The listing below displays an example of redirections, added to the list of arguments, to
forward the output to the console where CodeWarrior TRK was started.
is
-
Listing 7-2. Sample I/O Redirections
'< /proc/self/fd/0' -> use target console for stdin (this way, stdin
functional and can be used - using a CW console it isn't)
'> /proc/self/fd/1' -> use target console for stdout
'2> /proc/self/fd/2' -> use target console for stderr
7.1.5 Configure Linux Process Signal Policy
This section explains how to control applications being debugged using signals and how
to manage signals, using CodeWarrior IDE.
CodeWarrior Development Studio for Power Architecture Processors Targeting Manual, Rev. 10.5.0,
06/2015
Freescale Semiconductor, Inc.
247
Debugging a Linux Application
AppTRK and CodeWarrior can be configured to stop the application being debugged,
whenever the application receives a signal. A user can send signals to the application
directly from CodeWarrior, when the application resumes execution. To send a signal to
an application, right-click the signal name in the Signals view and select Resume With
Signal from the context menu that appears.
7.1.5.1 Signal Inheritance
When a new process is forked, it inherits the signal settings from the parent process. For
example, if a process has a setting that if the SIGUSR1 signal is received, the application
being debugged will be stopped, then a child process forked by this process will also
inherit this setting. It will stop the application being debugged if the SIGUSR1 signal is
received.
All the threads created by a process share the signal settings of that process. Signal
settings cannot be configured at thread level.
7.1.5.2 Default Signal Policy
By default, the SIGINT, SIGILL, SIGTRAP, SIGSTOP, and SIGSEGV signals are
caught by the debugger. The debugger stops the application being debugged if any of
these signals is received.
7.1.5.3 Modifying Signal Policy
CodeWarrior IDE provides a view, Signals, which can be used to view signals and
change the debugger's policy for a signal.
To open the Signals view, perform the following steps:
1. Select Window > Show View > Other in the CodeWarrior IDE.
The Show View dialog box appears.
2. Select Debug > Signals.
The Signals view appears, as shown in the figure below.
CodeWarrior Development Studio for Power Architecture Processors Targeting Manual, Rev. 10.5.0,
06/2015
248
Freescale Semiconductor, Inc.
Chapter 7 Debugging Embedded Linux Software
Figure 7-3. Signals View
To send a signal to a stopped process or thread, right-click the signal in the Signals view
and select Resume With Signal, as shown in the figure below.
Figure 7-4. Sending a Signal to a Process or Thread
To catch a signal, perform the following steps:
1. Right-click the signal in the Signals view and select Signal Properties.
The Properties for window appears (shown in the figure below).
2. Select the Suspend the program when this signal happens checkbox, as shown in
the figure below.
Figure 7-5. Catching a Signal
The figure below shows a child process stopped on receiving the SIGUSR1 signal.
CodeWarrior Development Studio for Power Architecture Processors Targeting Manual, Rev. 10.5.0,
06/2015
Freescale Semiconductor, Inc.
249
Debugging a Linux Application
Figure 7-6. A Stopped Child Process
Some signals cannot be caught, but they can be passed to the debugged application.
These signals have read-only properties. One such signal is SIGKILL.
7.1.6 Debug the Linux Application
You can use the CodeWarrior download launch configuration created earlier to debug the
Linux application on the target system.
To debug the Linux application, perform the following steps:
1. On the left-hand side of the Debug Configurations dialog box, ensure to select the
CodeWarrior download launch configuration that you created to debug the Linux
application.
2. Click Debug in the Debug Configurations dialog box.
The IDE uses the selected CodeWarrior download launch configuration to start a
debug session and opens the Debug view, as shown in the figure below.
Figure 7-7. Debug View - A Sample Linux Application
CodeWarrior Development Studio for Power Architecture Processors Targeting Manual, Rev. 10.5.0,
06/2015
250
Freescale Semiconductor, Inc.
Chapter 7 Debugging Embedded Linux Software
You just finished using the CodeWarrior download launch configuration to debug a
Linux application.
7.2 Viewing multiple processes and threads
This section explains how to view all processes and threads on a target.
When you debug an application, the CodeWarrior debugger opens the Debug view. In
this view, you can see only processes and threads/tasks on which debugger is attached, as
shown in the figure below.
Figure 7-8. Debug view - processes and threads
For Linux debugging, you can view all processes on a target in the System Browser
view.
To view processes and threads in System Browser view:
1. Open a Linux application in the CodeWarrior IDE.
2. Select Run > Debug.
The Debug perspective appears.
3. While the application is running, select Window > Show View > Other.
The Show View dialog box appears.
4. From the Debug group, select System Browser.
5. Click OK.
The System Browser view appears with the process and thread information (shown
in the figure below).
CodeWarrior Development Studio for Power Architecture Processors Targeting Manual, Rev. 10.5.0,
06/2015
Freescale Semiconductor, Inc.
251
Debugging applications that use fork() and exec() system calls
Figure 7-9. System Browser view
7.3 Debugging applications that use fork() and exec() system
calls
This section describes how to use the CodeWarrior debugger to debug programs that
contain fork() and exec() system calls.
The table below describes the fork() and exec() system calls.
Table 7-1. fork() and exec() Description
System Call
Description
fork()
This generic Linux system call creates a new process that is the exact replica of the
process that creates it. This call returns 0 to the child process and returns the PID
(Process ID) of the newly-created child process to the parent process.
exec()
This Linux system call launches a new executable in an already running process. The
debugger destroys the instance of the previous executable loaded into that address
space and a new instance is created.
NOTE
You can also pick up sample Linux applications from the
following folder:
<CWInstallDir>\PA\CodeWarrior_Examples\Linux_Examples
For CodeWarrior debugging purposes, when applications call the fork() system call, the
debugger instead calls the clone() system call with the flag CLONE_PTRACE. This causes:
CodeWarrior Development Studio for Power Architecture Processors Targeting Manual, Rev. 10.5.0,
06/2015
252
Freescale Semiconductor, Inc.
Chapter 7 Debugging Embedded Linux Software
• The operating system to attach CodeWarrior TRK to the child process
• The child process to stop with a SIGTRAP on return from the clone() system call
To make this happen, you must add a static library to your CodeWarrior project. The
source code for building the static library is described later in this section.
Before you start following the steps given in this section, ensure that you have:
• Installed the BSP on Linux
• Created a TCP/IP connection between the host computer and the remote target
• Launched CodeWarrior TRK on the target system
These steps demonstrate how to use the CodeWarrior IDE to debug programs that contain
fork() and exec() system calls:
1. Create a CodeWarrior project with the settings listed in the table below.
Table 7-2. Static Library Project
Settings
Option Name
Value
Project name
Fork
Location
<workspace-dir>\Fork
Project type
Linux application
Language
C
The IDE creates a project with a debug launch configuration.
2. Create a new build configuration. Right-click on the project folder and select Build
Configurations > Manage.
The Fork: Manage Configurations dialog box appears.
3. Rename the default debug configuration to Fork.
4. Click New to create a new build configuration.
The Create New Configuration dialog box appears.
5. In the Name field, enter the configuration name, Fork2clone.
6. From the Copy settings from options, select Existing configuration.
7. Click OK. The Fork: Manage Configurations dialog box appears (shown in the
figure below).
CodeWarrior Development Studio for Power Architecture Processors Targeting Manual, Rev. 10.5.0,
06/2015
Freescale Semiconductor, Inc.
253
Debugging applications that use fork() and exec() system calls
Figure 7-10. Fork: Manage Configurations Dialog Box
8. Activate the Fork2clone build configuration.
9. Build the Fork2clone build configuration by right-clicking it in the CodeWarrior
Projects view and selecting Build Project from the context menu. The CodeWarrior
IDE builds the project and stores the support library, libfork2clone.a, in the Output
directory within the project directory.
NOTE
Remember to build the Fork2clone build configuration
before the Fork build configuration to avoid getting a library
file missing error as the libfork2clone.a is used in the Fork
project.
10. To specify the linker settings and add the support library to the project.
a. Right-click the Fork build configuration in the CodeWarrior Projects view.
b. Select Properties from the context menu. The Properties window for the shared
library project appears.
c. From the C/C++ Build group, select Settings.
d. On the Tool Settings page, from the Power ELF Linker container, select
Libraries.
e. In the Libraries (-l) panel, click Add (
). The Enter Value dialog box
appears.
f. Enter the library file name in the Libraries field.
g. In the Libraries search path (-L) panel, click Add (
). The Add directory
path dialog box appears.
h. Enter the library path in the Directory field, as shown in the figure below.
NOTE
These settings enable the CodeWarrior IDE linker to locate
the shared library libfork2clone.a. For detailed information
on other linker command line arguments, see GNU linker
manuals. You can find GNU documentation here: http://
www.gnu.org.
CodeWarrior Development Studio for Power Architecture Processors Targeting Manual, Rev. 10.5.0,
06/2015
254
Freescale Semiconductor, Inc.
Chapter 7 Debugging Embedded Linux Software
Figure 7-11. Libraries Linker Settings - Fork Project
11. Remove the default main.c file from the project.
12. Add a new db_fork.c file to the project.
13. Enter the below code in the editor window of db_fork.c file.
Listing 7-3. Source Code for db_fork.c
/*
-------------------------User Include files
--------------------------
*/
#include "db_fork.h"
/*
------------------------Main Program
------------------------*/
int __libc_fork(void)
{
CodeWarrior Development Studio for Power Architecture Processors Targeting Manual, Rev. 10.5.0,
06/2015
Freescale Semiconductor, Inc.
255
Debugging applications that use fork() and exec() system calls
return( __db_fork() );
}
extern __typeof (__libc_fork) __fork __attribute__ ((weak, alias
("__libc_fork")));
extern __typeof (__libc_fork) fork __attribute__ ((weak, alias
("__libc_fork")));
14. Create a header file db_fork.h in your project directory and add the below code in the
header file.
Listing 7-4. Source Code for db_fork.h
#include <asm/unistd.h>
#include <sys/syscall.h>
#include <errno.h>
#include <signal.h>
#include <sched.h>
#define __NR___db_clone__NR_clone
#define __db_fork()
syscall(__NR___db_clone, SIGCHLD | CLONE_PTRACE, 0);
15. Enter the below code in the editor window of fork.c file.
Listing 7-5. Source Code for fork.c
/*
/*
*
fork.c
*
*/
/*------------------------------------------------------------------*
System Include files
*-----------------------------------------------------------------*/
#include <stdio.h>
#include <unistd.h>
#include <stdlib.h>
#include <sys/ptrace.h>
#include <sys/errno.h>
#include <sys/types.h>
#include <signal.h>
#include <sched.h>
#include <fcntl.h>
#include <dlfcn.h>
/*-------------------------------------------------------------------*
Function Prototypes
CodeWarrior Development Studio for Power Architecture Processors Targeting Manual, Rev. 10.5.0,
06/2015
256
Freescale Semiconductor, Inc.
Chapter 7 Debugging Embedded Linux Software
* -----------------------------------------------------------------*/
int fn1(int j);
int fn2(int i);
/*------------------------------------------------------------------*
Global Variables
*------------------------------------------------------------------*/
int gint;
/*------------------------------------------------------------------*
Main Program
*-----------------------------------------------------------------*/
int main(void)
{
int pid,x;
int shared_local;
printf( "Fork Testing!\r\n" );
fflush( stdout );
gint = 5;
shared_local =5;
pid = fork();
if(pid == 0)
{
x=0;
gint = 10;
shared_local = fn1(9);
printf("\nForked : Child");
printf("\nChild:Global=%d,Shared_Local=%d",gint,shared_local);
printf("\nChild pid = %d, parent pid =%d \n", getpid(),getppid());
fflush( stdout );
}
else
{
x=0;
gint = 12;
shared_local = fn2(11);
printf("\nForked : Parent");
CodeWarrior Development Studio for Power Architecture Processors Targeting Manual, Rev. 10.5.0,
06/2015
Freescale Semiconductor, Inc.
257
Debugging applications that use fork() and exec() system calls
printf("\nParent:Global=%d,Shared_Local=%d",gint,shared_local);
printf("\nParent pid = %d, Parent's parent pid =%d \n",
getpid(),getppid());
fflush( stdout );
}
return 0;
}
int fn1(int j)
{
j++;
return j;
}
int fn2(int i)
{
i++;
return i;
}
The code of the parent process creates a forked process (child process) when the
__db_fork function executes. The debugger opens a separate thread window for the
child process. When the child process finishes executing, the debugger closes the
thread window. To debug the code of the child process, you need to set a breakpoint
in the child process code. You can debug the code of the child process the same way
you debug code of any other process.
16. Create another project, Exec, and create two new build configurations with the
following settings:
Table 7-3. Exec Example Project
Settings
Option Name
Value
Project name
Exec
Location
<workspace-dir>\Exec
Project type
Linux application
Language
C
Build configurations
• Exec
• Exec-1
CodeWarrior Development Studio for Power Architecture Processors Targeting Manual, Rev. 10.5.0,
06/2015
258
Freescale Semiconductor, Inc.
Chapter 7 Debugging Embedded Linux Software
17. Add the source files exec.c and exec-1.c to the Exec project.
• exec.c: The code demonstrating exec() functionality
• exec-1.c: Generates the executable file exec-1.elf
As you step through the code of the exec.elf file, the exec() function call executes and
a separate debugger window for the exec-1.elf appears. You can perform normal
debug operations in this window. The debugger destroys the instance of the previous
file (exec.elf) and creates a new instance for the exec-1.elf file.
18. Enter the below code in the editor window of Exec.c file.
Listing 7-6. Source Code for Exec.c
/**
*
*
*/
Exec.c
Demonstrates Exec system call functionality
/*------------------------------------------------------------------------------*
System Include files
*------------------------------------------------------------------------------*/
#include <stdio.h>
#include <unistd.h>
/*------------------------------------------------------------------------------*
Constant Defintions
*------------------------------------------------------------------------------*/
#define EXEC_1
"/tmp/Exec-1.elf"
/*------------------------------------------------------------------------------*
Main Program
*------------------------------------------------------------------------------*/
int main(void)
{
char *argv[2];
printf("Exec Testing!\r\n" );
printf("Before exec my ID is %d\n",getpid());
printf("My parent process's ID is %d\n",getppid());
fflush( stdout );
}
/*Calling another program exec-1.elf*/
argv[0] = EXEC_1;
argv[1] = NULL;
printf("exec starts\n");
execv(argv[0],argv);
printf("This will not print\n");
fflush( stdout );
return 0;
19. Enter the below code in the editor window of Exec-1.c file.
Listing 7-7. Source Code for Exec-1.c
/** Exec-1.c *
Demonstrates Exec system call functionality */
/*-------------------------------------------------------------------*
System Include files
*-------------------------------------------------------------------*/
#include <stdio.h>
#include <unistd.h>
/*-------------------------------------------------------------------*
Main Program
*-------------------------------------------------------------------*/
int main(void){
CodeWarrior Development Studio for Power Architecture Processors Targeting Manual, Rev. 10.5.0,
06/2015
Freescale Semiconductor, Inc.
259
Debugging applications that use fork() and exec() system calls
}
printf("After exec my process ID is %d\n",getpid());
printf("My parent process's ID is %d\n",getppid());
printf("exec ends\n");
fflush( stdout );
return 0;
20. Create the build configurations for building Exec.elf and Exec-1.elf (similar to
creating the build configurations for the Fork project).
21. Build Exec project.
a. Select the Exec build configuration, if not selected.
b. Select Project > Build Project.
The CodeWarrior IDE generates the exec.elf, and exec-1.elf executable files and
places them in the project folder.
22. Specify the remote download path of the executable files to be launched by the exec()
system call.
a. Select Run > Debug Configurations to open the Debug Configurations dialog
box.
b. In the left panel from the CodeWarrior group, select the Exec launch
configuration.
c. On the Debugger page, click the Remote tab.
d. Type /tmp in the Remote Download Path field, as shown in the figure below.
This specifies that the final executable file will be downloaded to this location on
the target platform for debugging.
NOTE
In the current example, the remote download path is
specified as /tmp. If you wish, you may specify an alternate
remote download path for the executable file.
Figure 7-12. Remote Download Path - Shared Library Project
23. Specify the host-side location of the executable files to be launched by the exec()
system call.
a. Click the Other Executables tab.
b. Click Add. The Debug Other Executable dialog box appears.
CodeWarrior Development Studio for Power Architecture Processors Targeting Manual, Rev. 10.5.0,
06/2015
260
Freescale Semiconductor, Inc.
Chapter 7 Debugging Embedded Linux Software
Click File System. The Open dialog box appears.
Navigate to the location of the exec-1.elf file in your project directory.
Select the exec-1.elf file name.
Click Open. The host-side location of exec-1.elf appears in the Additional
Executable File text box.
g. Select the Load Symbols checkbox.
h. Select the Download to Device checkbox. The Specify the remote download
path field is activated.
c.
d.
e.
f.
NOTE
If you do not want to download the selected file on the
target platform, do not select the Download to Device
checkbox.
i. Type /tmp in the Remote download path text box. The shared library will be
downloaded to this location when you debug or run the executable file.
j. Click OK. The settings are saved.
24. Click Apply to save the settings made to the launch configuration.
25. Set breakpoints in the child and parent processes.
a. Double-click the fork.c file name in the CodeWarrior Projects view.
b. Set a breakpoint in the code of the child process at this line: x=0;
c. Set a breakpoint in the code of the parent process.
d. Close the fork.c file.
26. Select Run > Debug.
The debugger window appears and the Fork project starts debugging. As a result, the
Fork.elf and libfork2clone.a files are downloaded on the target system.
27. Step over the code until you reach the line of code that calls the fork() system call:
pid = fork ();
When the fork() system call is called, the child process debugger window appears.
You can now perform normal debugging operations in this window.
28. Step over the code in the child process debugger window a couple of times.
29. Next, step over the code in the parent process debugger window a couple of times.
NOTE
The console window of the parent process is shared by the
child process.
30.
31.
32.
33.
Terminate the debug session.
Clear previously set breakpoints.
Select Run > Debug for Exec project.
Set a breakpoint in the Exec.c file on the line containing the execv() function call.
CodeWarrior Development Studio for Power Architecture Processors Targeting Manual, Rev. 10.5.0,
06/2015
Freescale Semiconductor, Inc.
261
Debugging a shared library
34. Click Resume. The target stops at the line where you set the breakpoint.
35. Click Resume. The exec() call is executed and the debugger stops in the main()
function of the Exec-1.elf file.
36. Execute some steps in Exec-1.c file.
37. Terminate the debug session and remove all breakpoints.
7.4 Debugging a shared library
CodeWarrior allows you to do source-level debugging of shared libraries. When you
debug an executable file using a shared library, you can step into the shared library code.
This section demonstrates how to debug a shared library that is implicitly linked to an
application.
In this section:
•
•
•
•
•
•
•
Create an example project
Configure the shared library build configuration
Configure the executable build configuration
Build the shared library
Build the executable
Configure the launch configuration
Debug the shared library
7.4.1 Create an example project
First of all, you need to create an example Linux project that uses a shared library.
To create an example Linux project, perform the following steps:
1. In the CodeWarrior IDE, use File > New > CodeWarrior Linux Project Wizard to
create a new Linux project with the settings given in the table below.
NOTE
Instead of creating a new Linux project, you can import an
example Linux project, SharedLibrary, available in the
<CWInstallDir>\PA\CodeWarrior_Examples\Linux_Examples\ folder
as a reference. The example project can be imported as a
CodeWarrior Development Studio for Power Architecture Processors Targeting Manual, Rev. 10.5.0,
06/2015
262
Freescale Semiconductor, Inc.
Chapter 7 Debugging Embedded Linux Software
CodeWarrior Example Project using the File > Import
menu bar option.
Table 7-4. Example Project
Settings
Option Name
Value
Project name
SharedLibraryExample
Location
<workspace-dir>\SharedLibraryExample
Project type
Linux application
Language
C
Build configurations
• LibExample (generates the dynamic library needed by the launch
configurations)
• SharedLib_IM (used to demonstrate implicit linking with the library
generated by LibExample build configuration)
Launch configurations
SharedLib_IM (launches the application that demonstrates implicit linking
with a shared library)
NOTE
In the current example, only implicit library linking is
mentioned; however, in the example project shipped with
CodeWarrior, SharedLibrary, we have also demonstrated
explicit library loading. For explicit library loading, we
have used another build/launch configuration, SharedLib_EX.
2. Remove the default main.c file and add the source files (SharedLib_IM.c and
LibExample.c) to your project.
3. In the CodeWarrior IDE, create a header file, LibExample.h, as depicted in the listing
below.
Listing 7-8. Source Code for LibExample.h
/* LibExample.h */
int add_example(int x,int y);
int add_example_local(int x,int y);
4. Save the LibExample.h file in the project directory.
5. Enter the below code into the editor window of the SharedLib_IM.c file.
Listing 7-9. Source Code for SharedLib_IM.c
/*
Sharedlib_IM.c
Demonstrates implicit linking.
*/
// User Include files
#include "LibExample.h"
// function prototype declaration
CodeWarrior Development Studio for Power Architecture Processors Targeting Manual, Rev. 10.5.0,
06/2015
Freescale Semiconductor, Inc.
263
Debugging a shared library
int temp (int, int);
// main program
int main ()
{
int ret;
int a, b;
a = 10;
b = 20;
ret = temp (a, b);
ret = add_example (a, b);
// step in here
return ret;
}
int temp(int i, int j)
{
return i + j;
}
6. Enter the below code into the editor window of the LibExample.c file.
Listing 7-10. Source Code for LibExample.c
/*
LibExample.c
*/
// user include files#include "LibExample.h"// functions definitions
int add_example( int x, int y)
{
int p,q;
p=100;
q=p+200;
add_example_local (2, 3);
// step in here
return x+y+q;
}
int add_example_local (int x, int y)
{
int p,q;
p = 100;
q = p + 200;
CodeWarrior Development Studio for Power Architecture Processors Targeting Manual, Rev. 10.5.0,
06/2015
264
Freescale Semiconductor, Inc.
Chapter 7 Debugging Embedded Linux Software
return x + y + q;
}
7.4.2 Configure the shared library build configuration
The next action is to configure the LibExample build configuration, which generates
libexample.so.
The steps are given below:
1. Select the SharedLibraryExample project in the CodeWarrior Projects view.
2. Select the LibExample build configuration by selecting Project > Build
Configurations > Set Active > <Build Configuration Name>.
3. Check LibExample.c and LibExample.h in the Build column.
Tip
Use the CodeWarrior example project, SharedLibrary, as a
reference to set up the build configuration settings of the
LibExample build configuration.
7.4.3 Configure the executable build configuration
Now, you need to set up the SharedLib_IM build configuration.
The steps are given below:
1. Select the SharedLibraryExample project in the CodeWarrior Projects view.
2. Select the SharedLib_IM build configuration by selecting Project > Build
Configurations > Set Active > <Build Configuration Name>.
3. Specify the linker settings.
a. Select the SharedLib_IM build configuration in the CodeWarrior Projects view.
b. Select Project > Properties. The Properties window for the shared library
project appears.
c. In the Tool settings page, from the Power ELF Linker container, select
Libraries.
d. In the Libraries (-l) panel, click Add (
). The Enter Value dialog box
appears.
e. Enter the library file name, example, in the Libraries field.
CodeWarrior Development Studio for Power Architecture Processors Targeting Manual, Rev. 10.5.0,
06/2015
Freescale Semiconductor, Inc.
265
Debugging a shared library
f. In the Libraries (-L) panel, click Add (
). The Add directory path dialog
box appears.
g. Enter the library path in the Directory field. The library path is the path of the
Output directory that is used by LibExample build configuration.
NOTE
These settings enable the CodeWarrior IDE linker to
locate the shared library, libexample.so. For detailed
information on other linker command line arguments,
see GNU linker manuals. You can find GNU
documentation here: http://www.gnu.org.
7.4.4 Build the shared library
The next action is to build the shared library.
To build the shared library, perform the following steps:
1. Select the SharedLibraryExample project in the CodeWarrior Projects view.
2. Select the LibExample build configuration by selecting Project > Build
Configurations > Set Active > <Build Configuration Name>.
3. Select Project > Build Project. The CodeWarrior IDE builds the project and stores
the output file libexample.so in the Output directory within the project directory.
7.4.5 Build the executable
Now, you need to build the executable that uses the shared library.
To build the executable, perform the following steps:
1. Select the SharedLibraryExample project in the CodeWarrior Projects view.
2. Select the SharedLib_IM build configuration by selecting Project > Build
Configurations > Set Active > <Build Configuration Name>.
Tip
You can also select a build configuration from the dropdown list that appears when you click the down arrow next
to the project name in the CodeWarrior Projects view.
CodeWarrior Development Studio for Power Architecture Processors Targeting Manual, Rev. 10.5.0,
06/2015
266
Freescale Semiconductor, Inc.
Chapter 7 Debugging Embedded Linux Software
3. Select Project > Build Project. The CodeWarrior IDE builds the project and stores
the output file SharedLib_IM.elf in the Output directory within the project directory.
7.4.6 Configure the launch configuration
The next action is to configure the SharedLib_IM launch configuration.
You can configure the SharedLib_IM launch configuration by:
1. Specifying the remote download path of the final executable file.
2. Specifying the host-side location of the executable file to be used for debugging the
shared library.
3. Specifying the environment variable that enables the shared object loader to locate
the shared library on the remote target at run time.
Following are complete steps of configuring a launch configuration:
1. Activate the SharedLib_IM launch configuration in the project.
2. Specify the remote download path of the final executable file.
a. Select Run > Debug Configurations to open the Debug Configurations dialog
box.
b. In the left pane from the CodeWarrior group, select the SharedLib_IM launch
configuration.
c. On the Debugger page, click the Remote tab.
d. Type /tmp in the Remote Download Path field, as shown in the figure below.
This specifies that the final executable file will be downloaded to this location on
the target platform for debugging.
NOTE
In the current example, the remote download path is
specified as /tmp. You can replace /tmp with any other
directory for which CodeWarrior TRK has the
necessary access permissions.
CodeWarrior Development Studio for Power Architecture Processors Targeting Manual, Rev. 10.5.0,
06/2015
Freescale Semiconductor, Inc.
267
Debugging a shared library
Figure 7-13. Remote Download Path - Shared Library Project
3. Specify the host-side location of the executable file to be used for debugging the
shared library.
a. Click the Other Executables tab in the Debugger page.
b. Click Add. The Debug Other Executable dialog box appears.
c. Click Workspace. The Open dialog box appears.
d. Navigate to the location where you have stored the libexample.so file in your
project directory.
e. Select the libexample.so file name.
f. Click Open. The host-side location of the shared library appears in the Specify
the location of the other executable field.
g. Select the Load Symbols checkbox, so that the debugger has visibility of
symbols within the library.
h. Select the Download to Device checkbox. The Specify the remote download
path field is activated.
i. Type /tmp in the Remote download path text box. The shared library will be
downloaded to this location when you debug or run the executable file.
The default location of shared libraries on the embedded Linux operating system
is /usr/lib. In the current example, the remote download location of libexample.so
is /tmp.
j. Click OK. The settings (shown in the figure below) are saved.
CodeWarrior Development Studio for Power Architecture Processors Targeting Manual, Rev. 10.5.0,
06/2015
268
Freescale Semiconductor, Inc.
Chapter 7 Debugging Embedded Linux Software
Figure 7-14. Debug Other Executable Dialog Box
4. Specify the environment variable that enables the shared object loader to locate the
shared library on the remote target at run time.
At run time, the shared object loader first searches for a shared library in the path
specified by the LD_LIBRARY_PATH environment variable's value. In this case, the value
of this environment variable will be /tmp, which is the remote download path for the
shared library you specified in the Debug Other Executable dialog box. If you have
not specified the environment variable or have assigned an incorrect value, the
shared object loader searches for the shared library in the default location /usr/lib.
a.
b.
c.
d.
In the Debug window, click Environment to open the Environment page.
Click New to open the New Environment Variable dialog box.
In the Name field, type LD_LIBRARY_PATH.
In the Value field, type /tmp.
NOTE
Ensure that you type the same remote download path in
the Value field that you specified in the Debug Other
Executable dialog box.
e. Click OK. The environment variable is added to the launch configuration.
f. Add another environment variable with name, AVOID_SYSTEM_PATH and value YES.
NOTE
The AVOID_SYSTEM_PATH variable sets the launch
configuration to use the library path settings you
specify. By specifying the value YES you avoid the
launch configuration from picking up any other system
path.
CodeWarrior Development Studio for Power Architecture Processors Targeting Manual, Rev. 10.5.0,
06/2015
Freescale Semiconductor, Inc.
269
Debugging a shared library
g. Click Apply to save the launch configuration settings. The target settings are
saved (shown in the figure below).
Figure 7-15. Environment Variables - Shared Library Project
h. Click OK to close the Debug view.
7.4.7 Debug the shared library
Finally, you need to debug the shared library.
In the steps that follow, you will launch the debugger. Next, you will step through the
code of the executable file, SharedLib_IM.elf, until you reach the code that makes a call to
the add_example function implemented in the shared library. At this point, you will step
into the code of the add_example function to debug it.
1. Activate the SharedLib_IM launch configuration in the project.
2. Select Run > Debug.
The debugger starts and downloads the SharedLib_IM.elf and libexample.so files to the
specified location on the remote target, one after another. The Debug perspective
appears.
3. Click Step Over in the debugger window until you reach the following line of code
(shown in the figure below):
ret=add_example(a,b)
Tip
Before you set breakpoints in the code of an imported
shared library to step into the code, you can use the
Executables view to navigate and check the source files of
the library. For more information on the Executables view,
CodeWarrior Development Studio for Power Architecture Processors Targeting Manual, Rev. 10.5.0,
06/2015
270
Freescale Semiconductor, Inc.
Chapter 7 Debugging Embedded Linux Software
open CodeWarrior Eclipse Help by selecting Help > Help
Contents in the CodeWarrior IDE, and then select Third
Party References > C/C++ Development User Guide >
Reference > C/C++ Views and Editors > Executables
view in the Contents pane.
Figure 7-16. SharedLib_IM.c - Step In Location
4. In the Debug view, click Step Into to step into the code of the add_example function.
The debugger steps into the source code of the add_example function in the LibExample.c
file (shown in the figure below).
Figure 7-17. LibExample.c - add_example Function
5. After stepping in, you can step through the rest of the code.
CodeWarrior Development Studio for Power Architecture Processors Targeting Manual, Rev. 10.5.0,
06/2015
Freescale Semiconductor, Inc.
271
Preparing U-Boot for debugging
The Debug view shows the function calls to the add_example function (shown in the
figure below).
Figure 7-18. Debug View - Shared Library Project
6. View the output of the program.
The rest of the code is executed and the output appears in the Variables view (shown
in the figure below).
Figure 7-19. Variables View - Shared Library Project
7.5 Preparing U-Boot for debugging
U-Boot resides in flash memory on target systems and boots an embedded Linux image
developed for those systems.
Before debugging U-Boot on a target system, follow these steps:
CodeWarrior Development Studio for Power Architecture Processors Targeting Manual, Rev. 10.5.0,
06/2015
272
Freescale Semiconductor, Inc.
Chapter 7 Debugging Embedded Linux Software
1.
2.
3.
4.
5.
6.
Install BSP.
Configure U-Boot and build U-Boot images with CodeWarrior debugger support.
Configure hardware to use U-Boot image.
Create a CodeWarrior project to debug U-Boot
Specify launch configuration settings
Create launch configurations for U-Boot debug stages
7.5.1 Install BSP
Install the board support package (BSP) for the target system you want to debug on the
Linux host computer.
NOTE
The BSP versions keep changing frequently. For different BSP
versions, you might encounter build environments based on
various tools. The subsequent sections will describe necessary
procedures and use specific examples from real Freescale BSPs
for illustration. The examples in these sections need to be
adapted based on the BSP versions or build tools you are
currently using.
Follow these steps to install the BSP:
1. On the Linux computer, download the BSP for your target hardware to install kernel
files and Linux compiler toolchains on your system.
BSP image files for target boards are located at http://www.freescale.com/linux.
2. Download the BSP image file for your target board.
NOTE
You will need to log-in or register to download the BSP
image file.
The downloaded image file has an .iso extension. For example,
QorIQ-DPAA-SDK-<yyyymmdd>-yocto.iso
3. Mount the image file to the CDROM as root, or using "sudo":
<sudo> mount -o loop QorIQ-DPAA-SDK-<yyyymmdd>-yocto.iso/mnt/cdrom
CodeWarrior Development Studio for Power Architecture Processors Targeting Manual, Rev. 10.5.0,
06/2015
Freescale Semiconductor, Inc.
273
Preparing U-Boot for debugging
NOTE
sudo is a Linux utility that allows users to run applications
as root. You need to be setup to run sudo commands by your
system administrator to mount and install the BSPs.
4. Execute the BSP install file to install the build tool files to a directory of your choice,
where you have privileges to write files:
/mnt/cdrom/install
NOTE
The BSP must be installed as a non-root user, otherwise the
install will exit.
5. Answer the questions from the installation program until the file copy process
begins.
You will be prompted to input the required build tool install path. Ensure you have
the correct permissions for the install path.
6. Upon successful installation, you will be prompted to install the ISO for the core(s)
you want to build.
For example, if you want to build the SDK for P4080, that is a e500mc core, then
you have to install the ISO images for e500mc core:
c23174e5e3d187f43414e5b4420e8587 QorIQ-SDK-V1.2-PPCE500MC-20120603-yocto.iso.part1
292c6e1c5e97834987fbdb5f69635a1d QorIQ-SDK-V1.2-PPCE500MC-20120603-yocto.iso.part2
NOTE
You can see the SDK Manual for instructions about how to
build the BSP images and run different scenarios from the
iso/help/documents/pdf location.
7.5.2 Configure U-Boot and build U-Boot images with
CodeWarrior debugger support
After installing the BSP, you need to configure the BSP U-Boot package, to place
debugger symbolic information in the U-Boot binary executable file, and build the UBoot images with CodeWarrior debugger support, on the Linux host computer.
For more information on configuring the U-Boot and building U-Boot images, see the
SDK User Manual available in the iso/help/documents/pdf folder.
CodeWarrior Development Studio for Power Architecture Processors Targeting Manual, Rev. 10.5.0,
06/2015
274
Freescale Semiconductor, Inc.
Chapter 7 Debugging Embedded Linux Software
7.5.3 Configure hardware to use U-Boot image
To configure the hardware to use U-Boot image, you need to burn the U-Boot image to
the flash memory of the hardware.
NOTE
See the Burning U-Boot to Flash cheat sheet for the entire
procedure for burning U-Boot to flash. To access the cheat
sheets, select Help > Cheat Sheets from the CodeWarrior IDE
menu bar.
7.5.4 Create a CodeWarrior project to debug U-Boot
Create a new CodeWarrior project to debug U-Boot on the target system.
To create a CodeWarrior project, use these steps:
1.
2.
3.
4.
Launch CodeWarrior IDE.
Select File > Import. The Import wizard appears.
Expand the CodeWarrior group and select CodeWarrior Executable Importer.
Click Next.
The Import a CodeWarrior Executable file page appears.
5. Specify a name for the project, to be imported, in the Project name text box.
6. If you do not want to create your project in the default workspace:
a. Clear the Use default location checkbox.
b. Click Browse and select the desired location from the Browse For Folder
dialog box.
c. In the Location text box, append the location with the name of the directory in
which you want to create your project.
NOTE
An existing directory cannot be specified for the project
location.
7. Click Next.
The Import C/C++/Assembler Executable Files page appears.
8. Click Browse next to the Executable field.
CodeWarrior Development Studio for Power Architecture Processors Targeting Manual, Rev. 10.5.0,
06/2015
Freescale Semiconductor, Inc.
275
Preparing U-Boot for debugging
9. Select the U-Boot ELF file obtained after the U-Boot compilation.
NOTE
You can see the SDK Manual, for instructions about how to
generate an U-Boot ELF file, from the iso/help/
documents/pdf location.
10. Click Open.
11. From the Processor list, expand the processor family and select the required
processor.
12. Select Bareboard Application from the Toolchain group.
The selected toolchain sets up the default compiler, linker, and libraries used to build
the new project.
13. Select None from the Target OS list.
14. Click Next.
The Debug Target Settings page appears.
15. From the Debugger Connection Types list, select the required connection type.
16. Specify the settings, such as board, launch configuration, connection type, and TAP
address if you are using CodeWarrior TAP (over Ethernet), Ethernet TAP, or Gigabit
TAP.
17. Click Next.
The Configurations page appears.
18. From the Core index list, select Core 0.
19. Click Finish.
The wizard creates a CodeWarrior project to debug the U-Boot image.
You can access the project from the CodeWarrior Projects view on the workbench.
7.5.5 Specify launch configuration settings
Now, you need to specify the settings for the newly created Attach launch configuration
in the Debug Configuration dialog box.
To specify launch configuration settings, follow these steps:
1. Select Run > Debug Configurations.
CodeWarrior Development Studio for Power Architecture Processors Targeting Manual, Rev. 10.5.0,
06/2015
276
Freescale Semiconductor, Inc.
Chapter 7 Debugging Embedded Linux Software
2. On the Main tab, if you have an already existing system for the attach configuration,
select it from the Connection drop-down list, else create a new one by following the
steps given below:
a. Click New. The New Connection wizard appears.
b. Expand the CodeWarrior Bareboard Debugging group and select Hardware
or Simulator Connection.
c. Click Next. The Hardware or Simulator Connection page appears.
d. Specify a name and a description for the connection.
e. Click New next to the Target drop-down list. The New Connection wizard
appears.
f. Expand the CodeWarrior Bareboard Debugging group and select Hardware
or Simulator System.
g. Click Next.
h. Select a processor from the Target type drop-down list.
i. On the Initialization tab, clear the Execute reset checkbox.
j. Select the checkbox for the respective core in the Initialize target column.
k. Click the ellipsis button in the Initialize target column.
The Initialization target dialog box appears.
l. Click File System and select the target initialization file from the following path:
<CWInstallDir>\PA\PA_Support\Initialization_Files
NOTE
If you want to use an initialization file that initializes
CCSR and PIXIS before U-Boot, you can uncomment
the specific lines in the
<board_name>_uboot_<numbits>.tcl initialization file,
where <numbits> can be 32 or 36.
m. Based on the target you select, you may also have to specify the memory
configuration file details by selecting the Memory Configuration checkbox on
the Memory tab.
n. Click the ellipsis button in the Memory Configuration column.
The Memory Configuration dialog box appears.
o. Click File System and select the memory configuration file from the following
path:
<CWInstallDir>\PA\PA_Support\Initialization_Files\Memory
p. Click Finish.
q. From the Connection type drop-down list, select the type of connection you
plan to use.
CodeWarrior Development Studio for Power Architecture Processors Targeting Manual, Rev. 10.5.0,
06/2015
Freescale Semiconductor, Inc.
277
Preparing U-Boot for debugging
The Connection tab appears along with the other tabs on the page.
3.
4.
5.
6.
7.
8.
r. On the Connection tab, specify the IP address of the TAP.
s. Click Finish.
t. From the System panel, select all the cores on which U-Boot is running.
Click the Debugger tab.
On the PIC page, select the Alternate Load Address checkbox.
In the text box that comes up, enter the 0xFFF40000 address.
Click the Source tab and verify the source mapping configuration.
Click Apply to save the settings made to the various tabs.
Click Debug.
The Debug perspective appears with the core 0 stopped at the reset vector (shown in
the figure below).
NOTE
You will need to press Reset in the Debug view. Select the
Core reset checkboxes for all cores except core 0. You will
then see core 0 stopped at the reset vector.
Figure 7-20. Debug Perspective - U-Boot Debug
7.5.6 Create launch configurations for U-Boot debug stages
Finally, you need to create launch configurations for different U-Boot debug stages.
CodeWarrior Development Studio for Power Architecture Processors Targeting Manual, Rev. 10.5.0,
06/2015
278
Freescale Semiconductor, Inc.
Chapter 7 Debugging Embedded Linux Software
During a typical U-Boot start-up sequence, the target processor starts executing U-Boot
in flash memory. U-Boot then enables the Memory Management Unit (MMU), and
relocates itself to RAM. From the memory layout perspective, U-Boot debug has four
different stages. For each of these stages, you will need a separate launch configuration.
You have already configured the launch configuration settings for the first stage in the
P4080 U-Boot Stage 1 launch configuration.
To create launch configurations for the remaining three stages for U-Boot debug:
NOTE
Create these launch configurations only if you are using the
hardware option to debug U-Boot.
1. To open the Remote Systems view, select Window > Show View > Other.
The Show View dialog box appears.
2. Expand the Remote Systems group and select Remote Systems.
The Remote Systems view appears as a tabbed view at the bottom of the workbench.
3. Select the P4080 U-Boot Stage 1 remote system from the view.
4. Right-click and from the context menu select Copy.
The Copy Resource dialog box appears.
5. Select the active profile from the list. Click OK.
The Duplicate Name Collision message box appears.
6. Select the Rename option.
The Rename to text box is enabled.
7. Enter the name for the copied remote system. For example, P4080DS
u-boot mem
translation.
The new remote system appears in the Remote Systems view.
NOTE
This remote system will be used in the second stage of UBoot debug.
8. Right-click P4080DS
menu.
u-boot mem translation
and select Properties from the context
The Properties for P4080DS u-boot mem translation window appears.
9. On the System tab, select the checkbox for the respective core in the Memory
configuration column.
CodeWarrior Development Studio for Power Architecture Processors Targeting Manual, Rev. 10.5.0,
06/2015
Freescale Semiconductor, Inc.
279
Debugging U-Boot using NOR, NAND, SPI, and SD Card/MMC Flash Devices
10. Click the ellipsis button in the Memory configuration file column.
The Memory Configuration File dialog box appears.
11. Click File System and select the memory configuration file from this path:
12.
13.
14.
15.
16.
<CWInstallDir>\PA\PA_Support\Initialization_Files\Memory\${BoardName}_uboot_${bits}_$
{FlashDevice}_${stage}.mem
Click OK.
Click OK.
Select Run > Debug Configurations to open the Debug Configurations dialog box.
Expand the CodeWarrior Attach group.
Right-click the P4080 U-Boot Stage 1 launch configuration and select Duplicate from
the context menu that appears.
A new launch configuration appears in the CodeWarrior Attach group.
17. On the right-hand side, in the Name text box, enter an appropriate name. For
example, P4080 U-Boot Stage 2.
18. On the Main page, in the Remote system panel, from the System drop-down list,
select the P4080DS u-boot mem translation system.
19. On the Debugger tab, in the PIC page, clear the Alternate Load Address checkbox.
20. Duplicate the P4080 U-Boot Stage 1 launch configuration.
21. On the right-hand side in the Name text box, enter an appropriate name. For
example, P4080 U-Boot Stage 3.
22. On the Debugger tab, in the PIC page, clear the Alternate Load Address checkbox.
23. Duplicate the P4080 U-Boot Stage 1 launch configuration.
24. On the right-hand side in the Name text box, enter an appropriate name. For
example, P4080 U-Boot Stage 4.
25. On the Debugger tab, in the PIC page, select the Alternate Load Address
checkbox.
26. In the text box that comes up, enter the address printed by U-Boot as "Now running in
RAM".
You have successfully created launch configurations for all the four stages of U-Boot
debug.
From a memory layout perspective, U-Boot has four different stages till you get the UBoot prompt. CodeWarrior debug settings required to debug U-Boot in flash memory
differ from the settings required to debug U-Boot in RAM.
CodeWarrior Development Studio for Power Architecture Processors Targeting Manual, Rev. 10.5.0,
06/2015
280
Freescale Semiconductor, Inc.
Chapter 7 Debugging Embedded Linux Software
7.6 Debugging U-Boot using NOR, NAND, SPI, and SD
Card/MMC Flash Devices
U-Boot resides in flash memory on target systems and boots an embedded Linux image
developed for those systems.
This section shows you how to use the CodeWarrior debugger to debug the U-Boot using
NOR, NAND, SPI, and SD Card/MMC flash devices.
This section explains:
•
•
•
•
Configuring and Building U-Boot
Creating a CodeWarrior Project to Debug U-Boot
Specifying the Launch Configuration Settings
Debugging U-Boot using Flash Devices
7.6.1 Configuring and Building U-Boot
This section explains how to configure and build U-Boot and how to write configuration
words in the U-Boot code to create the final boot image.
See Preparing U-Boot for debugging to install and configure the BSP. For more
information on configuring the build tool and building U-Boot with CodeWarrior
debugger support, see the SDK User Manual available in the iso/help/documents/pdf folder.
Upon successful compilation of U-Boot, the binary images for NOR and NAND flash
devices are written to the flash. For the SPI and SD flash devices, write the configuration
words at the beginning of the u-boot.bin file to create the final boot image.
See the figure below for the required eSPI/SD EEPROM data structure.
CodeWarrior Development Studio for Power Architecture Processors Targeting Manual, Rev. 10.5.0,
06/2015
Freescale Semiconductor, Inc.
281
Debugging U-Boot using NOR, NAND, SPI, and SD Card/MMC Flash Devices
Figure 7-21. eSPI/SD EEPROM Data Structure
The table below describes the eSPI/SD EEPROM data structure.
Table 7-5. eSPI/SD EEPROM Data Structure Details
Address
Data Bits
0x00-0x3F
Reserved
0x40-0x43
BOOT signature - This location should contain the value 0x424f_4f54, which is the
ASCII encoding for BOOT. The eSPI loader code searches for this signature, initially in
24-bit addressable mode. If the value at this location does not match the BOOT
signature, the EEPROM is accessed again, but in 16-bit mode. If the value in this
location still does not match the BOOT signature, the eSPI device does not contain a
valid user code. In such a case, the eSPI loader code disables the eSPI and issues a
hardware reset request of the SoC by setting RSTCR[HRESET_REQ].
0x44-0x47
Reserved
0x48-0x4B
User's code length - Number of bytes in the user's code to be copied. The value must
be a multiple of 4. 4<=User's code length <= 2GBytes.
0x4C-0x4F
Reserved
0x50-0x53
Source Address - Contains the starting address of the user's code as an offset from the
EEPROM starting address. In the 24-bit addressing mode, the 8 most significant bits of
the source address should be written to as zero, because the EEPROM is accessed
with a 3-byte (24-bit) address. In 16-bit addressing mode, the 16 most significant bits of
the source address should be written as zero.
0x54-0x57
Reserved
Table continues on the next page...
CodeWarrior Development Studio for Power Architecture Processors Targeting Manual, Rev. 10.5.0,
06/2015
282
Freescale Semiconductor, Inc.
Chapter 7 Debugging Embedded Linux Software
Table 7-5. eSPI/SD EEPROM Data Structure Details (continued)
Address
Data Bits
0x58-0x5B
Target Address - Contains the target address in the system's local memory address
space in which the user's code is copied. This is a 32-bit effective address. The core is
configured in such a way that the 36-bit real address is equal to the target address
(with 4 most significant bits zero).
0x5C-0x5F
Reserved
0x60-0x63
Execution Starting Address - Contains the jump address of the system's local memory
address space into which the user's code first instruction is executed. This is a 32-bit
effective address. The core is configured in such a way that the 36-bit real address is
equal to this (with 4 most significant bits zero).
0x64-0x67
Reserved
0x68-0x6B
N - Number of Config Address/Data pairs. This address must be <=1024 (but it is
recommended to keep it as small as possible).
0x6C-0x7F
Reserved
0x80-0x83
Config Address 1
0x84-0x87
Config Data 1
0x88-0x8B
Config Address 2
0x8C-0x8F
Config Data 2
...
...
0x80 + 8*(N-1)
Config Address N
0x80 + 8*(N-1)+4
Config Data N (Final Config Data N optional)
~~~
~~~
User's Code
Your U-Boot code.
7.6.1.1 Writing configuration words in U-Boot code
You can use the boot format tool to write the configuration words to the beginning of the
U-Boot code. The boot format tool is used only for SPI and SD flash devices.
To use the boot format tool:
1. Access the BSP folder to access the boot format tool.
NOTE
See the BSP documentation to read more about the boot
format tool.
2. Issue the following commands:
cd boot_format
make [all]
3. Issue the following command for the SPI flash device:
CodeWarrior Development Studio for Power Architecture Processors Targeting Manual, Rev. 10.5.0,
06/2015
Freescale Semiconductor, Inc.
283
Debugging U-Boot using NOR, NAND, SPI, and SD Card/MMC Flash Devices
./boot_format config_XXX_ddr.dat u-boot.bin -spi spi-boot.bin
where config_XXX_ddr.dat is the appropriate DDR init file for your board.
4. For the SD flash device, you need to format your SD device to vfat:
/sbin/mkfs.vfat /dev/sdc1
./boot_format config_ddr3_xxx.dat u-boot.bin -sd /dev/sdc1
where /dev/sdc1 is the SD flash device.
7.6.2 Creating a CodeWarrior Project to Debug U-Boot
This section provides steps to create a CodeWarrior project for debugging U-Boot.
To create a CodeWarrior project to debug U-Boot:
1.
2.
3.
4.
Start the CodeWarrior IDE.
Select File > Import. The Import wizard appears.
Expand the CodeWarrior group and select CodeWarrior Executable Importer.
Click Next.
The Import a Codewarrior Executable file page appears.
5. Specify the project name in the Project name text box.
6. Click Next.
7. Click Browse next to the Executable text box.
• For NOR, SPI, and SD, browse to the U-Boot folder and select the U-Boot file.
• For NAND, browse to the U-Boot folder and select the u-boot-spl file from the
nand_spl folder. You need two .elf files when performing U-Boot debug in
NAND. To specify the second .elf file, see Specifying the Launch Configuration
Settings.
• Click Open.
• Click Next.
• From the Processor list, expand the processor family and select the required
processor.
• From the Toolchain list, select Bareboard Application.
• Click Next.
• From the Debugger Connection Types list, select the required connection type.
CodeWarrior Development Studio for Power Architecture Processors Targeting Manual, Rev. 10.5.0,
06/2015
284
Freescale Semiconductor, Inc.
Chapter 7 Debugging Embedded Linux Software
NOTE
Select the Simulator option from the Debugger
Connection Types list if you want to use the simulator
to debug U-Boot.
•
•
•
•
Select a required launch configuration.
From the Core index list, select the required core.
Click Next.
Specify connection type, and TAP address if you are using Ethernet or Gigabit
TAP.
NOTE
If you are using the simulator to debug U-Boot, this
page will show the simulator options.
• Click Finish.
The imported project appears in the CodeWarrior Projects view.
You just finished creating a CodeWarrior project to debug the U-Boot image.
7.6.3 Specifying the Launch Configuration Settings
You can specify settings for the launch configuration created earlier using the Debug
Configurations dialog box.
To specify settings for the newly created Attach launch configuration:
1. Select Run > Debug Configurations.
2. On the Main tab, if you have an already existing system for the attach configuration,
select it from the Connection drop-down list, else create a new one by following the
steps given below:
a. Click New. The New Connection wizard appears.
b. Expand the CodeWarrior Bareboard Debugging group and select Hardware
or Simulator Connection.
c. Click Next. The Hardware or Simulator Connection page appears.
d. Specify a name and a description for the connection.
e. Click New next to the Target drop-down list. The New Connection wizard
appears.
f. Expand the CodeWarrior Bareboard Debugging group and select Hardware
or Simulator System.
CodeWarrior Development Studio for Power Architecture Processors Targeting Manual, Rev. 10.5.0,
06/2015
Freescale Semiconductor, Inc.
285
Debugging U-Boot using NOR, NAND, SPI, and SD Card/MMC Flash Devices
g. From the Target type drop-down list, expand the eppc group and select the
required processor.
h. On the Initialization tab, clear the Execute system reset checkbox.
i. Select the checkbox for the respective core in the Initialize target column.
j. Click the ellipsis button in the Initialize target script column.
The Target Initialization File dialog box appears.
k. Click File System and select the target initialization file from the following path:
<CWInstallDir>\PA\PA_Support\Initialization_Files\
NOTE
If you want to use an initialization file that initializes
CCSR and PIXIS before U-Boot, you can uncomment
the specific lines in the <boardname>_uboot_<Numbits>.tcl
initialization file, where <NumBits> can be 32 or 36.
l. Click Finish.
m. From the Connection type drop-down list, select the type of connection you
want to use (Ethernet TAP, Gigabit TAP, or Simulator).
The Connection tab appears along with the other tabs on the page.
3.
4.
5.
6.
7.
n. On the Connection tab, specify the IP address of the TAP if you are using a
TAP or configure the Simics paths (model startup script, simics executable, and
CodeWarrior add-on) if you are using Simics. For Simics, select the Manual
launch option from the CCS server panel and enter the IP address of the CCS
server in the Server hostname/IP text box.
o. Click Finish.
p. From the Target panel, select all the cores on which U-Boot is running.
On the Debugger tab, in the Other Executables page specify the second elf file
needed to perform U-Boot debug in NAND.
a. Click Add. The Debug Other Executable dialog box appears.
b. In the Additional Executable File text box, browse to the U-Boot folder and
select the U-Boot file.
c. Select the Load Symbols checkbox.
d. Click OK.
On the Debugger tab, in the PIC page, clear the Alternate Load Address checkbox.
On the Source tab, specify the source mapping configuration.
Click Apply to save the settings made to the various tabs.
Click Debug.
The Debug perspective appears with the core 0 stopped at the reset vector (shown in
the figure below).
CodeWarrior Development Studio for Power Architecture Processors Targeting Manual, Rev. 10.5.0,
06/2015
286
Freescale Semiconductor, Inc.
Chapter 7 Debugging Embedded Linux Software
NOTE
Select the Core reset checkboxes for all cores except core
0 and then click Reset in the Debug view. You will then
see core 0 stopped at the reset vector.
Figure 7-22. Debug Perspective - U-Boot Debug
7.6.4 Debugging U-Boot using Flash Devices
This section explains how to debug U-Boot using different flash devices.
From a memory layout perspective, U-Boot has four different stages till you get the UBoot prompt. CodeWarrior debug settings required to debug U-Boot in flash memory
differ from the settings required to debug U-Boot in RAM. Each of these stages requires
specific debug settings that are described in the following sections for each flash device,
NOR, NAND, SPI, and SD/MMC.
•
•
•
•
Points to remember
Debugging U-Boot using NOR flash
Debugging U-Boot using SPI and SD/MMC flash
Debugging U-Boot using NAND flash
CodeWarrior Development Studio for Power Architecture Processors Targeting Manual, Rev. 10.5.0,
06/2015
Freescale Semiconductor, Inc.
287
Debugging U-Boot using NOR, NAND, SPI, and SD Card/MMC Flash Devices
7.6.4.1 Points to remember
This section talks about some important points to remember while debugging U-Boot
using a flash device.
Before debugging U-Boot, you should be aware of the board you are using, if the U-Boot
was built on 32 or 36 bits, and the configuration files you will use from the layout.
Select the correct initialization and memory files used by the CodeWarrior Debugger.
These configuration files have various names:
${BoardName}_uboot_${bits}_${FlashDevice}_${stage}.mem
${BoardName}_uboot_${bits}.tcl
•
BoardName
is any available board, for example, P4080DS, P2040RDB, P2010DS, and
so on
• bits are any token from 32 or 36
• FlashDevice is any token from NOR, NAND, SPI, and SD
• stage can be any token from 1, 2, 3, 4, 1_2, 3_4, {}
NOTE
Note that the configuration files in which the stage token is
missing (for example, P1024RDB_uboot_32.tcl) can be used in
all debug stages.
Whenever you want to set a breakpoint, verify the following:
• A valid opcode at the debug exception interrupt vector.
In a scenario where the valid opcode is missing, when a breakpoint is hit, an
exception is generated for the invalid opcode found at the debug interrupt vector
memory location.
• All available support for debug.
For example, a very common error is when the code is relocated from reset space
(0xfffffxxx) to flash space (0xefffxxxx) for the NOR and NAND flash devices. In
such a scenario, IVPR remains at 0xffff0000 and IVOR15 at 0x0000f000. Any
access to 0xfffff000 (the debug exception) generates a TLB miss exception. The
workaround is to set IVPR to 0xefff0000 before the U-Boot relocation.
To hit breakpoints set on a previous debug session after changing the PIC address, verify
the following:
CodeWarrior Development Studio for Power Architecture Processors Targeting Manual, Rev. 10.5.0,
06/2015
288
Freescale Semiconductor, Inc.
Chapter 7 Debugging Embedded Linux Software
• Do not disable and enable back those breakpoints after the PIC value has been
changed. Use the breakpoints relocation feature to deal with these changes
• Do not set breakpoints in Stage 4 (relocation to RAM) until you move execution
there.
• Do not set breakpoints from Stage 1 to Stage 2. The Instruction Address Space (IS)
and Data Address Space (DS) bits from MSR are cleared in Stage 1. So the processor
will use only the TLB entries with Translation Space (TS) = 0 instead of Stage 2
where TS = 1.
7.6.4.2 Debugging U-Boot using NOR flash
This section explains how to debug U-Boot using the NOR flash device in different UBoot debug stages.
During a typical U-Boot start-up sequence, the target processor starts executing U-Boot
in flash memory. U-Boot then enables the Memory Management Unit (MMU), and
relocates itself to RAM. From the memory layout perspective, U-Boot debug has four
different stages.
The following sections describe four U-Boot debug stages for debugging U-Boot using
the NOR flash device:
•
•
•
•
Debugging U-Boot before switching address space
Debugging U-Boot in translated address space
Debugging U-Boot after switching back to initial address space
Debugging U-Boot in RAM
7.6.4.2.1
Debugging U-Boot before switching address space
This section tells how to debug U-Boot in a NOR flash device before switching address
space.
To debug U-Boot in flash before switching address space:
1. Start the CodeWarrior IDE.
2. Open the CodeWarrior U-Boot project that you created in Creating a CodeWarrior
Project to Debug U-Boot.
3. Select Run > Debug Configurations. The Debug Configurations dialog box
appears.
4. Expand the CodeWarrior group and select the appropriate launch configuration.
5. Click Debug. The Debug perspective appears with the core 0 running.
CodeWarrior Development Studio for Power Architecture Processors Targeting Manual, Rev. 10.5.0,
06/2015
Freescale Semiconductor, Inc.
289
Debugging U-Boot using NOR, NAND, SPI, and SD Card/MMC Flash Devices
6. Click Reset on the Debug view toolbar.
The Reset dialog box appears.
7. In the Run out of reset column, select the checkboxes for all cores except core 0.
After the reset completes, core 0 appears stopped at the reset vector. In the Debugger
Shell view, issue the following command to enter the PIC alternate load address:
setpicloadaddr 0xFFF40000
8. From the Debug view toolbar, select the Instruction Stepping Mode ( )
command.
9. From the Debug view toolbar, select the Step Into (
) command to step into b
_start_e500.
The start.s file appears in the editor area and the disassembled code with memory
addresses appears in the Disassembly view.
Figure 7-23. U-Boot Debug - Disassembly View
10. Move the Debug Current Instruction Pointer to _start_e500.
11. Deselect the Instruction Stepping Mode ( ) command.
You can now do source-level debugging and set breakpoints in start.s until the
address space switch at the rfi before switch_as (start.S, line 326). See Points to
remember for more details.
7.6.4.2.2
Debugging U-Boot in translated address space
This section tells how to debug U-Boot in the translated address space in a NOR flash
device.
Once you have reached the rfi call, the execution will move to the next stage. You should
now use a memory configuration file for debugging in this section.
CodeWarrior Development Studio for Power Architecture Processors Targeting Manual, Rev. 10.5.0,
06/2015
290
Freescale Semiconductor, Inc.
Chapter 7 Debugging Embedded Linux Software
It is necessary to inspect the TLB registers to check if there are address spaces translated
or to search in the CW PA10 layout (PA\PA_Support\Initialization_Files\Memory\) if there
are memory configuration files that match your U-Boot debug scenario.
NOTE
For e500v2 cores (36-bit U-Boot debug only), due to a
hardware issue (terminating the current debug session will put
the core in running) another script must be executed before
proceeding further with the instructions provided in this
section:
1. Open Debugger Shell view.
2. Execute ${BoardName}_uboot_36_stage2_preparation.tcl using
the following command:
source /${BoardName}_uboot_36_stage2_preparation.tcl
To debug U-Boot in the translated address space in flash before switching back to initial
address space (start.S, bl cpu_init_f, line 396):
1. Click on the Debug view toolbar to terminate the current debug session.
2. Select Run > Debug Configurations. The Debug Configurations dialog box
appears.
3. Expand the CodeWarrior group and select the appropriate launch configuration.
4. In the Connection panel, click Edit next to the Connection drop-down list.
The Properties for <connection> dialog box appears.
5. Click Edit next to the Target drop-down list.
The Properties for <Target> dialog box appears.
6. On the Memory tab, select the checkbox for the respective core in the Memory
configuration column.
7. Click the ellipsis button in the Memory configuration file column.
The Memory Configuration File dialog box appears.
8. Click File System and select the memory configuration file from the following path:
<CWInstallDir>\PA\PA_Support\Initialization_Files\Memory\
NOTE
To select an appropriate memory configuration file, it is
necessary to inspect the TLB registers and check if there
are address spaces translated or if there are memory
configuration files available in the CodeWarrior layout that
match your U-Boot debug scenario.
CodeWarrior Development Studio for Power Architecture Processors Targeting Manual, Rev. 10.5.0,
06/2015
Freescale Semiconductor, Inc.
291
Debugging U-Boot using NOR, NAND, SPI, and SD Card/MMC Flash Devices
9.
10.
11.
12.
Click OK to close the Memory Configuration File dialog box.
Click OK to close the Properties for <Target> dialog box.
Click OK to close the Properties for <connection> dialog box.
Click Debug.
The instruction pointer is now on the rfi function call.
NOTE
For e500v2 cores (36-bit U-Boot debug only) a reset using
${BoardName}_uboot_36_stage2.tcl is needed.
13. In the Debugger Shell, issue the following command to reset PIC load address to the
location specified in u-boot.elf.
setpicloadaddr reset
14. From the Debug view toolbar, select the Instruction Stepping Mode (
)
command.
15. Ensure the Debug Current Instruction Pointer is at rfi. From the Debug view toolbar,
) command to step into rfi. The Disassembly view appears.
select the Step Into (
Figure 7-24. U-Boot Debug - Translated Address Space in Flash
16. Deselect the Instruction Stepping Mode command when the instruction pointer is at
switch_as.
You can set breakpoints and use the Step Over, Step Into, and Step Out commands
from line (switch_as: label) in start.S to line (/* switch back to AS = 0 */) in start.S.
At these locations, the Instruction Address Space (IS) and Data Address Space (DS)
bits from MSR are cleared, so that the processor uses only the TLB entries with TS =
0. See Points to remember for more details.
NOTE
To set breakpoints in Stage2 after rfi (start.S), you can set
the Alternate Load Address by using setpicloadaddr reset.
CodeWarrior Development Studio for Power Architecture Processors Targeting Manual, Rev. 10.5.0,
06/2015
292
Freescale Semiconductor, Inc.
Chapter 7 Debugging Embedded Linux Software
For low-end processors (e500v1, e500v2), set DE (Debug
Enable) from MSR register using the Debugger Shell or
the Registers view. You can then perform the set, resume,
and remove operations on the breakpoints.
NOTE
To access breakpoints set on a previous debug session after
changing the PIC address, you need to disable and enable
back those breakpoints after the PIC value has been
changed.
7.6.4.2.3
Debugging U-Boot after switching back to initial address space
This section tells how to debug U-Boot in a NOR flash device after switching back to
initial address space.
While debugging U-Boot, when you reach the cpu_init_f call you are back to address
space 0. You now need to remove the memory configuration file used in the previous
section or set another memory configuration file for U-Boot compiled on 36 bits.
To debug U-Boot in flash after switching back to initial address space:
1. Click on the Debug view toolbar to terminate the current debug session.
2. Select Run > Debug Configurations. The Debug Configurations dialog box
appears.
3. Expand the CodeWarrior group and select the appropriate launch configuration.
4. In the Connection panel, click Edit next to the Connection drop-down list.
The Properties for <connection> dialog box appears.
5. Click Edit next to the Target drop-down list.
The Properties for <Target> dialog box appears.
6. On the Memory tab, clear the checkbox for the respective core in the Memory
configuration column to remove the memory configuration file you had set in the
previous section.
NOTE
If required, you can set another memory configuration file
for U-Boot compiled on 36 bits on the Memory tab.
7. Click OK to close the Memory Configuration File dialog box.
8. Click OK to close the Properties for <Target> dialog box.
CodeWarrior Development Studio for Power Architecture Processors Targeting Manual, Rev. 10.5.0,
06/2015
Freescale Semiconductor, Inc.
293
Debugging U-Boot using NOR, NAND, SPI, and SD Card/MMC Flash Devices
9. Click OK to close the Properties for <connection> dialog box.
10. Click Debug.
The instruction pointer is now on the cpu_init_f function call.
NOTE
For e500v2 cores (36-bit U-Boot debug only) a reset using
${BoardName}_uboot_36_stage3.tcl is needed.
11. If you used a different PIC value, in the Debugger Shell, issue the following
command to reset PIC load address to the location specified in u-boot.elf.
setpicloadaddr reset
12. From the Debug view toolbar, select the Instruction Stepping Mode ( )
command.
13. From the Debug view toolbar, select the Step Into (
) command to step into
cpu_init_f.
You can set breakpoints and use the Step Over, Step Into, and Step Out commands
from line 396 in start.S (bl cpu_init_f) to line 980 in start.S (blr /* NEVER RETURNS!
*/).
NOTE
To access breakpoints set on a previous debug session after
changing the PIC address, you need to disable and enable
back those breakpoints after the PIC value has been
changed.
7.6.4.2.4
Debugging U-Boot in RAM
This section tells how to debug U-Boot in RAM using a NOR flash device.
To debug U-Boot in RAM:
1. In the Debugger Shell view, issue the following command to reset PIC load address
to RAM space:
setpicloadaddr 0xxxxx0000
NOTE
The address printed by U-Boot at line "Now running in
ram" is 0xxxxx0000. You can also see this address in the
Disassembly view and observe the current address space
you are in.
CodeWarrior Development Studio for Power Architecture Processors Targeting Manual, Rev. 10.5.0,
06/2015
294
Freescale Semiconductor, Inc.
Chapter 7 Debugging Embedded Linux Software
2. From the Debug view toolbar, select the Instruction Stepping Mode (
)
command.
3. From the Debug view toolbar, select the Step Into (
) command to step into blr.
Figure 7-25. U-Boot Debug - Running in RAM
4. Deselect the Instruction Stepping Mode command when the instruction pointer is at
in_ram.
You can now do source-level debugging and set breakpoints in all RAM area,
including board_init_r. See Points to remember for more details.
NOTE
Before closing the debug session, change back the alternate
load address to flash address space by issuing the
setpicloadaddr 0xFFF40000 command in the Debugger Shell.
Now, you do not need to manually set it from the
Debugger Shell in Stage 1.
7.6.4.3 Debugging U-Boot using SPI and SD/MMC flash
This section explains how to debug U-Boot using the SPI and SD/MMC flash devices in
different U-Boot debug stages.
U-Boot debug using the SPI and SD/MMC flash devices is similar. The only difference
between these devices is how the final image (u-boot.bin and the configuration and
control words) is built. For more details, see Configuring and Building U-Boot.
CodeWarrior Development Studio for Power Architecture Processors Targeting Manual, Rev. 10.5.0,
06/2015
Freescale Semiconductor, Inc.
295
Debugging U-Boot using NOR, NAND, SPI, and SD Card/MMC Flash Devices
After the device has completed the reset sequence, if the ROM location selects the onchip ROM eSDHC/eSPI Boot configuration, the e500 core starts to execute code from the
internal on-chip ROM. The e500 core configures the eSDHC/eSPI controller, enabling it
to communicate with the external SD/SPI card. The SD/SPI device should contain a
specific data structure with control words, device configuration information, and
initialization code. The on-chip ROM boot code uses the information from the SD/SPI
card content to configure the device, and to copy the initialization code to a target
memory device through the eSDHC interface. After all the code has been copied, the
e500 core starts to execute the code from the target memory device. There are different
ways you can utilize the eSDHC/eSPI boot feature. The simplest way is for the on-chip
ROM to copy an entire operating system boot image into the system memory, and then
access it to begin execution. This is the preferred way for small applications and for UBoot application debug. After the reset sequence, all code is in RAM at 0x11000000.
The following sections describe four U-Boot debug stages for debugging U-Boot using
the SPI and SD/MMC flash devices:
•
•
•
•
Debugging U-Boot before switching address space
Debugging U-Boot in translated address space
Debugging U-Boot after switching back to initial address space
Debugging U-Boot in RAM
7.6.4.3.1
Debugging U-Boot before switching address space
This section tells how to debug U-Boot in the SPI and SD/MMC flash devices before
switching address space.
To debug U-Boot in flash before switching address space:
1. Start the CodeWarrior IDE.
2. Open the CodeWarrior U-Boot project that you created in Creating a CodeWarrior
Project to Debug U-Boot.
3. Select Run > Debug Configurations. The Debug Configurations dialog box
appears.
4. From the left pane, expand the CodeWarrior Attach container and select the
appropriate launch configuration.
5. Click Debug. The Debug perspective appears with the core 0 running.
6. Click Reset on the Debug view toolbar.
The Reset dialog box appears.
7. In the Run out of reset column, select the checkboxes for all cores except core 0.
After the reset completes, core 0 appears stopped at the reset vector.
CodeWarrior Development Studio for Power Architecture Processors Targeting Manual, Rev. 10.5.0,
06/2015
296
Freescale Semiconductor, Inc.
Chapter 7 Debugging Embedded Linux Software
NOTE
To jump over the on-chip ROM code that performs block
copy from SD EPROM and the reset sequence, you can set
a hardware breakpoint at _start_e500 by issuing the bp -hw
_start_e500 command.
8. From the Debug view toolbar, select the Instruction Stepping Mode (
)
command.
9. From the Debug view toolbar, select the Step Into (
) command to step into b
_start_e500.
The start.s file appears in the editor area and the disassembled code with memory
addresses appears in the Disassembly view.
Figure 7-26. U-Boot Debug - Disassembly View
10. Move the Debug Current Instruction Pointer to _start_e500.
11. Deselect the Instruction Stepping Mode (
) command.
You can now do source-level debugging and set breakpoints in start.s until the
address space switch at the rfi before switch_as (start.S, line 326). See Points to
remember for more details.
7.6.4.3.2
Debugging U-Boot in translated address space
This section tells how to debug U-Boot in the translated address space in the SPI and
SD/MMC flash devices.
Once you have reached the rfi call, the execution will move to the next stage. You should
now use a memory configuration file for debugging in this section.
It is necessary to inspect the TLB registers to check if there are address spaces translated
or to search in the CW PA10 layout (PA\PA_Support\Initialization_Files\Memory\) if there
are memory configuration files that match your U-Boot debug scenario.
CodeWarrior Development Studio for Power Architecture Processors Targeting Manual, Rev. 10.5.0,
06/2015
Freescale Semiconductor, Inc.
297
Debugging U-Boot using NOR, NAND, SPI, and SD Card/MMC Flash Devices
NOTE
For e500v2 cores (36-bit U-Boot debug only), due to a
hardware issue (terminating the current debug session will put
the core in running) another script must be executed before
proceeding further with the instructions provided in this
section:
1. Open Debugger Shell view.
2. Execute ${BoardName}_uboot_36_stage2_preparation.tcl using
the following command:
source /${BoardName}_uboot_36_stage2_preparation.tcl
To debug U-Boot in the translated address space in flash before switching back to initial
address space (start.S, bl cpu_init_f, line 396):
1. Click on the Debug view toolbar to terminate the current debug session.
2. Select Run > Debug Configurations. The Debug Configurations dialog box
appears.
3. Expand the CodeWarrior group and select the appropriate launch configuration.
4. In the Connection panel, click Edit next to the Connection drop-down list.
The Properties for <connection> dialog box appears.
5. Click Edit next to the Target drop-down list.
The Properties for <Target> dialog box appears.
6. On the Memory tab, select the checkbox for the respective core in the Memory
configuration column.
7. Click the ellipsis button in the Memory configuration file column.
The Memory Configuration File dialog box appears.
8. Click File System and select the memory configuration file from the following path:
<CWInstallDir>\PA\PA_Support\Initialization_Files\Memory\
NOTE
To select an appropriate memory configuration file, it is
necessary to inspect the TLB registers and check if there
are address spaces translated or if there are memory
configuration files available in the CodeWarrior layout that
match your U-Boot debug scenario.
9. Click OK to close the Memory Configuration File dialog box.
10. Click OK to close the Properties for <Target> dialog box.
11. Click OK to close the Properties for <connection> dialog box.
CodeWarrior Development Studio for Power Architecture Processors Targeting Manual, Rev. 10.5.0,
06/2015
298
Freescale Semiconductor, Inc.
Chapter 7 Debugging Embedded Linux Software
12. Click Debug.
The instruction pointer is now on the rfi function call.
NOTE
For e500v2 cores (36-bit U-Boot debug only) a reset using
${BoardName}_uboot_36_stage2.tcl is needed.
13. In the Debugger Shell, issue the following command to reset PIC load address to the
location specified in u-boot.elf:
setpicloadaddr reset
14. From the Debug view toolbar, select the Instruction Stepping Mode (
)
command.
15. Ensure the Debug Current Instruction Pointer is at rfi. From the Debug view toolbar,
select the Step Into (
) command to step into rfi. The Disassembly view appears.
Figure 7-27. U-Boot Debug - Translated Address Space in Flash
16. Deselect the Instruction Stepping Mode command when the instruction pointer is at
switch_as.
You can set breakpoints and use the Step Over, Step Into, and Step Out commands
from line (switch_as: label) in start.S to line (/* switch back to AS = 0 */) in start.S.
At these locations, the Instruction Address Space (IS) and Data Address Space (DS)
bits from MSR are cleared, so that the processor uses only the TLB entries with TS =
0. See Points to remember for more details.
NOTE
To set breakpoints in Stage2 after rfi (start.S), you can set
the Alternate Load Address by using setpicloadaddr reset.
For low-end processors (e500v1, e500v2), set DE (Debug
Enable) from MSR register via the Debugger Shell or the
CodeWarrior Development Studio for Power Architecture Processors Targeting Manual, Rev. 10.5.0,
06/2015
Freescale Semiconductor, Inc.
299
Debugging U-Boot using NOR, NAND, SPI, and SD Card/MMC Flash Devices
Registers view. You can then perform the set, resume, and
remove operations on the breakpoints.
NOTE
To access breakpoints set on a previous debug session after
changing the PIC address you will need to disable and
enable back those breakpoints after the PIC value has been
changed.
7.6.4.3.3
Debugging U-Boot after switching back to initial address space
This section tells how to debug U-Boot in the SPI and SD/MMC flash devices after
switching back to initial address space.
While debugging U-Boot when you reach the cpu_init_f call you are back to address
space 0; you now need to remove the memory configuration file used in the previous
section or set another memory configuration file for U-Boot compiled on 36 bits.
To debug U-Boot in flash after switching back to initial address space:
1. Click on the Debug view toolbar to terminate the current debug session.
2. Select Run > Debug Configurations. The Debug Configurations dialog box
appears.
3. From the left pane, in the CodeWarrior Attach container, select the appropriate
launch configuration.
4. In the Connection panel, click Edit next to the Connection drop-down list.
The Properties for <connection> dialog box appears.
5. Click Edit next to the Target drop-down list.
The Properties for <Target> dialog box appears.
6. On the Memory tab, clear the checkbox for the respective core in the Memory
configuration column to remove the memory configuration file you had set in the
previous section.
NOTE
If required, you can set another memory configuration file
for U-Boot compiled on 36 bits on the Memory tab.
7. Click OK to close the Memory Configuration File dialog box.
8. Click OK to close the Properties for <Target> dialog box.
9. Click OK to close the Properties for <connection> dialog box.
CodeWarrior Development Studio for Power Architecture Processors Targeting Manual, Rev. 10.5.0,
06/2015
300
Freescale Semiconductor, Inc.
Chapter 7 Debugging Embedded Linux Software
10. Click Debug.
The instruction pointer is now on the cpu_init_f function call.
NOTE
For e500v2 cores (36-bit U-Boot debug only) a reset using
${BoardName}_uboot_36_stage2.tcl is needed.
11. If you used a different PIC value, issue the following command in the Debugger
Shell to reset PIC load address to the location specified in u-boot.elf.
setpicloadaddr reset
12. From the Debug view toolbar, select the Instruction Stepping Mode (
)
command.
13. From the Debug view toolbar, select the Step Into (
) command to step into
cpu_init_f.
You can set breakpoints and use the Step Over, Step Into and Step Out commands
from line 396 in start.S (bl cpu_init_f) to line 980 in start.S (blr /* NEVER RETURNS!
*/).
NOTE
To access breakpoints set on a previous debug session after
changing the PIC address, you will need to disable and
enable back those breakpoints after the PIC value has been
changed.
7.6.4.3.4
Debugging U-Boot in RAM
This section tells how to debug U-Boot in RAM using the SPI and SD/MMC flash
devices.
To debug U-Boot in RAM:
1. In the Debugger Shell, issue the following command to reset PIC load address to
RAM space: setpicloadaddr 0xxxxx0000
NOTE
0xxxxx0000 is the address printed by U-Boot at line "Now
running in ram". You can also see this address in the
Disassembly view and observe the current address space
you are in.
CodeWarrior Development Studio for Power Architecture Processors Targeting Manual, Rev. 10.5.0,
06/2015
Freescale Semiconductor, Inc.
301
Debugging U-Boot using NOR, NAND, SPI, and SD Card/MMC Flash Devices
2. From the Debug view toolbar, select the Instruction Stepping Mode (
)
command.
3. From the Debug view toolbar, select the Step Into (
) command to step into blr.
The Disassembly view appears.
Figure 7-28. U-Boot Debug - Running in RAM
4. Deselect the Instruction Stepping Mode command when the instruction pointer is at
in_ram.
You can now do source level debugging and set breakpoints in all RAM area,
including board_init_r. See Points to remember for more details.
NOTE
Before closing the debug session, change back the alternate
load address to flash address space by issuing the
setpicloadaddr 0xFFF40000 command in the Debugger Shell.
Now, you do not need to manually set it from the
Debugger Shell in Stage 1.
7.6.4.4 Debugging U-Boot using NAND flash
This section explains how to debug U-Boot using the NAND flash device in different UBoot debug stages.
The following sections describe four U-Boot debug stages for debugging U-Boot using
the NAND flash device:
• Debugging U-Boot before switching address space
• Debugging U-Boot in translated address space
CodeWarrior Development Studio for Power Architecture Processors Targeting Manual, Rev. 10.5.0,
06/2015
302
Freescale Semiconductor, Inc.
Chapter 7 Debugging Embedded Linux Software
• Debugging U-Boot after switching back to initial address space
• Debugging U-Boot in RAM
7.6.4.4.1
Debugging U-Boot before switching address space
This section tells how to debug U-Boot in a NAND flash device before switching address
space.
To debug U-Boot in flash before switching address space:
1. Start the CodeWarrior IDE.
2. Open the CodeWarrior U-Boot project that you created in Creating a CodeWarrior
Project to Debug U-Boot.
3. Select Run > Debug Configurations. The Debug Configurations dialog box
appears.
4. From the left pane, expand the CodeWarrior Attach container and select the
appropriate launch configuration.
5. Click Debug. The Debug perspective appears with the core 0 running.
6. Click Reset on the Debug view toolbar.
The Reset dialog box appears.
7. In the Run out of reset column, select the checkboxes for all cores except core 0.
After the reset completes, core 0 appears stopped at the reset vector. In the Debugger
Shell view, issue the following command to enter the PIC alternate load address:
setpicloadaddr 0xFFF40000
8. From the Debug view toolbar, select the Instruction Stepping Mode (
)
command.
9. From the Debug view toolbar, select the Step Into (
) command to step into b
_start_e500.
The start.s file appears in the editor area and the disassembled code with memory
addresses appear in the Disassembly view.
CodeWarrior Development Studio for Power Architecture Processors Targeting Manual, Rev. 10.5.0,
06/2015
Freescale Semiconductor, Inc.
303
Debugging U-Boot using NOR, NAND, SPI, and SD Card/MMC Flash Devices
Figure 7-29. U-Boot Debug - Disassembly View
10. Move the Debug Current Instruction Pointer to _start_e500.
11. Deselect the Instruction Stepping Mode (
) command.
You can now do source-level debugging and set breakpoints in start.s until the
address space switch at the rfi before switch_as (start.S, line 326). See Points to
remember for more details.
7.6.4.4.2
Debugging U-Boot in translated address space
This section tells how to debug U-Boot in the translated address space in a NAND flash
device.
Once you have reached the rfi call the execution moves to the next stage. You should
now use a memory configuration file for debugging in this section.
It is necessary to inspect the TLB registers to check if there are address spaces translated
or to search in the CW PA10 layout (PA\PA_Support\Initialization_Files\Memory\) if
there are memory configuration files that match your U-Boot debug scenario.
NOTE
For e500v2 cores (36-bit U-Boot debug only), due to a
hardware issue (terminating the current debug session will put
the core in running) another script must be executed before
proceeding further with the instructions provided in this
section:
• Open Debugger Shell view.
• Execute ${BoardName}_uboot_36_stage2_preparation.tcl using
the following command:
source /${BoardName}_uboot_36_stage2_preparation.tcl
CodeWarrior Development Studio for Power Architecture Processors Targeting Manual, Rev. 10.5.0,
06/2015
304
Freescale Semiconductor, Inc.
Chapter 7 Debugging Embedded Linux Software
To debug U-Boot in the translated address space in flash before switching back to initial
address space (start.S, bl cpu_init_f, line 396):
1. Click on the Debug view toolbar to terminate the current debug session.
2. Select Run > Debug Configurations. The Debug Configurations dialog box
appears.
3. From the left pane, in the CodeWarrior Attach container, select the appropriate
launch configuration.
4. In the Connection panel, click Edit next to the Connection drop-down list.
The Properties for <connection> dialog box appears.
5. Click Edit next to the Target drop-down list.
The Properties for <Target> dialog box appears.
6. On the Memory tab, select the checkbox for the respective core in the Memory
configuration column.
7. Click the ellipsis button in the Memory configuration file column.
The Memory Configuration File dialog box appears.
8. Click File System and select the memory configuration file from the path:
<CWInstallDir>\PA\PA_Support\Initialization_Files\Memory\
NOTE
To select an appropriate memory configuration file, it is
necessary to inspect the TLB registers and check if there
are address spaces translated or if there are memory
configuration files available in the CodeWarrior layout that
match your U-Boot debug scenario.
9.
10.
11.
12.
Click OK to close the Memory Configuration File dialog box.
Click OK to close the Properties for <Target> dialog box.
Click OK to close the Properties for <connection> dialog box.
Click Debug.
The instruction pointer is now on the rfi function call.
NOTE
For e500v2 cores (36-bit U-Boot debug only) a reset using
${BoardName}_uboot_36_stage2.tcl is needed.
13. In the Debugger Shell, issue the following command to reset PIC load address to the
location specified in u-boot.elf.
setpicloadaddr reset
CodeWarrior Development Studio for Power Architecture Processors Targeting Manual, Rev. 10.5.0,
06/2015
Freescale Semiconductor, Inc.
305
Debugging U-Boot using NOR, NAND, SPI, and SD Card/MMC Flash Devices
14. From the Debug view toolbar, select the Instruction Stepping Mode (
)
command.
15. Ensure the Debug Current Instruction Pointer is at rfi. From the Debug view
toolbar, select the Step Into (
) command to step into rfi. The Disassembly view
appears.
Figure 7-30. U-Boot Debug - Translated Address Space in Flash
16. Deselect the Instruction Stepping Mode command when the instruction pointer is at
switch_as.
You can set breakpoints and use the Step Over, Step Into, and Step Out commands
from line (switch_as: label) in start.S to line (/* switch back to AS = 0 */) in start.S.
At these locations, the Instruction Address Space (IS) and Data Address Space (DS)
bits from MSR are cleared, so the processor will use only the TLB entries with TS =
0. See Points to remember for more details.
NOTE
To access breakpoints set on a previous debug session after
changing the PIC address, you will need to disable and
enable back those breakpoints after the PIC value was
changed.
NOTE
To set breakpoints in Stage2 after rfi (start.S), you can set
the Alternate Load Address by using setpicloadaddr reset.
For low-end processors (e500v1, e500v2), set DE (Debug
Enable) from MSR register using the Debugger Shell or
the Registers view. You can then perform the set, resume,
and remove operations on the breakpoints.
CodeWarrior Development Studio for Power Architecture Processors Targeting Manual, Rev. 10.5.0,
06/2015
306
Freescale Semiconductor, Inc.
Chapter 7 Debugging Embedded Linux Software
7.6.4.4.3
Debugging U-Boot after switching back to initial address space
This section tells how to debug U-Boot in a NAND flash device after switching back to
initial address space.
While debugging U-Boot when you reach the cpu_init_f call you are back to address
space 0; you now need to remove the memory configuration file used in the previous
section or set another memory configuration file for U-Boot compiled on 36 bits.
To debug U-Boot in flash after switching back to initial address space:
1. Click on the Debug view toolbar to terminate the current debug session.
2. Select Run > Debug Configurations. The Debug Configurations dialog box
appears.
3. From the left pane, in the CodeWarrior Attach container, select the appropriate
launch configuration.
4. In the Connection panel, click Edit next to the Connection drop-down list.
The Properties for <connection> dialog box appears.
5. Click Edit next to the Target drop-down list.
The Properties for <Target> dialog box appears.
6. On the Memory tab, clear the checkbox for the respective core in the Memory
configuration column to remove the memory configuration file you had set in the
previous section.
NOTE
If required, you can set another memory configuration file
for U-Boot compiled on 36 bits on the Memory tab.
7.
8.
9.
10.
Click OK to close the Memory Configuration File dialog box.
Click OK to close the Properties for <Target> dialog box.
Click OK to close the Properties for <connection> dialog box.
Click Debug.
The instruction pointer is now on the cpu_init_f function call.
NOTE
For e500v2 cores (36-bit u-boot debug only) a reset using $
{BoardName}_uboot_36_stage2.tcl is needed.
11. If you used a different PIC value, in the Debugger Shell view, issue the following
command to reset PIC load address to the location specified in u-boot.elf.
setpicloadaddr reset
CodeWarrior Development Studio for Power Architecture Processors Targeting Manual, Rev. 10.5.0,
06/2015
Freescale Semiconductor, Inc.
307
Debugging U-Boot using NOR, NAND, SPI, and SD Card/MMC Flash Devices
12. From the Debug view toolbar, select the Instruction Stepping Mode (
)
command.
13. From the Debug view toolbar, select the Step Into (
) command to step into
cpu_init_f.
You can set breakpoints and use the Step Over, Step Into and Step Out commands
from line 396 in start.S (bl cpu_init_f) to line 980 in start.S (blr /* NEVER RETURNS!
*/).
NOTE
To access breakpoints set on a previous debug session after
changing the PIC address you will need to disable and
enable back those breakpoints after the PIC value was
changed.
7.6.4.4.4
Debugging U-Boot in RAM
This section tells how to debug U-Boot in RAM using a NAND flash device.
To debug U-Boot in RAM:
1. In the Debugger Shell view, issue the following command to reset PIC load address
to RAM space:
setpicloadaddr 0xxxxx0000
NOTE
0xxxxx0000 is the address printed by U-Boot at line "Now
running in ram". You can also see this address in the
Disassembly view and observe the current address space
you are in.
2. From the Debug view toolbar, select the Instruction Stepping Mode (
)
command.
3. From the Debug view toolbar, select the Step Into (
) command to step into blr.
CodeWarrior Development Studio for Power Architecture Processors Targeting Manual, Rev. 10.5.0,
06/2015
308
Freescale Semiconductor, Inc.
Chapter 7 Debugging Embedded Linux Software
Figure 7-31. U-Boot Debug - Running in RAM
4. Deselect the Instruction Stepping Mode command when the instruction pointer is at
in_ram.
You can now do source-level debugging and set breakpoints in all the RAM area,
including board_init_r. See Points to remember for more details.
NOTE
You can enter the board_init_r, nand_boot, and uboot
functions. Beginning with the uboot function, the second
image is relocated to RAM at 0x11000000 and you begin to
execute the entire code again from RAM address space. See
Points to remember to avoid any debugging issues.
NOTE
Before closing the debug session, change back the alternate
load address to flash address space by issuing the
setpicloadaddr 0xFFF40000 command in the Debugger Shell.
Now, you do not need to manually set it from the
Debugger Shell in Stage 1.
7.7 Debugging the Linux Kernel
This section shows you how to use the CodeWarrior debugger to debug the Linux kernel.
The Linux operating system (OS) works in two modes, kernel mode and user mode. The
Linux kernel operates in kernel mode and resides at the top level of the OS memory
space, or kernel space. The kernel performs the function of a mediator among all the
CodeWarrior Development Studio for Power Architecture Processors Targeting Manual, Rev. 10.5.0,
06/2015
Freescale Semiconductor, Inc.
309
Debugging the Linux Kernel
currently running programs and between the programs and the hardware. The kernel
manages the memory for all the programs (processes) currently running and ensures that
the processes share the available memory such that each process has enough memory to
function adequately. In addition, the kernel allows application programs to manipulate
various hardware architectures via a common software interface.
User mode uses the memory in the lowest level of the OS memory space, called the user
space or the application level. At the application level, a program accesses memory or
other hardware through system calls to the kernel as it does not have permission to
directly access these resources.
Debugging the Linux kernel involves the following major actions:
1.
2.
3.
4.
5.
6.
7.
8.
9.
Setting Up the Target Hardware
Installing the Board Support Package (BSP)
Configuring the Build Tool
Configuring the Linux Kernel
Creating a CodeWarrior Project using the Linux Kernel Image
Configuring the kernel project for debugging
Debugging the kernel to download the kernel, RAM disk, and device tree
Debugging the kernel based on MMU initialization
Debugging the kernel by attaching to a running U-Boot
7.7.1 Setting Up the Target Hardware
Before you use the CodeWarrior IDE to debug the Linux kernel, you need to set up the
target hardware.
One requirement of the setup is to have a debug probe connected between the
CodeWarrior debug host and the target board.
The figure below illustrates the setup required to use the IDE to debug the Linux kernel
running on a Power Architecture target board.
CodeWarrior Development Studio for Power Architecture Processors Targeting Manual, Rev. 10.5.0,
06/2015
310
Freescale Semiconductor, Inc.
Chapter 7 Debugging Embedded Linux Software
Figure 7-32. Setup for Kernel Debugging Using the CodeWarrior IDE
Connect the hardware debug probe between the target board and the CodeWarrior debug
host. Kernel debugging is possible using a Linux-hosted or Windows-hosted
CodeWarrior installation. There are a variety of debug probes. The current kernel
debugging example uses the USB TAP. Connection information for other debug probes
can be determined from documentation provided with the probes.
7.7.1.1 USB TAP Connections
1. Ensure that the power switch on the target board is OFF.
2. Connect the square end (USB "B" connector) of the USB cable to the USB TAP.
3. Connect the rectangular end (USB "A" connector) of the USB cable to a free USB
port on the host Linux machine.
4. Connect the ribbon cable coming out of the USB TAP to the 16-pin connector on the
target board.
5. Connect the power supply to the USB TAP.
6. Establish a console connection before applying power to the board, so that boot
messages can be viewed in a terminal window.
CodeWarrior Development Studio for Power Architecture Processors Targeting Manual, Rev. 10.5.0,
06/2015
Freescale Semiconductor, Inc.
311
Debugging the Linux Kernel
7.7.1.2 Establishing a Console Connection
You need to establish a console connection to the target hardware to:
•
•
•
•
View target generated log and debug messages.
Confirm successful installation of the bootloader (U-Boot).
Use the bootloader to boot the Linux OS.
Halt the booting of the Linux OS.
The bootloader receives keyboard input through a serial port that has default settings
115,200-8-N-1.
Follow these steps to establish a console connection to the target hardware.
1. Connect a serial cable from a serial port of the CodeWarrior debug host to a serial
port of the target board.
2. On the CodeWarrior debug host computer, open a terminal-emulator program of your
choice (for example, minicom for a Linux host).
3. From the terminal-emulator program, open a console connection to the target
hardware.
Use the connection settings given in the table below.
Table 7-6. Terminal Connection
Settings
Name
Setting
Baud rate
115, 200 bits per second
Data bits
8
Parity
None
Stop bits
1
Flow control
Hardware
NOTE
See the board specific README file inside the stationery
wizard project to find out more details on the serial
connection settings, changing the serial port on the board,
and the type of serial cable to use.
4. Test the connection by turning on the test board with the power switch and viewing
the boot messages in the console connection.
CodeWarrior Development Studio for Power Architecture Processors Targeting Manual, Rev. 10.5.0,
06/2015
312
Freescale Semiconductor, Inc.
Chapter 7 Debugging Embedded Linux Software
7.7.2 Installing the Board Support Package (BSP)
This section describes installation of a BSP on a Linux computer.
NOTE
The BSP versions keep changing frequently. For different BSP
versions, you might encounter build environments based on
ltib, bitbake, or other tools. The subsequent sections will
describe necessary procedures and use specific examples from
real Freescale BSPs for illustration. The examples in these
sections will need to be adapted based on the BSP versions or
build tools you are currently using.
To install a BSP, perform the following steps:
1. On the Linux computer, download the Board Support Package (BSP) for your target
hardware to install kernel files and Linux compiler toolchains on your system.
Board Support Package image files for target boards are located at http://
www.freescale.com/linux.
2. Download the BSP image file for your target board.
NOTE
You will need to log in or register to download the BSP
image file.
The downloaded image file has an .iso extension.
For example,
QorIQ-DPAA-SDK-<yyyymmdd>-yocto.iso
3. Mount the image file to the CDROM as root, or using "sudo":
<sudo> mount -o loop QorIQ-DPAA-SDK-<yyyymmdd>-yocto.iso /mnt/cdrom
NOTE
sudo is a Linux utility that allows users to run applications
as root. You need to be setup to run sudo commands by your
system administrator to mount the BSP image files.
4. Execute the BSP install file to install the build tool files to a directory of your choice,
where you have privileges to write files:
/mnt/cdrom/install
CodeWarrior Development Studio for Power Architecture Processors Targeting Manual, Rev. 10.5.0,
06/2015
Freescale Semiconductor, Inc.
313
Debugging the Linux Kernel
NOTE
The BSP must be installed as a non-root user, otherwise the
install will exit.
5. Answer the questions from the installation program until the file copy process
begins.
You will be prompted to input the required build tool install path. Ensure you have
the correct permissions for the install path.
6. Upon successful installation, you will be prompted to install the ISO for the core(s)
you want to build.
For example, if you want to build the SDK for P4080, that is a e500mc core, then
you have to install the ISO images for e500mc core:
c23174e5e3d187f43414e5b4420e8587 QorIQ-SDK-V1.2-PPCE500MC-20120603-yocto.iso.part1
292c6e1c5e97834987fbdb5f69635a1d QorIQ-SDK-V1.2-PPCE500MC-20120603-yocto.iso.part2
NOTE
You can see the SDK User Manual for instructions about
how to build the BSP images and run different scenarios
from the iso/help/documents/pdf location.
7.7.3 Configuring the Build Tool
After installing the BSP, you need to configure the build tool and build the Linux kernel
and U-boot images for CodeWarrior debug.
For more information on configuring the build tool, see the SDK User Manual from iso/
help/documents/pdf.
7.7.4 Configuring the Linux Kernel
After you complete the BSP configuration, configure the Linux kernel to enable
CodeWarrior support.
To configure the Linux kernel, perform the following steps:
1. Launch a terminal window and navigate to the <yocto_installtion_path>/
build_<board>_release folder.
CodeWarrior Development Studio for Power Architecture Processors Targeting Manual, Rev. 10.5.0,
06/2015
314
Freescale Semiconductor, Inc.
Chapter 7 Debugging Embedded Linux Software
2. Execute the following command to get a new and clean kernel tree:
bitbake -c configure -f virtual/kernel
3. Configure the Linux kernel using the various configuration options available in the
kernel configuration user interface. For example, run the following command to
display the kernel configuration user interface:
bitbake -c menuconfig virtual/kernel
The kernel configuration user interface appears.
4. CodeWarrior supports both SMP and non-SMP debug. To change the default
settings, you can make changes by selecting the Processor support options.
5. To run a monolithic kernel, you do not need to enable loadable module support.
However, during the debug phase of drivers, it is easier to debug them as loadable
modules to avoid rebuilding the Linux kernel on every debug iteration. If you intend
to use loadable modules, select the Loadable module support menu item.
6. Select the Enable loadable module support option.
7. Select the Module unloading option.
NOTE
If you want to use the rmmod -f <mod_name> command for
kernel modules under development, select the Forced
module unloading option.
8. Select Exit to return to the main configuration menu.
9. Select Kernel hacking.
10. Select Include CodeWarrior kernel debugging by pressing Y. Enabling this option
allows the CodeWarrior debugger to debug the target. Select other desired
configuration options for Linux kernel debug.
11. Select Exit to return to the main configuration menu.
12. Select the General Setup option.
13. Select Configure standard kernel features (expert users) and ensure that the
Sysctl syscall support option is selected.
14. If you are using the Open Source Device Tree debugging method, under the General
Setup > Configure standard kernel features (expert users) option, then select:
• Load all symbols for debugging/ksymoops.
• Include all symbols in kallsyms.
NOTE
These settings are optional. They aid the debugging
process by providing the vmlinux symbols in /proc/
kallsyms.
15. Select Exit to exit the configuration screen.
CodeWarrior Development Studio for Power Architecture Processors Targeting Manual, Rev. 10.5.0,
06/2015
Freescale Semiconductor, Inc.
315
Debugging the Linux Kernel
16. Select Yes when asked if you want to save your configuration.
17. Execute the following command to rebuild the Linux kernel:
bitbake virtual/kernel
The uncompressed Linux kernel image with debug symbols, vmlinux.elf, is created.
NOTE
The location of the images directory might differ based on the
BSP version being used. For the correct location of where the
Linux kernel images are stored, see the SDK User Manual from
iso/help/documents/pdf.
You just created a Linux kernel image that contains symbolic debugging information.
Now, you can use this image and create a CodeWarrior project for debugging the Linux
kernel. The various use cases for the Linux kernel debug scenario are:
• CodeWarrior allows you to download this Linux kernel image (vmlinux.elf), RAM
disk, and dtb files to the target.
• You can start the Linux kernel and RAM disk manually from U-Boot. The U-Boot,
the kernel, RAM disk, and dtb images are written into flash memory.
• You can download the Linux kernel and RAM disk from CodeWarrior without using
U-Boot.
• You can perform an early kernel debug before the MMU is enabled or debug after
the Linux kernel boots and the login prompt is shown.
The Linux kernel debug scenarios are explained in the following sections:
•
•
•
•
•
Creating a CodeWarrior Project using the Linux Kernel Image
Configuring the kernel project for debugging
Debugging the kernel to download the kernel, RAM disk, and device tree
Debugging the kernel based on MMU initialization
Debugging the kernel by attaching to a running U-Boot
7.7.5 Creating a CodeWarrior Project using the Linux Kernel
Image
After creating a Linux kernel image with symbolic debugging information, you need to
create a CodeWarrior project using the kernel image.
To create a CodeWarrior project:
CodeWarrior Development Studio for Power Architecture Processors Targeting Manual, Rev. 10.5.0,
06/2015
316
Freescale Semiconductor, Inc.
Chapter 7 Debugging Embedded Linux Software
1.
2.
3.
4.
Start the CodeWarrior IDE from the Windows system.
Select File > Import. The Import wizard appears.
Expand the CodeWarrior group and select CodeWarrior Executable Importer.
Click Next.
The Import a CodeWarrior executable file page appears.
5. Specify a name for the project, to be imported, in the Project name text box.
6. If you do not want to create your project in the default workspace:
a. Clear the Use default location checkbox.
b. Click Browse and select the desired location from the Browse For Folder
dialog box.
c. In the Location text box, append the location with the name of the directory in
which you want to create your project.
NOTE
An existing directory cannot be specified for the project
location.
7. Click Next.
The Import C/C++/Assembler Executable Files page appears.
Click Browse next to the Executable field.
Select the vmlinux file obtained.
Click Open.
From the Processor list, expand the processor family and select the required
processor.
12. Select the Bareboard Application toolchain from the Toolchain group.
8.
9.
10.
11.
Selected toolchain sets up the default compiler, linker, and libraries used to build the
new project. Each toolchain generates code targeted for a specific platform.
13. Select the Linux Kernel option from the Target OS list.
NOTE
Selecting Linux Kernel will automatically configure the
initialization file for kernel download, the default
translation settings (these settings need to be adjusted
according to the actual Linux kernel configuration) in the
OS Awareness tab, and the startup stop function to
start_kernel.
14. Click Next.
The Debug Target Settings page appears.
CodeWarrior Development Studio for Power Architecture Processors Targeting Manual, Rev. 10.5.0,
06/2015
Freescale Semiconductor, Inc.
317
Debugging the Linux Kernel
15. From the Debugger Connection Types list, select the required connection type.
16. Specify the settings, such as board configuration, launch configuration, connection
type, and TAP address if you are using Ethernet or Gigabit TAP.
17. Click Next.
The Configurations page appears.
18. From the Core index list, select the required core.
19. Click Finish.
The wizard creates a project according to your specifications.
You can access the project from the CodeWarrior Projects view on the workbench.
7.7.5.1 Updating the Linux Kernel Image
By modifying the Linux kernel image, you can update the project you just created.
This debug scenario has two use cases:
• Cache Symbolics Between Sessions is Enabled
• Cache Symbolics Between Sessions is Disabled
7.7.5.1.1
Cache Symbolics Between Sessions is Enabled
You have built a new vmlinux.elf file with some changes as compared to the current
vmlinux.elf file being used in the CodeWarrior project you created. To replace the
modified vmlinux.elf file:
1. Terminate the current debug session.
2. Right-click in the Debug window.
3. From the context menu, select Purge Symbolics Cache. The old vmlinux.elf file is
being used by the debugger, but after you select this option, the debugger stops using
this file in the disk.
4. Copy the new vmlinux.elf file over the old file.
Now, when you re-initiate a debug session, the updated vmlinux.elf file is used for the
current debug session.
7.7.5.1.2
Cache Symbolics Between Sessions is Disabled
CodeWarrior Development Studio for Power Architecture Processors Targeting Manual, Rev. 10.5.0,
06/2015
318
Freescale Semiconductor, Inc.
Chapter 7 Debugging Embedded Linux Software
To replace the modified vmlinux.elf file if the Cache symbolics between sessions is
disabled:
1. Terminate the current debug session.
2. Copy the new vmlinux.elf file over the old file.
Now, when you re-initiate a debug session, the updated vmlinux.elf file is used for the
current debug session.
7.7.6 Configuring the kernel project for debugging
Once you have created a CodeWarrior project using the Linux kernel image, the next
action is to configure this project for debugging.
•
•
•
•
Configuring a Download Kernel Debug Scenario
Configuring an Attach Kernel Debug Scenario
Setting up RAM disk
Using Open Firmware Device Tree Initialization method
7.7.6.1 Configuring a Download Kernel Debug Scenario
This section describes how to configure a download debug scenario.
For a download debug scenario, CodeWarrior:
• Resets the target
• Runs the initialization file
• Downloads the .elf file to the target; from the vmlinux.elf file, CodeWarrior writes
the binary file to the target memory
• Sets the entry point based on the information available from the .elf file
• Runs the target
For a download debug scenario, to boot the Linux kernel, CodeWarrior requires the
RAMDISK or ROOTFS file in addition to the vmlinux.elf file. This file is also built along
with the image files when the kernel is compiled using the build tool. CodeWarrior also
requires a DTB file that specifies the resources to be used by the kernel during its
execution. For a download debug scenario, you need to configure the vmlinux.elf file,
RAMDISK or ROOTFS file, and the DTB files to be downloaded into the target memory.
All these files can be found in the specific target images folder.
CodeWarrior Development Studio for Power Architecture Processors Targeting Manual, Rev. 10.5.0,
06/2015
Freescale Semiconductor, Inc.
319
Debugging the Linux Kernel
NOTE
The location of the images directory might differ based on the
BSP version being used. For the correct location of where the
kernel images are stored, see the SDK User Manual in iso/help/
documents/pdf.
These files are specified in the Download launch configuration after you have created the
CodeWarrior project with the Linux kernel image. Table 7-8 describes the settings you
need to provide in the launch configuration.
7.7.6.2 Configuring an Attach Kernel Debug Scenario
This section describes how to configure an attach debug scenario.
For the attach debug scenario, CodeWarrior does not download any file on the target. The
kernel is started directly from U-Boot. You need to burn the U-Boot image to the flash
memory of the hardware.
NOTE
See the Burning U-Boot to Flash cheat sheet for the entire
procedure for burning U-Boot to flash. To access the cheat
sheets, select Help > Cheat Sheets from the CodeWarrior IDE.
After the boot process, the U-Boot console is available and the Linux kernel can be
started manually from U-Boot. For this, the following files can be either written into flash
memory or can be copied from U-Boot using TFTP.
• Binary kernel image file, uImage
• Ramdisk to be started from U-Boot, for example,
<target version>.rootfs.ext2.gz.u-boot
• dtb file, for example, uImage-<target
version>.dtb
After the Linux boot process, the Linux login appears and you can connect to debug the
kernel using the CodeWarrior Attach launch configuration. As all the files are manually
loaded from U-Boot, these files must not be specified in the launch configuration.
The table below describes the settings you need to provide in the launch configuration.
To specify the launch configuration settings in CodeWarrior:
1. Select Run > Debug Configurations.
CodeWarrior Development Studio for Power Architecture Processors Targeting Manual, Rev. 10.5.0,
06/2015
320
Freescale Semiconductor, Inc.
Chapter 7 Debugging Embedded Linux Software
2. Enter the launch configuration settings, given in the table below, in the Debug
Configurations dialog box.
Table 7-7. Kernel Project Attach Launch Configuration
Settings
Debug Window Component
Settings
Main Tab
Select an appropriate system (if existing) from the Connection
drop-down list or define a new system.
• To define a new system, click New.
• Select Hardware or Simulator Connection from the
CodeWarrior Bareboard Debugging list. Click Next.
• Specify a name and a description for the connection.
• Select an appropriate target (if existing) from the Target
drop-down list or define a new target.
• To define a new target, click New on the Hardware or
Simulator Connection dialog box.
• Select Hardware or Simulator Target from the
CodeWarrior Bareboard Debugging list. Click Next.
• Specify a name and a description for the target.
• Select a target from the Target type drop-down list. On the
Initialization tab, ensure there are no initialization files
selected.
• Click Finish to create the target and close the Hardware
or Simulator Target dialog box.
• Select the type of connection you will use from the
Connection type drop-down list.
• Click Finish.
• Select all the cores on which Linux is running (for example,
core 0 for single-core or cores 0-7 for 8-core SMP).
Debugger Tab > Debugger options >
Symbolics Tab
Select the Cache Symbolics between sessions checkbox. The
symbolics are loaded from the elf file to the debugger for the first
session only. This shows a speed improvement for
vmlinux.elf as the size is bigger than around 100 MB.
Debugger Tab > Debugger options > OS
Awareness Tab
Select Linux from the Target OS drop-down list.
Debugger Tab > Debugger options > OS
Awareness Tab > Boot Parameters
Disable all settings on the Boot Parameters tab.
Debugger Tab > Debugger options > OS
Awareness Tab > Debug Tab
Debug tab
• Select the Enable Memory Translation checkbox
NOTE:
For details on the options available on the
Boot Parameters tab, see Setting up RAM
disk.
Physical Base Address is set to value
CONFIG_KERNEL_START (0x0)
Virtual Base Address is set to value
CONFIG_KERNEL_START (0xc000 0000 for 32 bits, and
0xC000 0000 0000 0000 for 64bits).
• Memory Size is the kernel space translation size.
NOTE:
The values shown above should be set as
configured in the linux config file
(.config). You can read the MMU
registers to verify what you have configured
and do a correction, if required.
CodeWarrior Development Studio for Power Architecture Processors Targeting Manual, Rev. 10.5.0,
06/2015
Freescale Semiconductor, Inc.
321
Debugging the Linux Kernel
Table 7-7. Kernel Project Attach Launch Configuration
Settings
Debug Window Component
Settings
• Select Enable Threaded Debugging Support checkbox
• Select Enable Delayed Software Breakpoint Support
• If required, also select Update Background Threads on
Stop. When enabled, the debugger reads the entire thread
list when the target is suspended. This decreases the
speed. If the option is disabled, the speed is increased but
the Debug window might show non-existent threads, as
the list is not refreshed.
3. Click the Source page to specify path mappings. Path mappings are not required if
the debug host is similar to the compilation host. If the two hosts are separate,
the .elf file contains the paths for the compilation host. Specifying the path mappings
helps establish paths from compilation host to where the sources are available to be
accessed by the debugger on the debugger host. If no path mapping is specified,
when you perform a debug on the specified target, a source file missing message
appears (shown in the figure below).
Figure 7-33. Debug View When No Path Mapping is Specified
CodeWarrior Development Studio for Power Architecture Processors Targeting Manual, Rev. 10.5.0,
06/2015
322
Freescale Semiconductor, Inc.
Chapter 7 Debugging Embedded Linux Software
You can specify the path mappings, either by adding a new path mapping on the
Source tab or by clicking the appropriate buttons (Locate File, Edit Source Lookup
Path) that appear when a source path mapping is not found.
4. Click Apply to save the settings.
5. Click Close.
7.7.6.3 Setting up RAM disk
This section describes specifying RAM disk information that is used by the Linux kernel
when it is booted.
You can specify RAM disk information in the Boot Parameters tab, which is present on
the OS Awareness tab of the Debugger tab of the Debug Configurations dialog box, as
shown in the figure below. Table 7-8 lists the instructions to set up the RAM disk.
Figure 7-34. Kernel Debug - OS Awareness Tab
Depending on the method you choose for passing parameters to the kernel during kernel
initialization, the RAM disk information can be provided in any of the following ways:
CodeWarrior Development Studio for Power Architecture Processors Targeting Manual, Rev. 10.5.0,
06/2015
Freescale Semiconductor, Inc.
323
Debugging the Linux Kernel
• Flattened Device Tree Initialization : Specifying a device tree file that contains
initialization information.
• Regular Initialization : Parameters are passed through command line settings using
the Boot Parameters tab.
7.7.6.3.1
Flattened Device Tree Initialization
To follow the Flattened device tree initialization method:
1.
2.
3.
4.
5.
Open the Debug Configurations dialog box.
Select the Debugger tab.
From the Debugger options panel, select the OS Awareness tab.
From the Target OS drop-down list, select Linux.
On the Boot Parameters tab, select the Enable Initial RAM Disk Settings
checkbox.
The options in this group activate.
6. In the File Path field, type the path of the RAM disk.
Alternatively, click Browse to display a dialog box that you can use to select this
path.
NOTE
The RAM disk is created by the build tool and not by the
kernel. It contains the initial file system. For details, see the
SDK User Manual in iso/help/documents/pdf.
7. In the Address text box, enter 0x02000000, or another appropriate base address where
you want the RAM disk to be written.
NOTE
Ensure that the address you specify does not cause the
RAM disk to overwrite the kernel. The kernel is loaded to
0x00000000. The address you specify should be greater than
the size, in bytes, of the uncompressed Linux kernel with
no debug symbols.
NOTE
If you use a DTB file, ensure to use the same addresses for
RAM disk and initial RAM disk (initrd) start value from
the chosen section. The kernel must find the RAM disk at
the address specified in the .dtb file.
CodeWarrior Development Studio for Power Architecture Processors Targeting Manual, Rev. 10.5.0,
06/2015
324
Freescale Semiconductor, Inc.
Chapter 7 Debugging Embedded Linux Software
8. In the Size text box, enter the size of the RAM disk file. To copy all the contents of
the RAM disk file, enter zero (0).
9. Select the Download to target checkbox to download the RAM disk file to the target
board.
The debugger copies the initial RAM disk to the target board only if this checkbox is
checked.
NOTE
Most embedded development boards do not just use a small
initial RAM disk, but a large root file system. The
Download to target option works in both the cases, but for
large file systems it is better to deploy the file directly to
the target in the flash memory and not have it downloaded
by the debugger.
7.7.6.3.2
Regular Initialization
To follow the regular initialization method:
1.
2.
3.
4.
5.
Open the Debug Configurations dialog box.
Select the Debugger tab.
From the Debugger options panel, select the OS Awareness tab.
From the Target OS drop-down list, select Linux.
On the Boot Parameters tab, select the Enable Command Line Settings checkbox.
The options in this group activate.
6. Specify the RAM disk parameters for use in the Command Line field. For example:
• You can specify the following when the regular initialization of the kernel is
used:
root=/dev/ram rw"
• Sample NFS parameters:
"root=/dev/nfs ip=10.171.77.26
nfsaddr=10.171.77.26:10.171.77.21
nfsroot=/tftpboot/10.171.77.26"
"root=/dev/nfs rw
nfsroot=10.171.77.21:/tftpboot/10.171.77.26
ip=10.171.77.26:10.171.77.21:10.171.77.254:255.255.255.0:8280x:eth0:off"
where, 10.171.77.21 is the IP address of the NFS server and 10.171.77.26 is the IP
address of the target platform.
is a directory on the host computer where the target
platform file system is located.
"/tftpboot/10.171.77.26"
CodeWarrior Development Studio for Power Architecture Processors Targeting Manual, Rev. 10.5.0,
06/2015
Freescale Semiconductor, Inc.
325
Debugging the Linux Kernel
"8280x"
is the host name.
• Sample flash parameters: root=/dev/mtdblock0
or root=/dev/mtdblock2
(depending on your configuration)
7.7.6.4 Using Open Firmware Device Tree Initialization method
You can use the Open Firmware Device Tree Initialization method as an alternate way of
loading parameters to the kernel from a bootloader on Power Architecture processors.
Since downloading the kernel with the CodeWarrior IDE emulates bootloader behavior,
the IDE provides this way of passing the parameters to the kernel.
Use of the Open Firmware Device Tree initialization method consists of several general
actions, discussed below in the order of their execution:
• Obtaining a device tree settings (.dts) file (see Obtaining a DTS File).
This is a text file that contains the kernel setup information and parameters.
• Editing the settings (.dts) file (see Editing the DTS File).
Edit the file with information relevant to the current target board and kernel.
• Compiling the settings (.dts) file to a binary file (.dtb), if you want to use a .dtb file
(see Compiling the DTS file).
The binary file is the one downloaded to the board to set up the kernel parameters.
• Using the .dtb binary file in the CodeWarrior IDE (in the Boot Parameters tab) (see
Configuring an Attach Kernel Debug Scenario).
7.7.6.4.1
Obtaining a DTS File
To obtain a device tree source file that can be used with CodeWarrior:
1. Configure a TFTP server on a Linux PC.
2. Copy the Linux images on the TFTP server PC in the specific directory. The
following files are needed:
• uImage
CodeWarrior Development Studio for Power Architecture Processors Targeting Manual, Rev. 10.5.0,
06/2015
326
Freescale Semiconductor, Inc.
Chapter 7 Debugging Embedded Linux Software
(if this is not present, check if the Target Image Generation
> Create a ramdisk that can be used by u-boot option is enabled.
• A device tree blob (DTB) obtained from the kernel sources. To convert this into
a DTB, use the Device Tree Compiler (DTC) that is available in the BSP:
•
rootfs.ex2.gz.uboot
dtc -f
-b 0 -S 0x3000 -R 8 -I dtb -O dts
<target>.dtb > <target>.dts
NOTE
Standard DTS files are available along with Linux
kernel source files in <SDK_Linux_sources_root>/arch/
powerpc/boot/dts. For the exact location of where the
kernel images are stored, see the SDK User Manual
from iso/help/documents/pdf.
3. Power on the target. Wait until the uboot prompt is displayed.
4. Ensure that networking is working on the target. You need to have a network cable
plugged in and set several variables (ipaddr, netmask, serverip, gatewayip), including
the IP address of the TFTP server. For example,
ipaddr=10.171.77.230
netmask=255.255.255.0
serverip=10.171.77.192
gatewayip=192.168.1.1
5. Check that network connectivity is working by pinging the TFTP server.
ping $serverip
6. On the uboot prompt, download the DTS and configure it for the current target. For
example,
tftp 3000000 /tftpboot/<target>.dtb
fdt addr 0x3000000
fdt boardsetup
fdt print
7. Copy the output of this command as a DTS file.
8. Modify the memreserve statement at the beginning of the DTS fie. The first
parameter is the start address of the memory reserved for the RAM disk. The second
parameter is the size of the RAM disk and must be modified each time the RAM disk
is repackaged as you might add additional packages to the RAM disk. For example,
/memreserve/ 0x20000000 0x453ecc;
9. Modify the chosen node in the DTS file. The linux,initrd-start argument must be the
start address of the RAM disk, and the linux,initrd-end value must be the end address
of the RAM disk. For example,
chosen {
linux,initrd-start = <0x2000000>;
linux,initrd-end = <0x2453ecc>;
linux,stdout-path = "/soc8572@ffe00000/serial@4500";
};
10. Ensure that the frequencies of the target are correct. If the DTS was generated in UBoot as described above, the frequencies should be correct. However, if you update
CodeWarrior Development Studio for Power Architecture Processors Targeting Manual, Rev. 10.5.0,
06/2015
Freescale Semiconductor, Inc.
327
Debugging the Linux Kernel
an existing DTS file for a new board revision, the frequencies might have changed
and they need to be corrected in the DTS file.
a. At the U-Boot prompt, inspect the current configuration.
bdinfo
...
intfreq = 1500 MHz
busfreq = 600 MHz
...
b. The intfreq value from the U-Boot output must be converted to a hexadecimal
value and added to the clock-frequency value of the CPU node in the DTS file.
The busfreq value must be placed in the same way in the bus-frequency
parameter. For example,
cpus {
PowerPC,<target>@0 {
...
timebase-frequency = <0x47865d2>;
bus-frequency = <0x23c34600>;
clock-frequency = <0x5967f477>;
};
};
c. The same busfreq value is the clock frequency for the serial ports and must be
updated in the DTS file also:
serial0: serial@4500 {
...
clock-frequency = <0x23c34600>;
};
NOTE
If you are using hardware for kernel debugging, see
Editing the DTS File.
7.7.6.4.2
Editing the DTS File
If you have a DTS file specifically designed for your target board, you should modify
only the RAM disk end address and reserved memory area, in case you are using a RAM
disk.
A standard .dts text file has a number of nodes which are given no value (actually <0>)
or are missing nodes (for example, the /chosen branch).
When the Linux kernel is started from U-Boot with bootm, U-Boot dynamically edits the .dtb
file in RAM so as to fill in the missing values and add the /chosen branch, based on the UBoot environment variables.
The CodeWarrior IDE does not fill in the missing values and branches when it downloads
the .dtb file to RAM. You must manually create and compile a separate and
complete .dts file.
CodeWarrior Development Studio for Power Architecture Processors Targeting Manual, Rev. 10.5.0,
06/2015
328
Freescale Semiconductor, Inc.
Chapter 7 Debugging Embedded Linux Software
The following steps detail the changes that must be applied to the .dts file so the kernel
boots successfully when the CodeWarrior IDE loads the .dtb file into RAM with a Linux
kernel and a initial RAM disk.
1. Update the bus-frequency and clock-frequency nodes from the value KRD=>bi_busfreq
2. Update the clock-frequency nodes from the value KRD=>bi_initfreq:
3. Update the following nodes from the value KRD=>bi_tbfreq:
/cpus/ PowerPC,8349@0/timebase-frequency
4. Create the following node from the size on disk of the file entered in LKBP=>Enable
Initial RAM Disk=>File Path or from the address entered in LKBP=>Enable Initial
RAM Disk=>Address:
/memreserve/
5. Create the following node from LKBP=>Command Line:
/chosen/bootargs
6. Create the node:
linux,stdout-path
7. Create the following node from the address entered in LKBP=>Enable Initial RAM
Disk=>Address:
/chosen/linux,initrd-start
8. Create the following node from the size on disk of the file entered in LKBP=>Enable
Initial RAM Disk=>File Path and from the address entered in LKBP=>Enable Initial
RAM Disk=>Address:
/chosen/linux,initrd-end
7.7.6.4.3
Compiling the DTS file
1. Ensure that you have the DTC device tree compiler on your host machine.
If the DTC device tree compiler is missing, get the latest DTC source archive from
bitshrine.org. Extract the archive, run make, and put the binary somewhere reachable
by your PATH.
wget
wget
wget
wget
dtc-20070307.tar.bz2
dtc-20070307.tar.bz2.md5
dtc-20070307.tar.gz
dtc-20070307.tar.gz.md5
2. Navigate to the folder containing DTS files.
CodeWarrior Development Studio for Power Architecture Processors Targeting Manual, Rev. 10.5.0,
06/2015
Freescale Semiconductor, Inc.
329
Debugging the Linux Kernel
NOTE
The location of the DTS file might differ based on the BSP
version being used. For the correct location of the file, see
the SDK User Manual in iso/help/documents/pdf.
3. Compile the .dts device tree source file for the board:
$ cd arch/powerpc/boot/dts
$ dtc -I dts -O dtb -V 0x10 -b 0 <target>.dts > <target>.dtb
7.7.6.4.4
Testing a DTB File
To test the DTB file outside of the CodeWarrior IDE:
1. Load the uImage, rootfs.ext2.gz.uboot, and <target>.dtb file onto the board.
2. Boot the board and verify that Linux comes up fine.
$ bootm <kerneladdress> <ramdiskaddress> <dtbaddress>
NOTE
The target board must have U-Boot present in the flash at
the reset address so that U-Boot can run and set board
configurations.
7.7.6.4.5
Modifying a DTS file
If using a BSP version not supported by CodeWarrior DTS file or a custom board:
1. Obtain a DTS file.
NOTE
The location of the DTS file might differ based on the BSP
version being used. For the correct location of the file, see
the SDK User Manual in iso/help/documents/pdf.
2. Modify this DTS file with the information provided by U-Boot. To do this:
• Check the /proc/device-tree/ directory for the required information after kernel
boot from U-Boot.
Alternatively, you may:
• Enable ft_dump_blob call from the u-boot/common/cmd_bootm.c file. By default this
is disabled.
CodeWarrior Development Studio for Power Architecture Processors Targeting Manual, Rev. 10.5.0,
06/2015
330
Freescale Semiconductor, Inc.
Chapter 7 Debugging Embedded Linux Software
• Build the U-Boot and write it on the target to have this enabled when booting the
kernel.
• After this, configure U-Boot as described in the BSP documentation to boot the
kernel and save the boot log.
• Check the device tree displayed during kernel boot and accordingly modify your
DTS file.
7.7.7 Debugging the kernel to download the kernel, RAM disk,
and device tree
This section describes how to debug the Linux kernel using CodeWarrior IDE to
download the kernel, RAM disk, and device tree.
Perform the following steps:
1. Create a project for the Linux kernel image. See Creating a CodeWarrior Project
using the Linux Kernel Image.
2. Configure the launch configuration for Linux kernel debug.
a. Select Run > Debug Configurations.
The Debug Configurations dialog box appears.
b. From the left pane, in the CodeWarrior group, select the appropriate launch
configuration.
c. On the Main page, in the Connection panel, select the appropriate system from
the Connection drop-down list.
d. Click Edit.
The Properties for <connection> window appears.
e. Click Edit next to the Target drop-down list.
The Properties for <Target> dialog box appears.
f. On the Initialization tab, select the checkboxes for all the cores in the Run out
of reset column.
g. In the Initialize target column, select the checkbox for core 0.
h. Click the ellipses button in the Initialize target script column.
The Target Initialization dialog box appears.
i. Click File System and select the target initialization file from the following path:
<CWInstallDir>\PA\PA_Support\Initialization_Files\<Processor Family>
\<target>_uboot_init_Linux.tcl
CodeWarrior Development Studio for Power Architecture Processors Targeting Manual, Rev. 10.5.0,
06/2015
Freescale Semiconductor, Inc.
331
Debugging the Linux Kernel
NOTE
The initialization file is automatically set when you
select Linux Kernel as the Target OS, while creating
a new project using the New Power Architecture
Project wizard.
Click OK to close the Memory Configuration File dialog box.
Click OK to close the Properties for <Target> dialog box.
Click OK to close the Properties for <connection> dialog box.
On the Debug tab of the Debugger tab, select an Program execution option, to
stop the debug process at the program entry point or at a specified user function
or address like start_kernel.
n. On the OS Awareness tab of the Debugger tab, select Linux from the Target
OS drop-down list.
o. On the Boot Parameters tab of the OS Awareness tab:
1. Select the Enable Initial RAM Disk Settings checkbox.
j.
k.
l.
m.
The fields in that panel are enabled.
2. In the File Path text box, enter the location of the BSP file, rootfs.ext2.gz.
3. In the Address text box, enter the address where you want to add the RAM
disk.
4. In the Size text box enter 0 if you want the entire RAM disk to be
downloaded.
5. Select the Open Firmware Device Tree Settings checkbox.
6. In the File Path text box, enter the location of the device tree file.
7. In the Address text box, enter the location in memory where you want to
place the device tree.
NOTE
Ensure that the memory areas for kernel, RAM
disk, and device tree do not overlap.
p. Click Apply to save the settings you made to the launch configuration.
3. Click Debug to start debugging the kernel.
NOTE
If the kernel does not boot correctly, check the values
entered in the Boot Parameters tab. Also ensure that you
provided a valid device tree and RAM disk.
CodeWarrior Development Studio for Power Architecture Processors Targeting Manual, Rev. 10.5.0,
06/2015
332
Freescale Semiconductor, Inc.
Chapter 7 Debugging Embedded Linux Software
7.7.8 Debugging the kernel based on MMU initialization
This section describes how to debug the Linux kernel based on whether the MMU is
disabled, being enabled, or enabled.
Debugging the Linux kernel involves three stages with different views and functionality:
• Debugging the Kernel before the MMU is Enabled
• Debugging the Kernel while the MMU is being Enabled
• Debugging the Kernel after the MMU is Enabled
NOTE
You can debug the kernel on all stages from 0x0 till start_kernel
and further, without the need of PIC changes, breakpoints at
start_kernel, and multiple debug sessions.
7.7.8.1 Debugging the Kernel before the MMU is Enabled
This procedure shows how to debug the kernel before the memory management unit
(MMU) is initialized. You can always debug assembly before virtual addresses are being
used, without setting the alternate load address.
To debug the kernel before the MMU is enabled, follow these steps:
1. Select Run > Debug Configurations from the CodeWarrior menu bar to open the
Debug Configurations dialog box.
2. From the Debugger page, select the PIC tab.
3. Select the Alternate Load Address checkbox.
4. In the Alternate Load Address field, type the hexadecimal form of the memory
address (for example, 0x00000000).
5. Click Apply. The CodeWarrior IDE saves your changes to the launch configuration.
6. Click Debug. The Debug perspective appears.
7. Set a breakpoint early in head_fsl_booke.S.
You can perform source level debug until the rfi instruction in head_fsl_booke.S.
CodeWarrior Development Studio for Power Architecture Processors Targeting Manual, Rev. 10.5.0,
06/2015
Freescale Semiconductor, Inc.
333
Debugging the Linux Kernel
Figure 7-35. Kernel Debug - Before MMU is Enabled
NOTE
You must stop the debug session and clear the Alternate Load
Address checkbox in the PIC tab to debug after the rfi
instruction in head_fsl_booke.S.
7.7.8.2 Debugging the Kernel while the MMU is being Enabled
CodeWarrior Development Studio for Power Architecture Processors Targeting Manual, Rev. 10.5.0,
06/2015
334
Freescale Semiconductor, Inc.
Chapter 7 Debugging Embedded Linux Software
This procedure shows how to debug the kernel while the memory management unit is
being initialized.
To debug this section of code, ensure that the Alternate Load Address checkbox in the
PIC tab is disabled.
7.7.8.3 Debugging the Kernel after the MMU is Enabled
This procedure shows how to debug the kernel after the memory management unit is
initialized.
To debug the kernel after the MMU is enabled, follow these steps:
1. Select Run > Debug Configurations from the CodeWarrior menu bar to open the
DebugConfigurations dialog box.
2. From the Debugger tab, select the PIC tab.
3. Clear the Alternate Load Address checkbox.
4. Click Apply.
5. Click Debug to start the debug session. The Debug perspective appears.
6. In the editor area, set a breakpoint at start_kernel, after the eventpoint, in main.c. This
will stop the debug session at start_kernel function (shown in the figure below).
CodeWarrior Development Studio for Power Architecture Processors Targeting Manual, Rev. 10.5.0,
06/2015
Freescale Semiconductor, Inc.
335
Debugging the Linux Kernel
7. Click Run.
Figure 7-36. Kernel Debug - After MMU is Enabled
The debugger halts execution of the program at whatever breakpoints have been set
in the project (if any breakpoints have been set).
8. Run through the rest of the code until the kernel starts to boot.
When the kernel boots, boot status messages appear in the simulator window.
CodeWarrior Development Studio for Power Architecture Processors Targeting Manual, Rev. 10.5.0,
06/2015
336
Freescale Semiconductor, Inc.
Chapter 7 Debugging Embedded Linux Software
NOTE
You can click Terminate to halt running of the kernel and
set breakpoint/watchpoints in the debug window, as shown
in the figure below.
Figure 7-37. Kernel Stopped by User
9. Continue debugging.
10. When finished, you can either:
a. Kill the process by selecting Run > Terminate.
b. Leave the kernel running on the hardware.
CodeWarrior Development Studio for Power Architecture Processors Targeting Manual, Rev. 10.5.0,
06/2015
Freescale Semiconductor, Inc.
337
Debugging the Linux Kernel
7.7.9 Debugging the kernel by attaching to a running U-Boot
This section explains how to debug the Linux kernel by attaching it to a running U-Boot.
To debug the kernel by attaching to a running U-Boot, perform the following:
1. Create a project for the Linux kernel image. For more details, see Creating a
CodeWarrior Project using the Linux Kernel Image.
2. Configure the launch configuration for Linux kernel debug. For more details, see
Configuring an Attach Kernel Debug Scenario.
3. Select Run > Debug Configurations. The Debug Configurations dialog box
appears.
4. From the left pane, expand the CodeWarrior Attach tree and select the appropriate
launch configuration.
5. From the Debugger tab, select the PIC tab.
6. Clear the Alternate Load Address checkbox.
7. Click Apply.
8. Click Debug to start the debug session. The Debug perspective appears.
9. While the U-Boot is running, attach the target.
The debugger displays a warning, in the console, as the kernel is not being executed
on the target.
NOTE
For multi-core processors, only core0 is targeted in the
Debug view. This is normal as the secondary cores are
initialized in the Linux kernel after MMU initialization.
CodeWarrior will automatically add other cores, in the
Debug view, after the kernel initializes the secondary
cores.
10. Set software or hardware breakpoints for any stage (before or after MMU
initialization).
To set a software breakpoint for the entry point address (for example, address
issue the following command in the Debugger Shell view.
0x0),
bp 0x0
11. Using the U-boot console, load the Linux kernel, DTB file, and RAM disk/rootfs
from flash or from TFTP.
12. Debug the kernel.
CodeWarrior Development Studio for Power Architecture Processors Targeting Manual, Rev. 10.5.0,
06/2015
338
Freescale Semiconductor, Inc.
Chapter 7 Debugging Embedded Linux Software
The debugger halts execution of the program at whatever breakpoints have been set
in the project. Typical stages involved in debugging the kernel are discussed below:
a. Debugging the kernel at the entry point
The CodeWarrior debugger will stop at the kernel entry point, if any software or
hardware breakpoint has been set for entry point.
NOTE
For the debugger to stop at the kernel entry point, set a
breakpoint before loading the kernel from the U-boot
console.
At the entry point, the MMU is not initialized and therefore debugging before
MMU initialization also applies in this stage.
b. Debugging the Kernel before the MMU is enabled
Being in early debug stage, the user should set the correct PIC value, to see the
source correspondence, by issuing the setpicloadaddr 0x0 command in the
Debugger Shell view.
Before setting a breakpoint for the stage after MMU initialization (for example,
breakpoint at start_kernel) the correct PIC should be set, by issuing the
setpicloadaddr reset command in the Debugger Shell view. This is required to
ensure that the new breakpoint is set with the correct PIC for the stage after
MMU initialization.
The user can set breakpoints and run/step to navigate, before MMU
initialization. The correct PIC should be set by issuing the setpicloadaddr reset
command in the Debugger Shell view, before the debuggers enters the next
stage.
c. Debugging the Kernel after the MMU is enabled
After the MMU is initialized, the PIC value must be reset y issuing the
setpicloadaddr reset command in the Debugger Shell view. During the Linux
Kernel booting, you can debug this stage directly, if no breakpoint has been set
for the stage before MMU initialization. Alternatively, you can also debug this
stage after run or step from the stage before initialization.
NOTE
In case of SMP, all the secondary cores are targeted
and displayed in the Debug view.
13. When finished, you can either:
a. Kill the process by selecting Run > Terminate.
CodeWarrior Development Studio for Power Architecture Processors Targeting Manual, Rev. 10.5.0,
06/2015
Freescale Semiconductor, Inc.
339
Debugging Loadable Kernel Modules
b. Leave the kernel running on the hardware.
7.8 Debugging Loadable Kernel Modules
This section explains how to use the CodeWarrior debugger to debug a loadable kernel
module.
• Loadable Kernel Modules - An Introduction
• Creating a CodeWarrior Project from the Linux Kernel Image
• Configuring the Modules' Symbolics Mapping
7.8.1 Loadable Kernel Modules - An Introduction
The Linux kernel is a monolithic kernel, that is, it is a single, large program in which all
the functional components of the kernel have access to all of its internal data structures
and routines. Alternatively, you may have a micro kernel structure where the functional
components of the kernel are broken into pieces with a set communication mechanism
between them. This makes adding new components to the kernel using the configuration
process very difficult and time consuming. A more reliable and robust way to extend the
kernel is to dynamically load and unload the components of the operating system using
Linux loadable kernel modules.
A loadable kernel module is a binary file that you can dynamically link to the Linux
kernel. You can also unlink and remove a loadable kernel module from the kernel when
you no longer need it. Loadable kernel modules are used for device drivers or pseudodevice drivers, such as network drivers and file systems.
When a kernel module is loaded, it becomes a part of the kernel and has the same rights
and responsibilities as regular kernel code.
Debugging a loadable kernel module consists of several general actions, performed in the
following order:
1. Create a CodeWarrior Linux kernel project for the loadable kernel module to be
debugged. See Creating a CodeWarrior Project from the Linux Kernel Image
2. Add the modules and configure their symbolics mapping. See Configuring the
Modules' Symbolics Mapping
CodeWarrior Development Studio for Power Architecture Processors Targeting Manual, Rev. 10.5.0,
06/2015
340
Freescale Semiconductor, Inc.
Chapter 7 Debugging Embedded Linux Software
7.8.2 Creating a CodeWarrior Project from the Linux Kernel
Image
The steps in this section show how to create a CodeWarrior project from a Linux kernel
image that contains symbolic debugging information.
NOTE
The following procedure assumes that you have made an
archive of the Linux kernel image and transferred it to the
Windows machine. For kernel modules debugging, ensure that
you build the kernel with loadable module support and also
make an archive for the rootfs directory, which contains the
modules for transferring to Windows.
1.
2.
3.
4.
Launch CodeWarrior IDE.
Select File > Import. The Import wizard appears.
Expand the CodeWarrior group and select CodeWarrior Executable Importer.
Click Next.
The Import a CodeWarrior Executable file page appears.
5. Specify a name for the project, to be imported, in the Project name text box.
6. If you do not want to create your project in the default workspace:
a. Clear the Use default location checkbox.
b. Click Browse and select the desired location from the Browse For Folder
dialog box.
c. In the Location text box, append the location with the name of the directory in
which you want to create your project.
NOTE
An existing directory cannot be specified for the project
location.
7. Click Next.
The Import C/C++/Assembler Executable Files page appears.
8.
9.
10.
11.
Click Browse next to the Executable field.
Select the vmlinux.elf file.
Click Open.
From the Processor list, expand the processor family and select the required
processor.
CodeWarrior Development Studio for Power Architecture Processors Targeting Manual, Rev. 10.5.0,
06/2015
Freescale Semiconductor, Inc.
341
Debugging Loadable Kernel Modules
12. Select Bareboard Application from the Toolchain group.
13. Select Linux Kernel from the Target OS list.
14. Click Next.
The Debug Target Settings page appears.
15. From the Debugger Connection Types list, select the required connection type.
16. Specify the settings, such as board, launch configuration, connection type, and TAP
address if you are using Ethernet or Gigabit TAP.
17. Click Next.
The Configuration page appears.
18. From the Core index list, select the required core.
19. Click Finish.
The wizard creates a project according to your specifications. You can access the
project from the CodeWarrior Projects view on the Workbench.
20. Configure the launch configuration for linux kernel debug.
a. Select Run > Debug Configurations.
The Debug Configurations dialog box appears.
21. Enter the launch configuration settings in the Debug Configurations dialog box. The
table below lists the launch configuration settings.
Table 7-8. Kernel Project Download Launch Configuration
Settings
Debug Window Component
Main Tab
Settings
Select an appropriate system (if existing) from the Connection
drop-down list or define a new system.
• To define a new system, click New.
• Select Hardware or Simulator Connection from the
CodeWarrior Bareboard Debugging list. Click Next.
• Specify a name and a description for the connection.
• Select an appropriate target (if existing) from the Target
drop-down list or define a new target.
• To define a new target, click New on the Hardware or
Simulator Connection dialog box.
• Select Hardware or Simulator Target from the
CodeWarrior Bareboard Debugging list. Click Next.
• Specify a name and a description for the target.
• Select a processor from the Target type drop-down list.
On the Initialization tab, ensure that there are no
initialization files selected.
• Click Finish to create the target and close the Hardware
or Simulator Target dialog box.
• Select the type of connection you will use from the
Connection type drop-down list.
Table continues on the next page...
CodeWarrior Development Studio for Power Architecture Processors Targeting Manual, Rev. 10.5.0,
06/2015
342
Freescale Semiconductor, Inc.
Chapter 7 Debugging Embedded Linux Software
Table 7-8. Kernel Project Download Launch Configuration Settings
(continued)
Debug Window Component
Settings
• Click Finish.
• Select all the cores on which Linux is running (for example,
core 0 for single-core or cores 0-7 for 8-core SMP).
Debugger Tab > Debugger options >
Symbolics Tab
Select the Cache Symbolics between sessions checkbox. The
symbolics are loaded from the elf file to the debugger for the first
session only. This shows a speed improvement for
vmlinux.elf as the size is bigger than around 100 MB.
Debugger Tab > Debugger options > OS
Awareness Tab
Select Linux from the Target OS drop-down list.
Debugger Tab > Debugger options > OS
Awareness Tab > Boot Parameters Tab
Select the Enable Initial RAM Disk Settings checkbox
• File Path: Path of the RAM disk that you transferred from
the Linux machine
• Address: The address specified in Linux, initrd-start from
the dts file
Select the Download to target checkbox
Select the Open Firmware Device Tree Settings checkbox
• File Path: Path to the <target>.dtb file
• Address: 0x00600000
Debugger Tab > Debugger options > OS
Awareness Tab > Debug Tab
• Select the Enable Memory Translation checkbox
Physical Base Address is set to value
CONFIG_KERNEL_START (0x0)
Virtual Base Address is set to value
CONFIG_KERNEL_START (0xc000 0000 for 32 bits, and
0xC000 0000 0000 0000 for 64bits).
• Memory Size is the kernel space translation size.
NOTE:
The values shown above should be set as
configured in the linux config file
(.config). You can read the MMU
registers to verify what you have configured
and do a correction, if required.
Select the Enable Threaded Debugging Support checkbox
Select the Enable Delayed Software Breakpoint Support
checkbox
Debugger Tab > Debugger options > OS
Awareness Tab > Modules Tab
• Select the Detect module loading checkbox
• Click Add to insert the kernel module file. See Configuring
the Modules' Symbolics Mapping
• Select the Prompt for symbolics path if not found
checkbox
22. Click the Source page to add source mappings for rootfs and linux-<version>.
23. Click Apply to save the settings.
7.8.3 Configuring the Modules' Symbolics Mapping
CodeWarrior Development Studio for Power Architecture Processors Targeting Manual, Rev. 10.5.0,
06/2015
Freescale Semiconductor, Inc.
343
Debugging Loadable Kernel Modules
You can use the Modules tab (shown in the figure below) in the Debug Configurations
dialog box to add modules to the Linux kernel project and configure the module's
symbolics mapping.
Figure 7-38. Kernel Module Debug - Modules Tab
The table below describes the various options available on the Modules tab.
Table 7-9. Kernel Module Project Launch Configuration - Modules Tab
Settings
Option
Description
Detect module loading
Enables the debugger to detect module load events and insert an
eventpoint in the kernel. Disabling this setting delays the module loading.
This is useful in scenarios where multiple modules are loaded to the kernel
and not all of them need to be debugged. You can enable this setting
again in the Modules dialog box. The dialog box is available during the
Debug session from the System Browser View toolbar > Module tab.
Add
Adds a module name along with the corresponding symbolic path This
option displays a dialog box in the following scenarios:
• The file that you have selected is not a valid compiled kernel module
• If the selected module already exists in the list with the same path
Scan
Automatically searches for module files and populates the kernel module
list.
Remove
Removes the selected items. This button will be enabled only if a row is
selected.
Remove All
Removes all items. This button will be enabled only if the kernel list
contains any entries.
Prompt for symbolics path if not found
Prompts to locate the symbolics file if a mapping for it is not available in
the settings A Browse dialog box appears that allows you to browse for a
module file containing symbolics. The debugger will add the specified
symbolics to the modules' symbolics mapping.
Table continues on the next page...
CodeWarrior Development Studio for Power Architecture Processors Targeting Manual, Rev. 10.5.0,
06/2015
344
Freescale Semiconductor, Inc.
Chapter 7 Debugging Embedded Linux Software
Table 7-9. Kernel Module Project Launch Configuration - Modules Tab Settings (continued)
Option
Keep target suspended
Description
Keeps the target suspended after the debugger loads the symbolics file for
a module. This option is useful if you want to debug the module's
initialization code. It allows you to set breakpoints in the module's
initialization code before running it.
NOTE: This option is automatically enabled when activating the Prompt
for symbolics path if not found option.
NOTE
Breakpoints are resolved each time a symbolics file is loaded
and the debugger uses the modules unload events for symbolics
disposal and breakpoints cleanup.
7.9 Debugging Hypervisor Guest Applications
This section shows you how to debug hypervisor guest applications.
This section explains:
• Hypervisor - An Introduction
• Prerequisites for Debugging a Guest Application
• Adding CodeWarrior HyperTRK Debug Stub Support in Hypervisor for Linux
Kernel Debugging
• Preparing Connection to P4080DS Target
• Debugging AMP/SMP Guest Linux Kernels Running Under Hypervisor
• Debugging Hypervisor During the Boot and Initialization Process
7.9.1 Hypervisor - An Introduction
The embedded hypervisor is a layer of software that enables the efficient and secure
partitioning of a multi-core system.
A system's CPUs, memory, and I/O devices can be divided into groupings or partitions.
Each partition is capable of executing a guest operating system.
Key features of the hypervisor software architecture are summarized below• Partitioning: Support for partitioning of CPUs, memory, and I/O devices:
CodeWarrior Development Studio for Power Architecture Processors Targeting Manual, Rev. 10.5.0,
06/2015
Freescale Semiconductor, Inc.
345
Debugging Hypervisor Guest Applications
•
•
•
•
•
• CPUs: Each partition is assigned one or more CPU cores in the system.
• Memory: Each partition has a private memory region that is only accessible to
the partition that is assigned the memory. In addition, shared memory regions
can be created and shared among multiple partitions.
• I/O devices: P4080 I/O devices may be assigned directly to a partition (Direct
I/O), making the device a private resource of the partition, and providing optimal
performance.
Protection and Isolation: The hypervisor provides complete isolation of partitions, so
that one partition cannot access the private resources of another. The P4080 PAMU
(an iommu) is used by Topaz to ensure device-to-memory accesses are constrained to
allowed memory regions only.
Sharing: Mechanisms are provided to selectively enable partitions to share certain
hardware resources (such as memory)
Virtualization: Support for mechanisms that enable the sharing of certain devices
among partitions such as the system interrupt controller
Performance: The hypervisor software uses the features of the Freescale Embedded
Hypervisor APU to provide security and isolation with very low overhead. Guest
operating systems take external interrupts directly without hypervisor involvement
providing very low interrupt latency.
Ease of migration: The hypervisor uses a combination full emulation and paravirtualization to maintain high performance and requiring minimal guest OS changes
when migrating code from an e500mc CPU to the hypervisor.
7.9.2 Prerequisites for Debugging a Guest Application
The P4080 software bundle is the prerequisite for debugging a hypervisor guest
application using the CodeWarrior IDE.
The software bundle used in the current example is P4080 Beta 2.0.2 SW Bundle.
7.9.3 Adding CodeWarrior HyperTRK Debug Stub Support in
Hypervisor for Linux Kernel Debugging
This section explains how to add CodeWarrior HyperTRK debug stub support in the
hypervisor for guest LWE or Linux kernel debugging.
To add CodeWarrior HyperTRK debug stub support:
CodeWarrior Development Studio for Power Architecture Processors Targeting Manual, Rev. 10.5.0,
06/2015
346
Freescale Semiconductor, Inc.
Chapter 7 Debugging Embedded Linux Software
1. Download the appropriate P4080 software bundle image (the BSP in .iso format) to a
Linux computer.
2. Mount the .iso image file using this command: mount -o loop BSP-ImageName.iso /mnt/iso
3. Install the BSP image file according to the instructions given in the BSP
documentation.
4. Add CodeWarrior HyperTRK debug support to the hypervisor image (hv.uImage)
You can enable the HyperTRK debug support directly in the BSP. Alternatively, you
can modify and build the HyperTRK manually, and then enable it in the hypervisor.
Perform the steps given below:
a. Enabling HyperTRK Debug Support Directly in Build Tool
Follow this procedure only if the <CWInstallDir>/PA/PA_Tools/HyperTRK directory
does not contain any newer HyperTRK patches than the ones in the SW bundle.
b. Applying New HyperTRK Patches from CodeWarrior Install Layout
Follow this procedure to manually apply new HyperTRK patches from
CodeWarrior install layout.
c. Modifying and Building the HyperTRK Manually
Follow this procedure only if you need to modify the HyperTRK sources.
7.9.3.1 Enabling HyperTRK Debug Support Directly in Build Tool
Follow this procedure only if the <CWInstallDir>/PA/PA_Tools/HyperTRK directory does not
contain any newer HyperTRK patches than the ones in the SW bundle. In case the
<CWInstallDir>/PA/PA_Tools/HyperTRK directory contains newer HyperTRK patch, see
Applying New HyperTRK Patches from CodeWarrior Install Layout.
NOTE
For more details on configuring or compiling the Hypervisor,
refer the SDK Manual available in the iso/help/documents/pdf
folder.
7.9.3.2 Applying New HyperTRK Patches from CodeWarrior Install
Layout
CodeWarrior Development Studio for Power Architecture Processors Targeting Manual, Rev. 10.5.0,
06/2015
Freescale Semiconductor, Inc.
347
Debugging Hypervisor Guest Applications
The <CWInstallDir>/PA/PA_Tools/HyperTRK directory contains new patches. To apply the new
patches, see the procedures defined in the SDK manual.
7.9.3.3 Modifying and Building the HyperTRK Manually
To modify the HyperTRK sources.
1. Apply the new HyperTRK patches, if any (see Applying New HyperTRK Patches
from CodeWarrior Install Layout).
The hypervisor and the HyperTRK sources are extracted to this directory:
<BSP-Directory>/rpm/BUILD/embedded-hv-{version}
2. Ensure that the environment variables point to the correct compiler that BSP uses, so
that it correctly builds HyperTRK and the hypervisor.
NOTE
For more details on adding new patches, modifying the
HyperTRK and building the packet, see the SDK manual
available in the SDK Manual available in the iso/help/
documents/pdf folder.
7.9.4 Preparing Connection to P4080DS Target
This section explains how to debug AMP/SMP guest application on the P4080DS target
board.
You must have a serial cable connected between the board UART0 and the UART0 ports
of your Linux host. The debugger connects to the running mux_server from the Linux host
and then communicates with the target board through the serial connection between the
Linux host and the target board. The steps to start the mux_server are given below.
1. Telnet is not recommended to be used with the mux_server. Use socat instead. The
syntax is:
socat -,raw,echo=0 tcp:<address>:<port>
For example:
socat -,raw,echo=0 tcp:rhuath:9002
CodeWarrior Development Studio for Power Architecture Processors Targeting Manual, Rev. 10.5.0,
06/2015
348
Freescale Semiconductor, Inc.
Chapter 7 Debugging Embedded Linux Software
2. For the standalone P4080DS target board, which is connected with the serial cable,
you can use the Makefile for starting the mux_server, and the xtel shipped with the
SDK.
a. Run make xtel_P4080DS, if you want to automatically launch the mux_server, and
have eight serial consoles started.
b. Run make mux_server_P4080DS TARGET=/dev/ttyS0, which will connect the mux_server to
the /dev/ttyS0 device using the ports from 12000 to 12015. However, in this case,
you need to manually run socat to open the serial consoles.
c. If you need to change the ports, edit the tool you are using for starting the
mux_server.
d. In case you are running only the mux_server, and not the xtel, you need to open the
serial consoles for the hypervisor and the guest applications. To know on which
port you can access the serial console of the hypervisor or the guest application,
check the hypervisor device tree (the .dts file) that is used for starting the
application.
• Check for stdout nodes; for example, the hypervisor is using the hvbc node,
which is using the muxer on channel 0. This means that the hypervisor serial
console can be reached on the first port given as argument to the mux_server.
• Look at the first partition, part1; stdout is using part1_bc0, which is using
muxer channel 1. This means that the serial port will be mux_server base_port
+ 1.
The same concept applies to other partitions or other device trees as well.
7.9.5 Debugging AMP/SMP Guest Linux Kernels Running Under
Hypervisor
This section describes how to debug AMP/SMP guest Linux kernels, running under the
hypervisor.
This section explains:
• Prerequisites
• Creating an Attach Launch Configuration to Debug a Linux Partition after Kernel
Boot
• Creating a Download Launch Configuration to Debug a Linux Partition from an
Entry Point or a User-Defined Function
CodeWarrior Development Studio for Power Architecture Processors Targeting Manual, Rev. 10.5.0,
06/2015
Freescale Semiconductor, Inc.
349
Debugging Hypervisor Guest Applications
7.9.5.1 Prerequisites
As prerequisites, ensure that:
• For Download debug session, the hypervisor loads the kernel images because
CodeWarrior does not support this option.
• For Download launch configuration, the Linux partitions do not have the no-autostart option set in the hypervisor DTS file. The CodeWarrior IDE resets the Linux
partition and the hypervisor starts the partition, by default.
• If you want to use the Windows version of CodeWarrior, you need to transfer the
Linux directory along with the vmlinux.elf, the associated sources, and the used .dtb
file from the BSP directory to the Windows computer.
7.9.5.2 Creating an Attach Launch Configuration to Debug a Linux
Partition after Kernel Boot
Follow these steps:
1. Import the vmlinux.elf file from the BSP-Directory/linux directory by using the PA
ELF Import feature in CodeWarrior IDE
2. Create a new CodeWarrior Attach launch configuration. The steps that follow
describe how to configure the required settings.
3. Select the Main page.
4. Click New in the Remote System group to create a new remote system
The New Connection wizard appears.
a. In the Select Remote System Type page, expand the CodeWarrior Bareboard
Debugging group, and select TRK Connection, as shown in the figure below.
CodeWarrior Development Studio for Power Architecture Processors Targeting Manual, Rev. 10.5.0,
06/2015
350
Freescale Semiconductor, Inc.
Chapter 7 Debugging Embedded Linux Software
Figure 7-39. Select Remote System Type Dialog Box
b. Click Next.
The TRK Connection window appears.
c. Click Edit next to the Target drop-down list.
The Properties for <target> window appears.
d. Click Edit next to the Target type drop-down list
The Target Types dialog box appears.
e. Click Import and import the used hypervisor .dtb file.
f. Click OK to close the Target Types dialog box.
g. Configure the following settings in the Properties for <target> window.
CodeWarrior Development Studio for Power Architecture Processors Targeting Manual, Rev. 10.5.0,
06/2015
Freescale Semiconductor, Inc.
351
Debugging Hypervisor Guest Applications
• In the Initialization tab, ensure that Execute target reset checkbox is not
selected.
• In the Memory tab, do not add any memory configuration files for the
debugged Linux partition cores
h. Click OK.
The TRK Connection page reappears.
i. Select Trk Muxer in the Connectiontype drop-down list.
• Select Use existing host muxer process, and type the IP address of the
Linux host on which the mux_server is running.
• Alternatively, for Linux host only, you can select Launch host muxer
process for automatically launching the muxer process. If you follow this
step, you need to select the mux_server executable, and a TCP/IP target muxer
with an IP address and a starting port on which you want to launch the
mux_server.
• For TRK muxer ports, click Sequence and type the first port on which the
mux_server started.
The channels and ports on which the debugger accesses the cores appear.
• The channels must correspond to the trk-stub's mux channels added in the
hypervisor dts file.
j. Click Finish.
The New Connection wizard disappears and the new remote system that you
just created appears in Connection drop-down list in the Remote system group.
5. Select all the cores that you want to debug from the Linux partition
NOTE
You can use the new remote system, which you just
created, in other launch configurations also by selecting
different cores and making other necessary adjustments.
6. Select the Debugger page to configure the debugger specific settings
a. In the Debugger options group, select the OS Awareness tab
b. Select Linux in the Target OS drop-down list. Note that it is mandatory to
select Linux for the specific scenario described in this section.
The Boot Parameters, Debug and Modules tabs appear
In the Boot Parameters tab:
• Disable all the options available on this tab.
In the Debug tab:
CodeWarrior Development Studio for Power Architecture Processors Targeting Manual, Rev. 10.5.0,
06/2015
352
Freescale Semiconductor, Inc.
Chapter 7 Debugging Embedded Linux Software
• Select the Enable Memory Translation checkbox, and configure it
according to the Linux MMU settings. For example:
Physical Base Address
Virtual Base Address
Memory Size
0x0
0xc0000000
0x20000000
• Select the Enable Threaded Debugging Support checkbox
• The Update Background Threads on Stop option is used to remove the
dead threads, which were debugged at some point during the debugging
session, but later, were terminated or killed. This option might cause a
decrease in speed because a big amount of memory must be read at every
stop.
• Do not select the Enable Delayed Software Breakpoint Support checkbox
(see the figure below).
Figure 7-40. Boot Parameters, Debug, and Modules tab
c. Configure other options in the Debugger options group according to your
specific requirements
You have successfully created the Attach Launch configuration. Click Debug and attach
the configuration to the running Linux kernel.
7.9.5.3 Creating a Download Launch Configuration to Debug a Linux
Partition from an Entry Point or a User-Defined Function
1. Import the vmlinux.elf file from the BSP-Directory/linux directory by using the PA ELF
Import feature in CodeWarrior IDE.
2. Create a new CodeWarrior download launch configuration. The steps that follow
describe how to configure the required settings.
3. Select the Main page.
CodeWarrior Development Studio for Power Architecture Processors Targeting Manual, Rev. 10.5.0,
06/2015
Freescale Semiconductor, Inc.
353
Debugging Hypervisor Guest Applications
4. Click New in the Remote system group to create a new remote system.
The New Connection wizard appears.
a. In the Select Remote System Type window, select CodeWarrior Bareboard
Debugging, and then TRK Connection.
b. Click Next.
c. In the TRK Connection, click Edit next to the Target drop-down list.
The Properties for <target> window appears.
d. Click Edit next to the Target type drop-down list.
The Target Types dialog box appears.
e. Click Import and import the used hypervisor .dtb file.
f. Click OK to close the Target Types dialog box.
g. Configure the following settings in the Properties for <target> window.
• In the Initialization tab, select the Execute system reset checkbox.
• Ensure that no init files exist for the debugged Linux partition cores.
• In the Memory tab, do not add any memory configuration files for the
debugged Linux partition cores.
h. Click OK.
The TRK Connection page reappears.
i. Select Trk Muxer in the Connection type drop-down list.
• Select Use existing host muxer process, and type the IP address of the
Linux host on which the mux_server is running.
• Alternatively, for Linux host only, you can select Launch host muxer
process for automatically launching the muxer process. If you follow this
step, you need to select the mux_server executable, and a TCP/IP target muxer
with an IP address and a starting port on which you want to launch the
mux_server.
• For TRK muxer ports, click Sequence and type the first port on which the
mux_server started.
The channels and ports on which the debugger accesses the cores appear.
• The channels must correspond to the trk-stub's mux channels added in the
hypervisor .dts file.
j. Click Finish.
The New Connection wizard disappears and the new remote system that you
just created appears in Connection drop-down list in the Remote system group.
5. Select all the cores that you want to debug from the Linux partition.
CodeWarrior Development Studio for Power Architecture Processors Targeting Manual, Rev. 10.5.0,
06/2015
354
Freescale Semiconductor, Inc.
Chapter 7 Debugging Embedded Linux Software
NOTE
You can use the new remote system, which you just
created, in other launch configurations also by selecting
different cores and making other necessary adjustments.
6. Select the Debugger page to configure the debugger specific settings.
a. In the Debugger options group, select the OS Awareness tab.
b. Select Linux in the Target OS drop-down list. Note that it is mandatory to
select Linux for the specific scenario described in this section.
The Boot Parameters, Debug, and Modules tabs appear.
In the Boot Parameters tab:
• Ensure that you disable all the options available on this tab.
In the Debug tab:
• Select the Enable Memory Translation checkbox, and configure it
according to the Linux MMU settings. For example:
Physical Base Address
Virtual Base Address
Memory Size
0x0
0xc0000000
0x20000000
• Select the Enable Threaded Debugging Support checkbox.
• The Update Background Threads on Stop option is used to remove the
dead threads, which were debugged at some point during the debugging
session, but later, were terminated or killed. This option might cause a
decrease in speed because a big amount of memory must be read at every
stop.
• Do not select the Enable Delayed Software Breakpoint Support
checkbox.
c. In the Debugger options group, select the Debug tab.
d. Select the Stop on startup at checkbox in the Program execution options
group.
• Select the Program entry point option, if you want the debugging session
to start from 0x0.
• Specify the function name in the User specified field, if you want the
debugging session to start from a specific kernel function.
e. In the Debugger options group, select the Download tab.
NOTE
Ensure that the Perform standard download
checkbox is not selected. Hypervisor transfers the
required kernel images for partition boot to memory.
CodeWarrior Development Studio for Power Architecture Processors Targeting Manual, Rev. 10.5.0,
06/2015
Freescale Semiconductor, Inc.
355
Debugging the P4080 Embedded Hypervisor
f. Configure other option in the Debugger options group according to your
specific requirements.
You have successfully created the Download Launch configuration. Click Debug and
observe the Linux partition restarting, hypervisor loading the kernel images, and the
debug session stopping at the Stop on startup at point/function, if specified.
7.10 Debugging the P4080 Embedded Hypervisor
You can debug the P4080 embedded hypervisor during the boot and initialization process
by using a JTAG probe and by creating an attach launch configuration.
To debug the hypervisor, perform the following steps:
1. Download the appropriate P4080 SW Bundle image (the BSP in .iso format) to a
Linux computer.
2. Mount the .iso image file using this command:
mount -o loop BSP-Image-Name.iso /mnt/iso
3. Install the BSP image file according to the instructions given in the BSP
documentation, P4080_BSP_User_Manual.
NOTE
Ensure that you are able to boot the hypervisor on the
P4080 board.
4. Import the hv.elf file and create an Attach launch configuration.
a. Start the CodeWarrior IDE.
b. From the CodeWarrior menu bar, select File > Import.
c. The Import wizard appears.
d. Expand the CodeWarrior group.
e. Select CodeWarrior Executable Importer to debug a .elf file.
f. Click Next.
The Import a CodeWarrior Executable page appears.
g. In the Project name text box specify a name for the imported project.
h. Click Next.
The Import C/C++/Assembler Executable Files page appears.
i. Click Browse next to the Executable option.
The Select file page appears.
CodeWarrior Development Studio for Power Architecture Processors Targeting Manual, Rev. 10.5.0,
06/2015
356
Freescale Semiconductor, Inc.
Chapter 7 Debugging Embedded Linux Software
j. Select the hv.elf file obtained from the output folder of the package.
k. Click Open.
l. The Select file dialog box closes. The path to the executable file appears in the
Executable text box.
m. Click Next.
The Processors page appears.
n. Select the processor family, toolchain, and target operating system for the
executable file.
o. Click Next.
The Debug Target Settings page appears.
p. Specify the debugger connection type, board, launch configuration, and
connection options for the executable file.
q. Click Next.
The Configurations page appears.
r. Select the core index for the executable file.
s. Click Finish.
The Import a CodeWarrior Executable window closes. The project for the
imported elf file appears in the CodeWarrior Projects view. You can now open
the Debug Configurations dialog box by selecting Run > Debug
Configurations. The Debug Configurations dialog box shows the current
settings for the launch configuration that you just created. The Debug
Configurations dialog box appears.
t. Expand the CodeWarrior group and select the launch configuration.
u. In the Connection panel, click Edit next to the Connection drop-down list.
The Properties for <connection launch configuration> window appears.
v. Select the appropriate <Connection type> from the drop-down list.
The Connection tab page appears.
w. Ensure that CCS executable is selected in the CCS server panel.
x. Specify the path of the executable file of the CCS server.
y. Enter the IP address in the Hostname/IP address text box.
NOTE
Use the default port, 41475 and JTAG clock speed,
16000 kHz.
z. In the Advanced tab, none of the checkbox should be selected.
CodeWarrior Development Studio for Power Architecture Processors Targeting Manual, Rev. 10.5.0,
06/2015
Freescale Semiconductor, Inc.
357
Debugging the P4080 Embedded Hypervisor
aa. Click Edit next to the Target drop-down list.
The Properties for <system launch configuration> window appears.
ab. In the Initialization tab, clear any reset options if checked.
ac. Clear the Initialize target options for any of the cores so that no initialization file
is selected.
ad. In the Memory tab, nothing should be selected because we currently do not have
a memory configuration file. The file will be created later with hypervisor MMU
entries.
The Properties window appears for the Attach launch configuration
ae. Click OK. The Properties window closes.
af. On the Main tab, in the Connection panel, check all the core checkboxes.
ag. Click Debug.
The Debug view appears with the debugger attached to each core of the selected
processor.
5. Create the required memory configuration file based on the hypervisor MMU entries.
a. In the Debug view, select the first core and click Suspend.
b. In the Registers view, expand the regPPCTLB1 group.
c. Find the MMU entries corresponding to the 0x00100000 address.
NOTE
The MMU entry for this translation uses the physical
address 0x7f900000 and the translation size is 1 MB.
d. Add the following code to the memory configuration file:
AutoEnableTranslations
true
translate v:0x00100000 p:0x7f900000 0x00100000
e. Add specific translations to access memory areas for which the translation is not
1-1.
NOTE
The memory mapped registers are accessed directly on
physical memory space, no translation is required in
such cases.
f. Save the memory configuration file and add it to the attach launch configuration.
g. Select Run > Debug Configurations.
The Debug Configurations dialog box appears.
h. Expand the CodeWarrior group and select the launch configuration you
created.
CodeWarrior Development Studio for Power Architecture Processors Targeting Manual, Rev. 10.5.0,
06/2015
358
Freescale Semiconductor, Inc.
Chapter 7 Debugging Embedded Linux Software
i. In the Connection panel, click Edit next to the Connection drop-down list box.
The Properties for <connection> window appears.
j. In the Memory tab, select the created memory configuration file at the processor
level.
NOTE
By default, the memory configuration files,
P4080_HV_EntryPoint.mem and P4080_HV.mem needed for
debugging the hypervisor, included in P4080 2.1
software bundle, are provided with the CodeWarrior
layout in the PA\PA_Support\Initialization_Files\Memory
folder. If you use a different hypervisor or use a
hypervisor with different MMU entries, you need to
follow the steps above.
You are now ready to debug the hypervisor at different stages.
7.10.1 Debugging Hypervisor During the Boot and Initialization
Process
This section discusses the various debug scenarios while debugging hypervisor from the
boot.
This section explains:
•
•
•
•
•
•
•
Debugging Hypervisor from the Entry Point
Debugging Hypervisor from Relocation Till Release of Secondary Cores
Debugging Hypervisor after Release of Secondary Cores
Debugging the Hypervisor Partitions Initialization Process
Debugging the Hypervisor Partitions Image Loading Process
Debugging All Cores when Starting the Guest Applications
Debugging the Hypervisor Partition Manager
7.10.1.1 Debugging Hypervisor from the Entry Point
CodeWarrior Development Studio for Power Architecture Processors Targeting Manual, Rev. 10.5.0,
06/2015
Freescale Semiconductor, Inc.
359
Debugging the P4080 Embedded Hypervisor
In this section, you will see how the hypervisor code is debugged from the _start function
in the libos/lib/head.S file until the tlbwe from branch_to_reloc from the scr/misc.S file when
the new text mapping is created and the initial one is removed. To debug hypervisor from
the entry point until the hypervisor relocation:
1. Download the appropriate P4080 SW Bundle image (the BSP in .iso format) to a
Linux computer.
2. Mount the .iso image file using this command: mount -o loop BSP-ImageName.iso /mnt/iso
3. Install the BSP image file according to the instructions given in the BSP
documentation, help/documents/pdf/BSP_User_Manual.
4. Configure <build tool> to have U-Boot boot the hypervisor as per instructions given
in the BSP documentation, help/documents/pdf/BSP_User_Manual.
5. Import the U-Boot file and create an Attach launch configuration.
a. Launch the CodeWarrior IDE.
b. From the main menu bar, select File > Import.
The Import wizard appears.
c. Expand the CodeWarrior group.
d. Select CodeWarrior Executable Importer to debug a .elf file.
e. Click Next.
The Import a CodeWarrior Executable file page appears.
f. Specify the project name for the imported project.
g. Click Next.
The Import C/C++/Assembler Executable Files page appears.
h. Click Browse next to the Executable option.
i. Select the hv.elf file.
j. Click Next.
The Processor page appears.
k. Select the processor family and toolchain for the executable file.
l. Click Next.
The Debug Target Settings page appears.
m. Specify the debugger connection type, board, launch connection, and connection
type for the executable file.
n. Click Next.
The Configurations page appears.
o. Select a core index.
CodeWarrior Development Studio for Power Architecture Processors Targeting Manual, Rev. 10.5.0,
06/2015
360
Freescale Semiconductor, Inc.
Chapter 7 Debugging Embedded Linux Software
p. Click Finish.
The Import a CodeWarrior Executable window closes.
q. Select Run > Debug Configurations.
The Debug Configurations dialog box appears with the specified launch
configuration settings.
r. Click Edit near the Connection list box to check or edit the settings you made
during the creation of the launch configuration.
The Properties window appears for the selected launch configuration.
s. Select the type of connection using the Connection type drop-down list.
The Connection tab page appears.
t. Ensure that CCS executable is selected in the CCS server panel.
u. Specify the path of the executable file of the CCS server.
v. Enter the IP address in the Hostname/IP Address text box.
NOTE
Use the default port, 41475 and JTAG clock speed,
16000 kHz.
w. Click Edit next to the System drop-down list.
The System tab page appears.
x. Select P4080_HV_EntryPoint.mem from \CWInstall_dir\PA\PA_Support
\Initialization_Files\Memory in the Initialize target script column.
y. Click OK.
The Properties window closes.
z. On the Main tab, in the System panel list, ensure that e500mc-0 is selected. Run
the launch configuration.
aa. Click Finish.
NOTE
You can attach to all 8 cores, but for this example you will
just select the first core. In the beginning the hypervisor
runs from address 0x0 and uses this translation v:0x00100000
p:0x00000000 0x00100000 in its TLB1 MMU.
6. Open the Debugger Shell and set a hardware breakpoint at the entry point (_start
function from libos/lib/head.S) by issuing this command:
bp -hw 0x0 or bp -hw libos_client_entry
CodeWarrior Development Studio for Power Architecture Processors Targeting Manual, Rev. 10.5.0,
06/2015
Freescale Semiconductor, Inc.
361
Debugging the P4080 Embedded Hypervisor
7. Find the address of this entry point by using the elf dump file:
powerpc-linux-gnu-objdump -D hv > hv.objdump;
8. Open the generated dump and search for _start
address
(for example, 0x100000)
NOTE
You use the objdump utility here because head.S is not present
in the hv.elf file. To set a hardware breakpoint, you can
also expand the hv.elf file, open the required file (if
present) and set a hardware breakpoint directly at the
desired function, for example, the libos_client_entry or any
other function.
9. Boot the hypervisor at the U-Boot prompt.
The debugger stops at the specified hardware breakpoint (see the figure below). You
can now debug from this location until hypervisor relocation.
Figure 7-41. Hypervisor Debug - Entry Point
7.10.1.2 Debugging Hypervisor from Relocation Till Release of
Secondary Cores
CodeWarrior Development Studio for Power Architecture Processors Targeting Manual, Rev. 10.5.0,
06/2015
362
Freescale Semiconductor, Inc.
Chapter 7 Debugging Embedded Linux Software
After the hypervisor relocation the MMU entry from TLB1 is changed. Therefore, to
continue debugging of the hypervisor, the used memory configuration file should use the
new translation.
NOTE
For debugging hypervisor from relocation, use the P4080_HV.mem
file from \CWPAv10.0\PA\PA_Support\Initialization_Files\Memory.
1. Select Run > Debug Configurations.
The Debug Configurations dialog box appears.
2. On the left panel, from the CodeWarrior Attach group, select the attach launch
configuration you had imported using the hv.elf file.
3. On the Main tab, in the System panel, select all the cores and click Debug.
The Debug perspective appears.
4. In the Editor view, open the init.c file and set a hardware breakpoint at the
branch_to_reloc function call from the init_hv_mem function.
Figure 7-42. Hypervisor Debug - Setting Breakpoint
5. Debug until the secondary cores are being released from the spin table in the
release_secondary function from init.c at start_secondary_spin_table call.
CodeWarrior Development Studio for Power Architecture Processors Targeting Manual, Rev. 10.5.0,
06/2015
Freescale Semiconductor, Inc.
363
Debugging the P4080 Embedded Hypervisor
Figure 7-43. Hypervisor Debug - Release of Secondary Cores
7.10.1.3 Debugging Hypervisor after Release of Secondary Cores
To debug Hypervisor after the release of secondary cores, perform the following:
1. Select Run > Debug Configurations.
The Debug Configurations dialog box appears.
2. On the left panel, from the CodeWarrior Attach group, select the attach launch
configuration you had imported using the hv.elf file.
3. On the Main tab, in the System panel, select all the cores and click Debug.
The Debug perspective appears.
4. When the secondary cores are released, set a hardware breakpoint at the
start_secondary_spin_table function in the mp.c file.
5. Boot the hypervisor.
The first core will stop at the start_secondary_spin_table function.
NOTE
For debugging the secondary cores, set a breakpoint either
at the secondary_start entry point for secondary cores from
libos/lib/head.S or at a function called by secondary cores
CodeWarrior Development Studio for Power Architecture Processors Targeting Manual, Rev. 10.5.0,
06/2015
364
Freescale Semiconductor, Inc.
Chapter 7 Debugging Embedded Linux Software
(for example, set a breakpoint at the secondary_init
in the init.c file).
function
6. Find out the address of the secondary_start entry point by using the elf dump file:
powerpc-linux-gnu-objdump -D hv > hv.objdump;
7. Open the generated dump and search for secondary_start address (for example,
0x10006c).
8. After having the translation from 0x00100000 to 0x7f900000, add a breakpoint at
0x7f90006c.
9. Resume the first core which was stopped at the start_secondary_spin_table function.
Each secondary core will stop at the specified breakpoint either at the entry point or
the secondary_init function.
10. Debug all the cores until the init_guest function call from the partition_init function.
7.10.1.4 Debugging the Hypervisor Partitions Initialization Process
To debug Hypervisor partition initialization process, perform the following:
1. Select Run > Debug Configurations.
The Debug Configurations dialog box appears.
2. On the left panel, from the CodeWarrior Attach group, select the attach launch
configuration you had imported using the hv.elf file.
3. On the Main tab, in the System panel, select all the cores and click Debug.
The Debug perspective appears.
4. In the Editor view, open the init.c file and set a hardware breakpoint at the
partition_init function.
5. Debug the init_guest function on each core.
6. Set a breakpoint in the init_guest_primary function for debugging each primary core of
a partition.
7. Set a breakpoint in the register_cpu_with_guest function for the other cores of a
partition.
NOTE
The secondary cores wait on a barrier in the
register_cpu_with_guest function until the primary core of
that partition allocates the guest->gcpus member; after this
they will enter idle_loop from src/misc.S. The primary core
CodeWarrior Development Studio for Power Architecture Processors Targeting Manual, Rev. 10.5.0,
06/2015
Freescale Semiconductor, Inc.
365
Debugging the P4080 Embedded Hypervisor
of each partition will continue in the init_guest_primary
function with different device-tree operations.
7.10.1.5 Debugging the Hypervisor Partitions Image Loading Process
After debugging the hypervisor partitions initialization process, the image loading
process begins at the start_load_guest or load_guest functions from the guest.c file. Each
primary boot core will set a event of this type in the init_guest function causing one of
this functions to be called.
1. From the start_load_guest function, the primary core of each partition begins the
process of image loading for each partition.
2. In the start_guest_primary function, the load_images function call will load the specific
files for each partition.
3. Set different breakpoints in these functions for debugging the image loading process.
7.10.1.6 Debugging All Cores when Starting the Guest Applications
Once the images for each partition are loaded, the primary core of each partition should
take the secondary partition cores from the idle loop and start the partition. The steps to
do this:
1. In the start_guest_primary_noload function, each partition primary core sets a gev_start
event and will wait on a barrier until all the cores from the partition become active.
2. The secondary partition cores will continue in the start_guest_secondary function and
will wait in the while loop for different events.
3. After all the partition cores become active and they are waiting for events in the
while loop, the primary core moves over the barrier, sets the partition state to
running, sets the srr1 variable to guest state and at the return from exception will start
executing the guest application.
4. The other secondary cores from the partition set srr1 to guest state and at the return
from exception will start executing the guest application.
5. Set different breakpoints in these start_guest_primary_noload and start_guest_secondary
functions for debugging.
CodeWarrior Development Studio for Power Architecture Processors Targeting Manual, Rev. 10.5.0,
06/2015
366
Freescale Semiconductor, Inc.
Chapter 7 Debugging Embedded Linux Software
7.10.1.7 Debugging the Hypervisor Partition Manager
If you want to verify the behavior of different commands on a user space, you can use
partman, which is a Linux user space application. For debugging the associated
hypercalls routines, you will need to attach to the hypervisor with all the eight cores and
set breakpoints at the required function calls.
In this section, we will take an example of issuing the partition restart command from
partman.
1. Select Run > Debug Configurations.
The Debug Configurations dialog box appears.
2. On the left panel, from the CodeWarrior Attach group, select the attach launch
configuration you had imported using the hv.elf file.
3. On the Main tab, in the System panel, select all the cores and click Debug.
The Debug perspective appears.
4. In the Editor view, in the hcalls.c file set a breakpoint at the hcall_partition_restart
function.
The debugger stops at this breakpoint and you can debug this hypercall handle.
7.11 User Space Debugging with On-Chip Debug
The user space on-chip debug (OCD) feature introduces the capability of debugging only
one user space application per debug session, using the Linux kernel awareness debug
feature.
The advantage of this feature is that the debugger functionality is not conditioned by any
target services and the target serial/ethernet capabilities do not consume target resources.
It works regardless of the target's processes state. The solution does not require any
debugger add-on for the target board.
The Linux kernel awareness debug feature has been enhanced to accept the on-source
debugging for one user space application per debug session. The limitation is multiple
applications are linked and run on different virtual addresses. In real time, user space
applications are linked to the same virtual address, so that only one can be debugged on
the source.
CodeWarrior Development Studio for Power Architecture Processors Targeting Manual, Rev. 10.5.0,
06/2015
Freescale Semiconductor, Inc.
367
User Space Debugging with On-Chip Debug
A typical Linux kernel debug session (attach or download) adds the symbolics
information for the user space application. The symbolic information must be added
before starting the debug session. Follow these steps to add the information:
1. Select Run > Debug Configurations.
The Debug Configurations dialog box appears.
2. Click the Debugger tab.
The Debugger options group appears.
3. Select the Other Executables tab.
4. Click Add to add the application elf file.
The Debug Other Executable dialog box appears.
5. Select the Load Symbols checkbox and clear the Download to Device checkbox.
6. To download and start the application on the target board, the application should be
included in the target file system (using RAM disk or rootfs). You can either include
the application manually or using SDK.
• From the SDK: The application is included in the rootfs file from the SDK. The
application will be downloaded on the target board with the rest of the file
system using the RAM disk download feature. Follow all the steps from the BSP
user manual (iso/help/documents/pdf on the BSP image) to include the application
in the target file system.
• Place the application manually: You can place the application manually in the
target file system by copying the application to the target, after the linux
application is running on the target board using the file transfer protocol like,
FTP, TFTP, or SCP. If you use NFS, copy the application on the NFS server
location of the RAM disk.
7. Click Debug.
The debugged application processes will be presented as kernel tasks with the
respective PID. If a core is terminated while running inside the application, the
corresponding thread will appear in the System Browser view.
8. Select Window > Show View > Other.
The Show View dialog box appears.
9. From the Debug group, select System Browser.
10. Click OK.
The System Browser window appears with the process and thread information.
11. Locate the particular thread among the other threads and double click on it to debug
the selected thread. You can also right-click the thread and select the Debug option.
CodeWarrior Development Studio for Power Architecture Processors Targeting Manual, Rev. 10.5.0,
06/2015
368
Freescale Semiconductor, Inc.
Chapter 7 Debugging Embedded Linux Software
The selected thread appears in the Debug perspective for the current core.
NOTE
On multi-core systems the application can be found on any
core and, if it creates multiple threads/processes, each has a
separate entry in System Browser view.
12. Click on the thread in the Debug view, the program counter icon
points to the next statement to be executed.
13. In the Debug view, click Step Into .
on the marker bar
The debugger executes the current statement and halts at the next statement.
14. Set the breakpoint on the appropriate function.
15. You can inspect the variables, view the Disassembly or perform any other debug
capability as required.
NOTE
The Linux kernel and user space stack frames are not
simultaneously supported for a thread. In a system call, the
kernel stack is displayed corresponding to the kernel
function (system call) called from the application.
7.11.1 Attaching Core to the Debug Application
In this section, we will take an example to attach the target to an already executed
debugging application.
1. Click Suspend from the debug view to suspend the debug session or Multicore
Suspend if a multicore target is used.
2. Select Window > Show View > Other.
The Show View dialog box appears.
3. From the Debug group, select System Browser.
4. Click OK.
The System Browser window appears.
5. Select and double-click on the particular thread to attach it to the target.
CodeWarrior Development Studio for Power Architecture Processors Targeting Manual, Rev. 10.5.0,
06/2015
Freescale Semiconductor, Inc.
369
User Space Debugging with On-Chip Debug
NOTE
If the application stack does not appear in the Debug view,
go to System Browser view and attach the application.
7.11.2 Debugging the Application from the main() Function
In this section, we will describe the steps to debug the application from the beginning of
the program, that is, from the main() function. Before executing the main() function, the
application load process must be interrupted by setting a breakpoint after the MMU setup
and before the main execution. It can be performed in two steps:
1. Attach to a running instance of the application (as described above) and set the
breakpoint.
a. Right-click the selected thread in the application stack.
The context menu appears.
b. Select the Debug option to debug the application after the application stack is
displayed in the Disassembly view.
c. Click the thread in the Debug view.
The program counter icon
executed.
on the marker bar points to the next statement to be
d. Set breakpoint at the stack frame under main().
2. Click Resume and restart the application from the console.
3. When the breakpoint is hit, set a new breakpoint on source, and repeat the above
steps.
CodeWarrior Development Studio for Power Architecture Processors Targeting Manual, Rev. 10.5.0,
06/2015
370
Freescale Semiconductor, Inc.
Chapter 8
JTAG Configuration Files
This chapter explains about JTAG configuration files that pass specific configuration
settings to the debugger and support chaining of multiple devices. A JTAG configuration
file is a text file, specific to the CodeWarrior debugger, which describes a custom JTAG
scan chain. You can specify the file in the remote system settings.
This chapter explains:
•
•
•
•
JTAG configuration file syntax
Using a JTAG configuration file to override RCW
Using a JTAG configuration file to specify multiple linked devices on a JTAG chain
Setting up a remote system to use a JTAG configuration file
8.1 JTAG configuration file syntax
This section describes the syntax of a JTAG configuration file.
You can create a JTAG configuration file that specifies the type, chain order, and various
settings for the devices you want to debug. To create the JTAG configuration file, list
each device on a separate line, starting with the device that is directly connected to the
transmit data out (TDO) signal (Pin 1) of the 16-pin COP/JTAG debug connector on the
hardware target, and conclude with a blank line.
The listing below shows the complete syntax for a JTAG configuration file.
cfgfile:
'\n'
Listing 8-1. JTAG Configuration File Syntax
'#' 'any other characters until end of line'
line
cfgfile line
CodeWarrior Development Studio for Power Architecture Processors Targeting Manual, Rev. 10.5.0,
06/2015
Freescale Semiconductor, Inc.
371
Using a JTAG configuration file to override RCW
line:
target
target filter_list_or_params
target:
target_name
target_name = target_id
'Generic' number number number
filter_list_or_params:
filter_list_entity
filter_list_or_params filter_list_entity
filter_list_entity:
'(' number number ')'
filter_name
%
In the listing above, target_name represents a processor name, such as P1010, P2020,
P4080, and so on.
NOTE
If a JTAG scan chain contains a processor, such as P1011,
P1012, P1013, P1015, P1016, P1017, and P2010, then an
additional parameter, (0x80000000 1), needs to be specified in
the JTAG configuration file. An example of this parameter is
given in Using a JTAG configuration file to specify multiple
linked devices on a JTAG chain.
8.2 Using a JTAG configuration file to override RCW
You can use a JTAG configuration file to override Reset Configuration Word (RCW) for
a processor, such as P4080.
The JTAG configuration files are used in the following situations for:
• Target boards that do not have RCW already programmed
• New board bring-up
• Recovering boards with blank or damaged flash
CodeWarrior Development Studio for Power Architecture Processors Targeting Manual, Rev. 10.5.0,
06/2015
372
Freescale Semiconductor, Inc.
Chapter 8 JTAG Configuration Files
NOTE
For more information on RCW, see the Reference Manual
for your processor.
The CodeWarrior IDE includes examples of JTAG configuration files that can be used
for overriding the RCW (see the listing below). The JTAG Configuration files are
available at the following location:
<CWInstallDir>\PA\PA_Support\Initialization_Files\jtag_chains
Listing 8-2. Sample JTAG Configuration File for Overriding RCW
# Example file to allow overriding the whole RCW or only parts of it
#
# Syntax:
# P4080 (2 RCW_option) (RCWn value) ...
#
# where:
#
RCW_option = 0 [RCW Override disabled]
#
1 [RCW Override enabled]
#
2 [Reset previous RCW Override parts]
#
#
RCWn = 21000+n (n = 1 .. 16; index of RCW value)
#
#
value = 32bit value
The JTAG configuration files, as specified in the listing above, can be used to override a
portion or the complete RCW for P4080, by specifying (index, value) pairs, for some (or
all) of the 16 x (32bit words) of the RCW.
NOTE
You can use the Pre-Boot Loader (PBL) tool to configure the
various settings that make up the RCW and output the RCW in
multiple formats, including CodeWarrior JTAG configuration
files. For more information on the PBL tool, see PBL
Configuration Tool User Guide.
8.3 Using a JTAG configuration file to specify multiple linked
devices on a JTAG chain
This section explains how to connect multiple processors through a single JTAG chain
and how to describe such a JTAG chain in a JTAG configuration file.
The listing and figure below show a sample JTAG initialization file with a single core.
Listing 8-3. Sample JTAG Initialization File for P1010 Processor
# A single device in the chain
P1010
CodeWarrior Development Studio for Power Architecture Processors Targeting Manual, Rev. 10.5.0,
06/2015
Freescale Semiconductor, Inc.
373
Using a JTAG configuration file to specify multiple linked devices on a JTAG chain
Figure 8-1. A Single Device in a JTAG Chain
The listing and figure below show a sample JTAG initialization file with two devices in a
JTAG chain.
Listing 8-4. Sample JTAG Initialization File for P1014 and P2020 Processors
# Two devices in a JTAG chain
P1014
P2020
Figure 8-2. Two Devices in a JTAG Chain
NOTE
The devices are enumerated in the direction starting from TDO
output to TDI input.
The listing and figure below show two devices connected in a JTAG chain.
Listing 8-5. Sample JTAG Initialization File for P2010 and P4080 Processors
# Two devices in a JTAG chain
P2010 (0x80000000 1)
P4080 (2 1) (210005 0x90404000)
CodeWarrior Development Studio for Power Architecture Processors Targeting Manual, Rev. 10.5.0,
06/2015
374
Freescale Semiconductor, Inc.
Chapter 8 JTAG Configuration Files
Figure 8-3. Two Devices in a JTAG Chain
The listing and figure below show two devices connected in a JTAG chain with a filter
applied for the second device.
Listing 8-6. Sample JTAG Initialization File for Two Devices with Filter for Second
Device
# Two devices in a JTAG chain
8306 (1 1) (2 0x44050006) (3 0x00600000)
8309 log
Figure 8-4. Two Devices in a JTAG Chain with Filter Applied to Second Device
In the above example, the entry for the 8306 also includes the Hard Reset Control Word
(HRCW) data that will overwrite the HRCW fetched by the 8306 upon power up or Hard
Reset. The Hard Reset Control Word parameters are optional.
The CodeWarrior debugger not only supports Freescale devices but also supports nonFreescale devices in a JTAG scan chain. Each non-Freescale device used in a scan chain
is declared as "Generic" and it takes the following three parameters:
• JTAG Instruction Length
CodeWarrior Development Studio for Power Architecture Processors Targeting Manual, Rev. 10.5.0,
06/2015
Freescale Semiconductor, Inc.
375
Setting up a remote system to use a JTAG configuration file
• Bypass Command
• Bypass Length
The values for these three parameters are available in the device's data sheet or can be
obtained from the manufacturer of the device.
The listing and figure below show a Freescale device, 8560, connected with a nonFreescale device, PLA, in a JTAG scan chain. From the PLA's data sheet, the JTAG
Instruction Length = 5, the Bypass Command = 1, and the Bypass Length = 0x1F.
Listing 8-7. Sample JTAG Initialization File including Non-Freescale Devices
8560
Generic 5 1 0x1F
Figure 8-5. A Freescale Device and a Non-Freescale Device in a JTAG Chain
8.4 Setting up a remote system to use a JTAG configuration
file
This section explains how to configure a remote system to use a JTAG configuration file.
To connect to a JTAG chain, specify these settings in the launch configurations:
1. Create a JTAG initialization file that describes the items on the JTAG chain. For
more information on how to create a JTAG initialization file, see JTAG
configuration file syntax and Using a JTAG configuration file to specify multiple
linked devices on a JTAG chain.
2. Open the CodeWarrior project you want to debug.
3. Select Run > Debug Configurations.
The Debug Configurations dialog box appears with a list of debug configurations
that apply to the current application.
4. Expand the CodeWarrior tree control.
CodeWarrior Development Studio for Power Architecture Processors Targeting Manual, Rev. 10.5.0,
06/2015
376
Freescale Semiconductor, Inc.
Chapter 8 JTAG Configuration Files
5. From the expanded list, select the debug configuration for which you want to modify
the debugger settings.
The Debug view shows the settings for the selected configuration.
6. Select a remote system from the Connection drop-down list.
7. Select a core from the Target list.
8. In the Connection group, click Edit.
The Properties for <project>window appears.
9. Click Edit next to the Target list.
The Properties for <remote system> window appears.
10. Click Edit next to the Target type drop-down list.
The Target Types dialog box appears.
11. Click Import.
12. The Import Target Type dialog box appears.
13. Select the JTAG initialization file that describes the items on the JTAG chain from
this location:
<CWInstallDir>\PA\PA_Support\Initialization_Files\jtag_chains
14. Click OK.
The items on the JTAG chain described in the file appear in the Target Types dialog
box.
15. Click OK.
The selected JTAG configuration file appears on the Advanced tab (shown in the
figure below).
CodeWarrior Development Studio for Power Architecture Processors Targeting Manual, Rev. 10.5.0,
06/2015
Freescale Semiconductor, Inc.
377
Setting up a remote system to use a JTAG configuration file
Figure 8-6. Advanced Tab Showing the JTAG Configuration File
16. Click OK.
17. Click the Debugger tab.
The Debugger page appears.
18. Ensure that the Stop on startup at checkbox is selected and main is specified in the
User specified text box.
19. Click Apply to save the changes.
You have successfully configured a debug configuration.
CodeWarrior Development Studio for Power Architecture Processors Targeting Manual, Rev. 10.5.0,
06/2015
378
Freescale Semiconductor, Inc.
Chapter 9
Target Initialization Files
A target initialization file is a file that contains commands that initialize registers,
memory locations, and other components on a target board.
The most common use case is to have the CodeWarrior debugger execute a target
initialization file immediately before the debugger downloads a bareboard binary to a
target board. The commands in a target initialization file put a board in the state required
to debug a bareboard program.
NOTE
The target board can be initialized either by the debugger (by
using an initialization file), or by an external bootloader or OS
(U-Boot, Linux). In both cases, the extra use of an initialization
file is necessary for debugger-specific settings (for example,
silicon workarounds needed for the debug features).
This chapter explains:
• Using target initialization files
• Target initialization commands
9.1 Using target initialization files
This section describes how to configure the CodeWarrior debugger to use a specific
target initialization file.
A target initialization file contains commands that the CodeWarrior debugger executes
each time the launch configuration, the initialization file is assigned to, is debugged. You
can use the target initialization file for all launch configuration types (Attach, Connect
and Download). The target initialization file is executed after the connection to the target
is established, but before the download operation takes place.
CodeWarrior Development Studio for Power Architecture Processors Targeting Manual, Rev. 10.5.0,
06/2015
Freescale Semiconductor, Inc.
379
Using target initialization files
The debugger executes the commands in the target initialization file using the target
connection protocol, such as a JTAG run-control device.
NOTE
You do not need to use an initialization file if you debug using
the CodeWarrior TRK debug protocol.
To instruct the CodeWarrior debugger to use a target initialization file:
1.
2.
3.
4.
Start the CodeWarrior IDE.
Open a bareboard project.
Select one of this project's build targets.
Select Run > Debug Configurations.
The Debug Configurations dialog box appears.
5. Select the appropriate launch configuration from the left panel.
6. In the Main tab, from the Connection panel, click Edit next to the Connection
drop-down list.
The Properties for <Launch Configuration Name> window appears.
7. Click Edit next to the Target drop-down list.
The Properties for <remote system> window appears.
8. In the Initialization tab, select the appropriate cores checkboxes from the Initialize
target column, as shown in the figure below.
Figure 9-1. Initialization Tab
9. In the Initialize target script column, click the ellipsis button, as shown in the figure
above.
CodeWarrior Development Studio for Power Architecture Processors Targeting Manual, Rev. 10.5.0,
06/2015
380
Freescale Semiconductor, Inc.
Chapter 9 Target Initialization Files
Tip
Click in the specified cell of the Initialize target script
column for the ellipsis button to appear.
The Target Initialization File dialog box appears, as shown in the figure below.
Figure 9-2. Target Initialization File Dialog Box
10. Select the target initialization file by using the buttons provided in the dialog box and
click OK.
The target initialization files are available at the following path:
<CWInstallDir>\PA\PA_Support\Initialization_Files\
You can also write your own target initialization files. The next section documents the
commands that can appear in such files.
9.2 Target initialization commands
Target initialization commands are of two types, .cfg commands and .tcl commands.
The syntax of each target initialization command follows these rules:
• Spaces and tabs (white space) are ignored
• Character case is ignored
• Unless otherwise noted, values may be specified in hexadecimal, octal, or decimal:
• Hexadecimal values are preceded by 0x (for example, 0xDEADBEEF)
• Octal values are preceded by 0 (for example, 01234567)
• Decimal values start with a non-zero numeric character (for example, 1234)
• Comments start with a semicolon ( ;) or pound sign ( #), and continue to the end of
the line
CodeWarrior Development Studio for Power Architecture Processors Targeting Manual, Rev. 10.5.0,
06/2015
Freescale Semiconductor, Inc.
381
Target initialization commands
This section explains:
• .cfg target initialization commands
• .tcl target initialization commands
9.2.1 .cfg target initialization commands
This section describes for each .cfg target initialization command a brief statement of
what the command does, the command's syntax, a definition of each argument that can be
passed to the command, and examples showing how to use the command.
Some commands described in this section allow access to memory-mapped register by
name as well as address. Based on the processor selection in the debugger settings, these
commands will accept the register names shown in the debugger's Registers view. There
are also commands to access built-in registers of a processor core, for example, writereg.
The names of these registers follow the architectural description for the respective
processor core for general purpose and special purpose registers. Note that these names
(for example, GPR5) might be different from names used in assembly language (for
example, r5). You can identify the register names by looking at the debugger's Registers
view.
NOTE
The current release does not include .cfg initialization files but
provides backward compatibility to these files.
The table below lists each command that can appear in a .cfg target initialization file.
Table 9-1. .cfg target initialization commands
alternatePC
reset
stop
writemem.b
ANDmmr
resetCoreID
writemem.l
writemem.w
ANDmem.l
run
writemmr
writereg
IncorMMR
setCoreID
writereg64
writereg128
ORmem.l
sleep
writereg192
9.2.1.1 alternatePC
Sets the initial program counter (PC) register to the specified value, disregarding any
entry point value read from the ELF application being debugged.
CodeWarrior Development Studio for Power Architecture Processors Targeting Manual, Rev. 10.5.0,
06/2015
382
Freescale Semiconductor, Inc.
Chapter 9 Target Initialization Files
Syntax
alternatePC
address
Arguments
address
The 32-bit address to assign to the program counter register.
This address may be specified in hexadecimal (for example, 0xABCD0000), octal (for
example, 025363200000), or decimal (for example, 2882338816).
Example
This command assigns the address 0xc28737a4 to the program counter register:
alternatePC 0xc28737a4
9.2.1.2 ANDmem.l
Performs a bit AND using the 32-bit value at the specified memory address and the
supplied 32-bit mask and writes the result back to the specified address.
No read/write verify is performed.
Syntax
ANDmem.l
address
mask
Arguments
address
The address of the 32-bit value upon which to perform the bit AND operation.
This address may be specified in hexadecimal (for example, 0xABCD0000), octal (for
example, 025363200000), or decimal (for example, 2882338816).
mask
32-bit mask to use in the bit AND operation.
Example
CodeWarrior Development Studio for Power Architecture Processors Targeting Manual, Rev. 10.5.0,
06/2015
Freescale Semiconductor, Inc.
383
Target initialization commands
The command below performs a bit AND operation using the 32-bit value at memory
location 0xC30A0004 and the 32-bit mask 0xFFFFFFFF. The command then writes the result
back to memory location 0xC30A0004.
ANDmem.l 0xC30A0004 0xFFFFFEFF
9.2.1.3 ANDmmr
Performs a bit AND using the contents of the specified memory-mapped register (MMR)
and the supplied 32-bit mask and writes the result back to the specified register.
Syntax
ANDmmr
regName
mask
Arguments
regName
The name of the memory-mapped register upon which to perform a bit AND.
mask
32-bit mask to use in the bit AND operation.
Example
This command bit ANDs the contents of the ACFG register with the value 0x00002000:
ANDmmr ACFG 0x0000200
9.2.1.4 IncorMMR
Performs a bitwise OR using the contents of the specified memory-mapped register
(MMR) and the supplied 32-bit mask and writes the result back to the specified register.
Syntax
incorMMR
regName
mask
Arguments
regName
CodeWarrior Development Studio for Power Architecture Processors Targeting Manual, Rev. 10.5.0,
06/2015
384
Freescale Semiconductor, Inc.
Chapter 9 Target Initialization Files
The name of the MMR register upon which to perform a bit OR.
mask
32-bit mask to use in the bit inclusive OR operation.
Example
This command bit ORs the contents of the ACFG register with the value 0x00002000:
incorMMR ACFG 0x00002000
9.2.1.5 ORmem.l
Performs a bit OR using the 32-bit value at the specified memory address and the
supplied 32-bit mask and writes the result back to the specified address.
No read/write verify is performed.
Syntax
ORmem.l
address
mask
Arguments
address
The address of the 32-bit value upon which to perform the bit OR operation.
This address may be specified in hexadecimal (for example, 0xABCD0000), octal (for
example, 025363200000), or decimal (for example, 2882338816).
mask
32-bit mask to use in the bit OR operation.
Example
The command below performs a bit OR operation using the 32-bit value at memory
location 0xC30A0008 and the 32-bit mask 0x01000800. The command then writes the result
back to memory location 0xC30A0004.
ORmem.l 0xC30A0008 0x01000800
9.2.1.6 reset
CodeWarrior Development Studio for Power Architecture Processors Targeting Manual, Rev. 10.5.0,
06/2015
Freescale Semiconductor, Inc.
385
Target initialization commands
Resets the processor on the target board.
Syntax
reset
code
Arguments
code
Number that defines what the debugger does after it resets the processor on the target
board.
The table below describes the Post Reset Actions. Use any one of the values specified.
Table 9-2. Post Reset Actions
Value
Description
0
reset the target processor, then run
1
reset the target processor, then stop
9.2.1.7 run
Starts program execution at the current program counter (PC) address.
Syntax
run
9.2.1.8 setCoreID
Tells the debugger to issue all subsequent commands on the specified core index,
disregarding the actual core index on which the initialization is executed.
NOTE
Ensure to reset the core index after the sequence of commands
intended to execute on the other core is finished (see the
resetCoreID command).
CodeWarrior Development Studio for Power Architecture Processors Targeting Manual, Rev. 10.5.0,
06/2015
386
Freescale Semiconductor, Inc.
Chapter 9 Target Initialization Files
Tip
This command can be useful in cases where you need to
execute a command sequence on other cores than the current
one, for example in a SMP initialization scenario.
Syntax
setCoreID core
Arguments
core
The core index on which to execute.
Example
This command tells the debugger to issue all subsequent commands on the core index 1:
setCoreID 1
9.2.1.9 resetCoreID
Tells the debugger to revert to executing commands on the current core, thus cancelling
the effect of a previous setCoreID command.
Syntax
resetCoreID
9.2.1.10 sleep
Causes the debugger to pause the specified number of milliseconds before executing the
next instruction.
Syntax
sleep
milliseconds
Arguments
milliseconds
The number of milliseconds (in decimal) to pause the debugger.
Example
CodeWarrior Development Studio for Power Architecture Processors Targeting Manual, Rev. 10.5.0,
06/2015
Freescale Semiconductor, Inc.
387
Target initialization commands
This command pauses the debugger for 10 milliseconds:
sleep 10
9.2.1.11 stop
Stops program execution and halts the processor on the target board.
Syntax
stop
9.2.1.12 writemem.b
Writes a byte (8 bits) of data to the specified memory address.
Syntax
writemem.b
address
value
Arguments
address
The 32-bit memory address to which to assign the supplied 8-bit value.
This address may be specified in hexadecimal (for example, 0xABCD), octal ((for example,
0125715), or decimal ( 43981).
value
The 8-bit value to write to the specified memory address.
This value may be specified in hexadecimal (for example, 0xFF), octal (for example, 0377),
or decimal (for example, 255).
Example
This command writes the byte 0x1A to the memory location 0x0001FF00:
writemem.b 0x0001FF00 0x1A
CodeWarrior Development Studio for Power Architecture Processors Targeting Manual, Rev. 10.5.0,
06/2015
388
Freescale Semiconductor, Inc.
Chapter 9 Target Initialization Files
9.2.1.13 writemem.w
Writes a word (16 bits) of data to the specified memory address.
Syntax
writemem.w
address
value
Arguments
address
The 32-bit memory address to which to assign the supplied 16-bit value.
This address may be specified in hexadecimal (for example, 0xABCD0000), octal (for
example, 025363200000), or decimal (for example, 2882338816).
value
The 16-bit value to write to the specified memory address.
This value may be specified in hexadecimal (for example, 0xFFFF), octal (for example,
0177777), or decimal (for example, 65535).
Example
This command writes the word 0x1234 to memory location 0x0001FF00:
writemem.w 0x0001FF00 0x1234
9.2.1.14 writemem.l
Writes a long integer (32 bits) of data to the specified memory location.
Syntax
writemem.l
address
value
Arguments
address
The 32-bit memory address to which to assign the supplied 32-bit value.
This address may be specified in hexadecimal (for example, 0xABCD0000), octal (for
example, 025363200000), or decimal (for example, 2882338816).
CodeWarrior Development Studio for Power Architecture Processors Targeting Manual, Rev. 10.5.0,
06/2015
Freescale Semiconductor, Inc.
389
Target initialization commands
value
The 32-bit value to write to the specified memory address.
This value may be specified in hexadecimal (for example, 0xFFFFABCD), octal (for example,
037777725715), or decimal (for example, 4294945741).
Example
This command writes the long integer 0x12345678 to the memory location 0x0001FF00:
writemem.w 0x0001FF00 0x12345678
9.2.1.15 writemmr
Writes a value to the specified memory-mapped register (MMR).
Syntax
writemmr
regName
value
Arguments
regName
The name of the memory-mapped register, the supplied value is assigned to.
NOTE
This command accepts most Power Architecture processor
memory-mapped register names.
value
The value to write to the specified memory-mapped register.
This value may be specified in hexadecimal (for example, 0xFFFFABCD), octal (for example,
037777725715), or decimal (for example, 4294945741).
Example
This command writes the value 0xffffffc3 to the SYPCR register:
writemmr SYPCR 0xffffffc3
This command writes the value 0x0001 to the RMR register:
writemmr RMR 0x0001
This command writes the value 0x3200 to the MPTPR register:
CodeWarrior Development Studio for Power Architecture Processors Targeting Manual, Rev. 10.5.0,
06/2015
390
Freescale Semiconductor, Inc.
Chapter 9 Target Initialization Files
writemmr MPTPR 0x3200
9.2.1.16 writereg
Writes the supplied data to the specified register.
Syntax
writereg
regName value
Parameters
regName
The name of the register to which to assign the supplied value.
value
The value to write to the specified register.
This value may be specified in hexadecimal (for example, 0xFFFFABCD), octal (for example,
037777725715), or decimal (for example, 4294945741).
Example
This command writes the value 0x00001002 to the MSR register:
writereg MSR 0x00001002
9.2.1.17 writereg64
Writes the supplied 32-bit values to the specified 64-bit register.
NOTE
This command is applicable only to 64-bit Book E cores like
the e5500.
Syntax
writereg regName value1 value2
Arguments
regName
The name of the 64-bit register to which to assign the supplied value.
CodeWarrior Development Studio for Power Architecture Processors Targeting Manual, Rev. 10.5.0,
06/2015
Freescale Semiconductor, Inc.
391
Target initialization commands
value1, value2
The two 32-bit values that together make up the 64-bit value to assign to the specified
register.
Each value may be specified in hexadecimal (for example, 0xFFFFABCD), octal
(for example, 037777725715), or decimal (for example, 4294945741).
Example
This command writes the 64-bit value 0x0123456789ABCDEF to the 64-bit GPR5
register:
writereg64 GPR5 0x01234567 0x89ABCDEF
9.2.1.18 writereg128
Writes the supplied 32-bit values to the specified TLB register.
NOTE
This command is applicable only to Book E cores like the e500
or e500mc variants.
Syntax
writereg128
regName value1 value2 value3 value4
Arguments
regName
The name (or number) of the TLB register to which to assign the specified values.
Tip
Valid TLB0 register names range from L2MMU_TLB0 through
L2MMU_TLB255 ( L2MMU_TLB511 for e500v2 and e500mc).
Tip
Valid TLB1 register names range from L2MMU_CAM0 through
L2MMU_CAM15, and L2MMU_CAM63 for e500mc.
value1, value2, value3, value4
The four 32-bit values that together make up the 128-bit value to assign to the specified
TLB register.
CodeWarrior Development Studio for Power Architecture Processors Targeting Manual, Rev. 10.5.0,
06/2015
392
Freescale Semiconductor, Inc.
Chapter 9 Target Initialization Files
Each value must be specified in hexadecimal (for example, 0xFFFFABCD).
Example
This command writes the values 0xA1002, 0xB1003, 0xC1004, and 0xD1005 to the L2MMU_CAM0
TLB register:
writereg128 L2MMU_CAM1 0x7000000A 0x1C080000 0xFE000000 0xFE000001
9.2.1.19 writereg192
Writes the supplied 32-bit values to the specified TLB register.
NOTE
This command is applicable only to 64-bit Book E cores like
the e5500 variant.
Syntax
writereg192
regName value1 value2 value3 value4 value5 value6
Arguments
regName
The name (or number) of the TLB register to which to assign the specified values.
Tip
Valid TLB0 register names range from L2MMU_TLB0 through
L2MMU_TLB511.
Tip
Valid TLB1 register names range from L2MMU_CAM0 through
L2MMU_CAM63.
value1, value2, value3, value4, value5, value6
The six 32-bit values that together make up the 192-bit value to assign to the specified
TLB register.
Each value must be specified in hexadecimal (for example, 0xFFFFABCD).
Example
This command writes the values 0x7000000A 0x1C080000 0x00000000 0xFE000000
0x00000000 0xFE000001 to the L2MMU_CAM1 TLB register:
CodeWarrior Development Studio for Power Architecture Processors Targeting Manual, Rev. 10.5.0,
06/2015
Freescale Semiconductor, Inc.
393
Target initialization commands
writereg192 L2MMU_CAM1 0x7000000A 0x1C080000 0x00000000 0xFE000000
0x00000000 0xFE000001
9.2.1.20 writespr
Writes the specified value to the specified SPR register.
NOTE
This command is similar to the writereg SPRxxx command,
except that writespr lets you specify the SPR register to modify
by number (in hexadecimal, octal, or decimal).
Syntax
writespr
regNumber value
Arguments
regNumber
The number of the SPR register to which to assign the supplied value.
This value may be specified in hexadecimal (for example, 0x27E), octal (for example,
01176), or decimal (for example, 638).
value
The value to write to the specified SPR register.
This value may be specified in hexadecimal (for example, 0xFFFFABCD), octal (for example,
037777725715), or decimal (for example, 4294945741).
Example
This command writes the value 0x0220000 to SPR register 638:
writespr 638 0x0220000
9.2.2 .tcl target initialization commands
This section describes the tool command language (TCL) - based commands that are used
to initialize a target.
Similar to a .cfg initialization file, a TCL-based initialization file can contain targetspecific initialization, processor core initialization, or debugger-specific initialization.
CodeWarrior Development Studio for Power Architecture Processors Targeting Manual, Rev. 10.5.0,
06/2015
394
Freescale Semiconductor, Inc.
Chapter 9 Target Initialization Files
The .tcl file format offers some advantages over the .cfg file format, for example, it
implements a better memory management approach, and allows you to use memory
address ranges higher than 32-bit and use flow control statements. The .tcl file format is
the recommended target initialization file format.
The debugger automatically executes the TCL script when you debug the launch
configuration. You can also execute the script manually at any time from the Debugger
Shell, by using the source command. The TCL-based target initialization is basically a
debugger shell script and implicitly supports all Debugger Shell commands. For more
details on the Debugger Shell commands, see CodeWarrior Development Studio
Common Features Guide.
The table below lists the equivalent Debugger Shell commands that you can include in a
TCL script for target initialization.
Table 9-3. .tcl target initialization commands
Target initialization commands
Debugger Shell equivalent
writereg, writereg64, writereg128,
writereg192
reg or change
writespr
reg or change (partial equivalence - uses the register name
instead of the spr number)
writemem.l
mem 32bit or change 32bit
writemem.w
mem 16bit or change 16bit
writemem.b
mem 8bit or change 8bit
sleep
wait
writemmr
reg or change
IncOrmmr
change regName [format %x [ expr [reg regName
%d -np] | [expr mask] ] ] or reg regName =
[ format %x [ expr [reg regName %d -np] |
[expr mask] ] ]
ANDmmr
change regName [ format %x [ expr [reg
regName %d -np] & [expr mask] ] ] or reg
regName = [ format %x [ expr [reg regName %d
-np] | [expr mask] ] ]
setCoreID
eppc::setcoreid
resetCoreID
eppc::setcoreid default
run
go
stop
stop
reset
reset
ANDmem.l
change address [ format %x [ expr [mem
address %d -np] & [expr mask] ] ] or mem
address = [ format %x [ expr [mem address %d
-np] & [expr mask] ] ]
Table continues on the next page...
CodeWarrior Development Studio for Power Architecture Processors Targeting Manual, Rev. 10.5.0,
06/2015
Freescale Semiconductor, Inc.
395
Target initialization commands
Table 9-3. .tcl target initialization commands (continued)
Target initialization commands
Debugger Shell equivalent
ORmem.l
change address [ format %x [ expr [mem
address %d -np] | [expr mask] ] ] or mem
address = [ format %x [ expr [mem address %d
-np] & [expr mask] ] ]
alternatePC
N/A
Tip
When accessing registers, for best performance you can add the
register group name followed by '/' before the name of the
register, for example:
reg "e500mc Special Purpose Registers"/MSR = 0x00002000
CodeWarrior Development Studio for Power Architecture Processors Targeting Manual, Rev. 10.5.0,
06/2015
396
Freescale Semiconductor, Inc.
Chapter 10
Memory Configuration Files
A memory configuration file is a command file containing commands that define the
rules the debugger follows when accessing a target board's memory.
NOTE
Memory configuration files do not define the memory map for
the target. Instead, they define how the debugger should treat
the memory map the target has already established. The actual
memory map is initialized either by a target resident boot loader
or by a target initialization file. For more information, see the
Target Initialization Files chapter of this manual.
If necessary, you can have the CodeWarrior debugger execute a memory configuration
file immediately before the debugger downloads a bareboard binary to a target board. The
memory configuration file defines the memory access rules (restrictions, translations)
used each time the debugger needs to access memory on the target board.
NOTE
Assign a memory configuration file to bareboard build targets
only. The memory of a board that boots embedded Linux® is
already set up properly. A memory configuration file defines
memory access rules for the debugger; the file has nothing to do
with the OS running on a board. If needed, a memory
configuration file should be in place at all times. The Linux
Kernel Aware Plugin performs memory translations
automatically, relieving the user from specifying them in the
memory configuration file. In addition, for certain processors,
the debugger can automatically read the translations from the
target in a bareboard scenario, relieving the user from
specifying them in the memory configuration file. For more
information, see Memory translations.
This chapter explains:
CodeWarrior Development Studio for Power Architecture Processors Targeting Manual, Rev. 10.5.0,
06/2015
Freescale Semiconductor, Inc.
397
Using memory configuration files
• Using memory configuration files
• Memory configuration commands
10.1 Using memory configuration files
This section describes how to configure the CodeWarrior debugger to use a specific
memory configuration file.
A memory configuration file contains memory access rules that the CodeWarrior
debugger uses each time the build target, the configuration file is assigned to, is
debugged.
You specify a memory configuration file in the Memory tab of the remote system
configuration (shown in the figure below).
Figure 10-1. Specifying a memory configuration file
You can also write your own memory configuration files. The next section documents the
commands that can appear in such files.
10.2 Memory configuration commands
This section describes for each memory configuration command a brief statement of what
the command does, the command's syntax, a definition of each argument that can be
passed to the command, and examples showing how to use the command.
CodeWarrior Development Studio for Power Architecture Processors Targeting Manual, Rev. 10.5.0,
06/2015
398
Freescale Semiconductor, Inc.
Chapter 10 Memory Configuration Files
In general, the syntax of memory configuration commands follows these rules:
• Spaces and tabs (white space) are ignored
• Character case is ignored
• Unless otherwise noted, values may be specified in hexadecimal, octal, or decimal:
• Hexadecimal values are preceded by 0x (for example, 0xDEADBEEF)
• Octal values are preceded by 0 (for example, 01234567)
• Decimal values start with a non-zero numeric character (for example, 1234)
• Addresses are values that might be prefixed with the memory space command line
prefix: [<MemSP>:]<value>. For example: p:0x80000004 or 0x80000004.
• Comments start with standard C and C++ comment characters, and continue to the
end of the line
The table below lists each command that can appear in a memory configuration file.
Table 10-1. Memory configuration commands
autoEnableTranslations
range
reserved
reservedchar
translate
10.2.1 autoEnableTranslations
The autoEnableTranslations command configures if the translate commands are
considered by the debugger or not.
Syntax
autoEnableTranslations enableFlag
Arguments
enableFlag
Pass true to instruct the debugger to consider the translate commands.
If this command is not present, the translations will not be considered, so this command
should usually be present and have a "true" argument.
Examples
This command enables the debugger to consider the translate commands:
AutoEnableTranslations true
CodeWarrior Development Studio for Power Architecture Processors Targeting Manual, Rev. 10.5.0,
06/2015
Freescale Semiconductor, Inc.
399
Memory configuration commands
10.2.2 range
This command sets debugger access to a block of memory. Note that the range command
must have both the loAddress and hiAddress in the same memory space.
Syntax
range
loAddress hiAddress size access
Arguments
loAddress
the starting address of the memory range
hiAddress
the ending address of the memory range
size
the size, in bytes, the debug monitor or emulator uses for memory accesses
access
controls what type of access the debugger has to the memory block - supply one of: Read,
Write, or ReadWrite
Examples
To set memory locations 0xFF000000 through 0xFF0000FF to read-only with a size of 4 bytes:
range 0xFF000000 0xFF0000FF 4 Read
To set memory locations 0xFF0001000 through 0xFF0001FF to write-only with a size of 2
bytes:
range 0xFF000100 0xFF0001FF 2 Write
To set memory locations 0xFF0002000 through 0xFFFFFFFF to read and write with a size of 1
byte:
range 0xFF000200 0xFFFFFFFF 1 ReadWrite
10.2.3 reserved
CodeWarrior Development Studio for Power Architecture Processors Targeting Manual, Rev. 10.5.0,
06/2015
400
Freescale Semiconductor, Inc.
Chapter 10 Memory Configuration Files
This command allows you to specify a reserved range of memory. If the debugger
attempts to read reserved memory, the resulting buffer is filled with the reserved
character. If the debugger attempts to write to reserved memory, no write takes place.
Note that the reserved command must have both the loAddress and hiAddress in the same
memory space.
NOTE
For information showing how to set the reserved character, see
reservedchar.
Syntax
reserved
loAddress hiAddress
Arguments
loAddress
the starting address of the memory range
hiAddress
the ending address of the memory range
Examples
To reserve memory starting at 0xFF000024 and ending at 0xFF00002F:
reserved 0xFF000024 0xFF00002F
10.2.4 reservedchar
This command sets the reserved character for the memory configuration file. When the
debugger attempts to read a reserved or invalid memory location, it fills the buffer with
this character.
Syntax
reservedchar rChar
Arguments
rChar
the one-byte character the debugger uses when it accesses reserved or invalid memory
Example
CodeWarrior Development Studio for Power Architecture Processors Targeting Manual, Rev. 10.5.0,
06/2015
Freescale Semiconductor, Inc.
401
Memory configuration commands
To set the reserved character to "×":
reservedchar 0x78
10.2.5 translate
This command lets you configure how the debugger performs virtual-to-physical memory
address translations. Typically, you use address translations to debug programs that use a
memory management unit (MMU) that performs block address translations.
NOTE
Using the translate commands in the memory configuration file
prevents the debugger from automatically reading the
translations from the target MMU. For more information, see
Memory translations.
Syntax
translate
virtualAddress
physicalAddress
numBytes
Arguments
virtualAddress
the address of the first byte of the virtual address range to translate
physicalAddress
the address of the first byte of the physical address range to which the debugger translates
virtual addresses
numBytes
the size (in bytes) of the address range to translate
Example
The following translate command:
• Defines a one-megabyte address range ( 0x100000 bytes is one megabyte)
• Instructs the debugger to convert a virtual address in the range 0xC0000000 to 0xC0100000
to the corresponding physical address in the range 0x00000000 to 0x00100000
translate v:0xC0000000 p:0x00000000 0x100000
CodeWarrior Development Studio for Power Architecture Processors Targeting Manual, Rev. 10.5.0,
06/2015
402
Freescale Semiconductor, Inc.
Chapter 11
Working with Hardware Tools
This chapter explains how to use the CodeWarrior hardware tools. Use these tools for
board bring-up, test, and analysis.
In this chapter:
•
•
•
•
Flash programmer
Flash File to Target
Hardware diagnostics
Import/Export/Fill memory
11.1 Flash programmer
Flash programmer is a CodeWarrior plug-in that lets you program the flash memory of
the supported target boards from within the IDE.
The flash programmer can program the flash memory of the target board with code from
a CodeWarrior IDE project or a file. You can perform the following actions on a flash
device using the flash programmer:
•
•
•
•
•
•
•
Erase/Blank check actions
Program/Verify actions
Checksum actions
Diagnostics actions
Dump Flash actions
Protect/Unprotect actions
Secure/Unsecure actions
The flash programmer runs as a target task in the Eclipse IDE. To program the flash
memory on a target board, you need to perform the following tasks:
• Create a flash programmer target task
CodeWarrior Development Studio for Power Architecture Processors Targeting Manual, Rev. 10.5.0,
06/2015
Freescale Semiconductor, Inc.
403
Flash programmer
• Configure flash programmer target task
• Execute flash programmer target task
NOTE
Click the Save button or press Ctrl+S to save task settings.
11.1.1 Create a flash programmer target task
You can create a flash programmer task using the Create New Target Task wizard.
1. Choose Window > Show View > Other from the CodeWarrior IDE menu bar.
The Show View dialog appears.
Figure 11-1. Show View dialog
2. Expand the Debug group and select Target Tasks.
3. Click OK.
The Target Tasks view appears.
CodeWarrior Development Studio for Power Architecture Processors Targeting Manual, Rev. 10.5.0,
06/2015
404
Freescale Semiconductor, Inc.
Chapter 11 Working with Hardware Tools
Figure 11-2. Target Tasks view
4. Click the Create a new Target Task button in the Target Tasks view toolbar.
The Create New Target Task wizard appears.
Figure 11-3. Create New Target Task window
5. In the Task Name textbox, enter a name for the new flash programming target task.
6. Choose a launch configuration from the Run Configuration pop-up menu.
• Choose Active Debug Context when flash programmer is used over an active
debug session.
• Choose a project-specific debug context when flash programmer is used without
an active debug session.
7. Choose Flash Programmer from the Task Type pop-up menu.
CodeWarrior Development Studio for Power Architecture Processors Targeting Manual, Rev. 10.5.0,
06/2015
Freescale Semiconductor, Inc.
405
Flash programmer
8. Click Finish.
The target task is created and the Flash Programmer Task editor window appears.
You use this window to configure the flash programmer target task.
• Flash Devices - Lists the devices added in the current task.
• Target RAM - Lets you specify the settings for Target RAM.
• Flash Program Actions - Displays the programmer actions to be performed on
the flash devices.
11.1.2 Configure flash programmer target task
You can add flash devices, specify Target RAM settings, and add flash program actions
to a flash programmer task to configure it.
This topic contains the following sub-topics:
• Add flash device
• Specify target RAM settings
• Add flash programmer actions
11.1.2.1 Add flash device
To add a flash device to the Flash Devices table:
1. Click the Add Device button.
The Add Device dialog appears.
2. Select a flash device from the device list.
3. Click the Add Device button.
The flash device is added to the Flash Devices table in the Flash Programmer Task
editor window.
NOTE
You can select multiple flash devices to add to the Flash
Devices table. To select multiple devices, hold down the
Control key while selecting the devices.
4. Click Done.
CodeWarrior Development Studio for Power Architecture Processors Targeting Manual, Rev. 10.5.0,
06/2015
406
Freescale Semiconductor, Inc.
Chapter 11 Working with Hardware Tools
The Add Device dialog closes and the flash device appears in the Flash Devices
table in the Flash Programmer Task editor window.
NOTE
For NOR flashes, the base address indicates the location
where the flash is mapped in the memory. For SPI and
NAND flashes, the base address is usually 0x0.
11.1.2.2 Specify target RAM settings
The Target RAM is used by Flash Programmer to download its algorithms.
NOTE
The Target RAM memory area is not restored by flash
programmer. If you are using flash programmer with Active
Debug Context, it will impact your debug session.
The Target RAM(Add flash device) group contains fields to specify settings for the
Target RAM.
• Address textbox: Use it to specify the address from the target memory. The Address
textbox should contain the first address from target memory used by the flash
algorithm running on a target board.
• Size textbox: Use it to specify the size of the target memory. The flash programmer
does not modify any memory location other than the target memory buffer and the
flash memory.
• Verify Target Memory Writes checkbox: Select this checkbox to verify all write
operations to the hardware RAM during flash programming.
11.1.2.3 Add flash programmer actions
In the Flash Programmer Actions group in the Flash Programmer Task editor window
(Create a flash programmer target task), you can add following actions on the flash
device.
•
•
•
•
Erase/Blank check actions
Program/Verify actions
Checksum actions
Diagnostics actions
CodeWarrior Development Studio for Power Architecture Processors Targeting Manual, Rev. 10.5.0,
06/2015
Freescale Semiconductor, Inc.
407
Flash programmer
• Dump Flash actions
• Protect/Unprotect actions
• Secure/Unsecure actions
The Flash Programmer Actions group contains the following UI controls to work with
flash programmer actions:
• Add Action pop-up menu
• Erase/Blank Check Action: Allows you to add erase or blank check actions for
a flash device.
• Program/Verify Action: Allows you to add program or verify flash actions for a
flash device.
• Checksum Action: Allows you to add checksum actions for a flash device.
• Diagnostics Action: Lets you add a diagnostics action.
• Dump Flash Action: Lets you add a dump flash action.
• Protect/Unprotect Action: Lets you add protect or unprotect action.
• Secure/Unsecure Action: Lets you add secure or unsecure action.
• Duplicate Action button: Allows you to duplicate a flash program action in the
Flash Programmer Actions table.
• Remove Action button: Allows you to remove a flash program action from the Flash
Programmer Actions table.
• Move Upbutton: Allows you to move up the selected flash action in the Flash
Programmer Actions table.
• Move Down button: Allows you to move down the selected flash action in the Flash
Programmer Actions table.
NOTE
Actions can also be enabled or disabled using the Enabled
column. The Description column contains the default
description for the flash programmer actions. You can also edit
the default description.
11.1.2.3.1
Erase/Blank check actions
The Erase action erases sectors from the flash device.
You can also use the erase action to erase the entire flash memory without selecting
sectors. The blank check action verifies if the specified areas have been erased from the
flash device.
CodeWarrior Development Studio for Power Architecture Processors Targeting Manual, Rev. 10.5.0,
06/2015
408
Freescale Semiconductor, Inc.
Chapter 11 Working with Hardware Tools
NOTE
Flash Programmer will not erase a bad sector in the NAND
flash. After the erase action a list of bad sectors is reported (if
any).
To add an erase/blank check action:
1. Choose Erase/Blank Check Action from the Add Action pop-up menu.
The Add Erase/Blank Check Action dialog appears.
2. Select a sector from the Sectors table and click the Add Erase Action button to add
an erase operation on the selected sector.
NOTE
Press the Control or the Shift key for selecting multiple
sectors from the Sectors table.
3. Click the Add Blank Check button to add a blank check operation on the selected
sector.
4. Select the Erase All Sectors Using Chip Erase Command checkbox to erase the
entire flash memory.
NOTE
After selecting the Erase All Sectors Using Chip Erase
Command checkbox, you need to add either erase or blank
check action to erase all sectors.
5. Click Done.
The Add Erase/Blank Check Action dialog closes and the added erase/blank check
actions appear in the Flash Programmer Actions table in the Flash Programmer
Task editor window.
11.1.2.3.2
Program/Verify actions
The Program action allows you to program the flash device and the verify action verifies
the programmed flash device.
NOTE
The program action will abort and fail if it is performed in a bad
block for NAND flashes.
To add a program/verify action:
1. Choose Program/Verify Action from the Add Action pop-up menu.
CodeWarrior Development Studio for Power Architecture Processors Targeting Manual, Rev. 10.5.0,
06/2015
Freescale Semiconductor, Inc.
409
Flash programmer
The Add Program/Verify Action dialog appears.
2. Select the file to be written to the flash device.
3. Select the Use File from Launch Configuration checkbox to use the file from the
launch (run) configuration associated with the task.
4. Specify the file name in the File textbox. You can use Workspace, File System, or
Variables buttons to select the desired file.
5. Choose a file type from the File Type pop-up menu. You can select any one of the
following file types:
• Auto - Detects the file type automatically.
• Elf - Specifies executable in ELF format.
• Srec - Specifies files in Motorola S-record format.
• Binary - Specifies binary files.
6. Select the Erase sectors before program checkbox to erase sectors before program.
7. [Optional] Select the Verify after program checkbox to verify after the program.
NOTE
The Verify after program checkbox is available only with
the processors supporting it.
8. Select the Restricted To Address in this Range checkbox to specify a memory
range. The write action is permitted only in the specified address range. In the Start
textbox, specify the start address of the memory range sector and in the End textbox,
specify the end address of the memory range.
9. Select the Apply Address Offset checkbox and set the memory address in the
Address textbox. Value is added to the start address of the file to be programmed or
verified.
10. Click the Add Program Action button to add a program action on the flash device.
11. Click the Add Verify Action button to add a verify action on the flash device.
12. Click Done.
The Add Program/Verify Action dialog closes and the added program/verify
actions appear in the Flash Programmer Actions table in the Flash Programmer
Task editor window.
11.1.2.3.3
Checksum actions
The checksum can be computed over host file, target file, memory range or entire flash
memory.
To add a checksum action:
1. Choose Checksum Action from the Add Action pop-up menu.
CodeWarrior Development Studio for Power Architecture Processors Targeting Manual, Rev. 10.5.0,
06/2015
410
Freescale Semiconductor, Inc.
Chapter 11 Working with Hardware Tools
The Add Checksum Action dialog appears.
2. Select the file for checksum action.
3. Select the Use File from Launch Configuration checkbox to use the file from the
launch (run) configuration associated with the task.
4. Specify the filename in the File textbox. You can use the Workspace, File System,
or Variables buttons to select the desired file.
5. Choose the file type from the File Type pop-up menu.
6. Select an option from the Compute Checksum Over options. The checksum can be
computed over the host file, the target file, the memory range, or the entire flash
memory.
7. Specify the memory range in the Restricted To Addresses in this Range group. The
checksum action is permitted only in the specified address range. In the Start
textbox, specify the start address of the memory range sector and in the End textbox,
specify the end address of the memory range.
8. Select the Apply Address Offset checkbox and set the memory address in the
Address textbox. Value is added to the start address of the file to be programmed or
verified.
9. Click the Add Checksum Action button.
10. Click Done.
The Add Checksum Action dialog closes and the added checksum actions appear in
the Flash Programmer Actions table in the Flash Programmer Task editor
window.
11.1.2.3.4
Diagnostics actions
The diagnostics action generates the diagnostic information for a selected flash device.
NOTE
Flash Programmer will report bad blocks, if they are present in
the NAND flash.
To add a diagnostics action:
1. Choose Diagnostics from the Add Action pop-up menu.
The Add Diagnostics Action dialog appears.
2. Select a device to perform the diagnostics action.
3. Click the Add Diagnostics Action button to add diagnostic action on the selected
flash device.
CodeWarrior Development Studio for Power Architecture Processors Targeting Manual, Rev. 10.5.0,
06/2015
Freescale Semiconductor, Inc.
411
Flash programmer
NOTE
Select the Perform Full Diagnostics checkbox to perform
full diagnostics on a flash device.
4. Click Done.
The Add Diagnostics Action dialog closes and the added diagnostics action appears
in the Flash Programmer Actions table in the Flash Programmer Task editor
window.
11.1.2.3.5
Dump Flash actions
The dump flash action allows you to dump selected sectors of a flash device or the entire
flash device.
To add a dump flash action:
1. Choose Dump Flash Action from the Add Action pop-up menu.
The Add Dump Flash Action dialog appears.
2. Specify the file name in the File textbox. The flash is dumped in this selected file.
3. Choose the file type from the File Type pop-up menu. You can choose any one of
the following file types:
• Srec: Saves files in Motorola S-record format.
• Binary: Saves files in binary file format.
4. Specify the memory range for which you want to add dump flash action.
• Enter the start address of the range in the Start textbox.
• Enter the end address of the range in the End textbox.
5. Click the Add Dump Flash Action button to add a dump flash action.
6. Click Done.
The Add Dump Flash Action dialog closes and the added dump flash action appear
in the Flash Programmer Actions table in the Flash Programmer Task editor
window.
11.1.2.3.6
Protect/Unprotect actions
The protect/unprotect actions allow you to change the protection of a sector in the flash
device.
To add a protect/unprotect action:
CodeWarrior Development Studio for Power Architecture Processors Targeting Manual, Rev. 10.5.0,
06/2015
412
Freescale Semiconductor, Inc.
Chapter 11 Working with Hardware Tools
1. Choose the Protect/Unprotect Action from the Add Action pop-up menu.
The Add Protect/Unprotect Action dialog appears.
2. Select a sector from the Sectors table and click the Add Protect Action button to
add a protect operation on the selected sector.
NOTE
Press the Control or Shift key for selecting multiple sectors
from the Sectors table.
3. Click the Add Unprotect Action button to add an unprotect action on the selected
sector.
4. Select the All Device checkbox to add action on full device.
5. Click Done.
The Add Protect/Unprotect Action dialog closes and the added protect or unprotect
actions appear in the Flash Programmer Actions table in the Flash Programmer
Task editor window.
11.1.2.3.7
Secure/Unsecure actions
The secure/unsecure actions help you change the security of a flash device.
NOTE
The Secure/Unsecure flash actions are not supported for
StarCore devices.
To add a secure/unsecure action:
1. Choose the Secure/Unsecure Action from the Add Action pop-up menu.
The Add Secure/UnSecure Action dialog appears.
2. Select a device from the Flash Devices table.
3. Click the Add Secure Action button to add Secure action on the selected flash
device.
a. Enter password in the Password textbox.
b. Choose the password format from the Format pop-up menu.
4. Click the Add Unsecure Action button to add an unprotect action on the selected
sector.
5. Click Done.
CodeWarrior Development Studio for Power Architecture Processors Targeting Manual, Rev. 10.5.0,
06/2015
Freescale Semiconductor, Inc.
413
Flash programmer
The Add Secure/UnSecure Action dialog closes and the added secure or unsecure
action appears in the Flash Programmer Actions table in the Flash Programmer
Task editor window.
11.1.2.3.8
Duplicate action
You can duplicate a flash programmer action from the Flash Programmer Actions
table.
1. Select the action in the Flash Programmer Actions table.
2. Click the Duplicate Action button.
The selected action is copied in the Flash Programmer Action table.
11.1.2.3.9
Remove action
You can remove a flash programmer action from the Flash Programmer Actions table.
1. Select the action in the Flash Programmer Actions table.
2. Click the Remove Action button.
The selected action is removed from the Flash Programmer Action table.
11.1.3 Execute flash programmer target task
You can execute the flash programmer tasks using the Target Tasks view.
To execute the configured flash programmer target task, select a target task and click the
Execute button in the Target Tasks view toolbar. Alternatively, right-click on a target
task and choose Execute from the shortcut menu.
CodeWarrior Development Studio for Power Architecture Processors Targeting Manual, Rev. 10.5.0,
06/2015
414
Freescale Semiconductor, Inc.
Chapter 11 Working with Hardware Tools
Figure 11-4. Execute target task
NOTE
You can use predefined target tasks for supported boards. To
load a predefined target task, right-click in the Target Tasks
view and choose Import Target Task from the shortcut menu.
To save your custom tasks, right-click in the Target Tasks
view and then choose Export Target Task from the shortcut
menu.
You can check the results of flash batch actions in the Console view. The green color
indicates the success and the red color indicates the failure of the task.
Figure 11-5. Console view
CodeWarrior Development Studio for Power Architecture Processors Targeting Manual, Rev. 10.5.0,
06/2015
Freescale Semiconductor, Inc.
415
Flash File to Target
11.2 Flash File to Target
You can use the Flash File to Target feature to perform flash operations such as erasing
a flash device or programming a file.
You do not need any project for using Flash File to Target feature, only a valid Remote
System is required.
To open the Flash File to Target dialog, click the Flash Programmer button on the IDE
toolbar.
• Connection pop-up menu- Lists all run configurations defined in Eclipse. If a
connection to the target has already been made the control becomes inactive and
contains the text Active Debug Configuration.
• Flash Configuration File pop-up menu - Lists predefined target tasks for the
processor selected in the Launch Configuration and tasks added by user with the
Browse button. The items in this pop-up menu are updated based on the processor
selected in the launch configuration. For more information on launch configurations,
see product's Targeting Manual.
• Unprotect flash memory before erase checkbox - Select to unprotect flash
memory before erasing the flash device. This feature allows you to unprotect the
flash memory from Flash File To Target dialog.
• File to Flash group - Allows selecting the file to be programmed on the flash device
and the location.
• File textbox - Used for specifying the filename. You can use the Workspace,
File System, or Variables buttons to select the desired file.
• Offset:0x textbox - Used for specifying offset location for a file. If no offset is
specified the default value of zero is used. The offset is always added to the start
address of the file. If the file does not contain address information then zero is
considered as start address.
• Save as Target Task - Select to enable Task Name textbox.
• Task Name textbox - Lets you to save the specified settings as a Flash target
task. Use the testbox to specify the name of the target task.
• Erase Whole Device button - Erases the flash device. In case you have multiple
flash blocks on the device, all blocks are erased. If you want to selectively erase or
program blocks, use the Flash programmer feature.
• Erase and Program button - Erases the sectors that are occupied with data and then
programs the file. If the flash device can not be accessed at sector level then the flash
device is completely erased.
This feature helps you perform these basic flash operations:
CodeWarrior Development Studio for Power Architecture Processors Targeting Manual, Rev. 10.5.0,
06/2015
416
Freescale Semiconductor, Inc.
Chapter 11 Working with Hardware Tools
• Erasing flash device
• Programming a file
11.2.1 Erasing flash device
To erase a flash device, follow these steps:
1. Click the Flash Programmer button on the IDE toolbar.
The Flash File to Target dialog appears.
2. Choose a connection from the Connection pop-up menu.
NOTE
If a connection is already established with the target, this
control is disabled.
The Flash Configuration File pop-up menu is updated with the supported
configurations for the processor from the launch configuration.
3. Choose a flash configuration from the Flash Configuration File pop-up menu.
4. Select the Unprotect flash memory before erase checkbox to unprotect flash
memory before erasing the flash device.
5. Click the Erase Whole Device button.
11.2.2 Programming a file
1. Click the Flash Programmer button on the IDE toolbar.
The Flash File to Target dialog appears.
2. Choose a connection from the Connection pop-up menu.
NOTE
If a connection is already established with the target, this
control is disabled.
The Flash Configuration File pop-up menu is updated with the supported
configurations for the processor from the launch configuration.
3. Choose a flash configuration from the Flash Configuration File pop-up menu.
CodeWarrior Development Studio for Power Architecture Processors Targeting Manual, Rev. 10.5.0,
06/2015
Freescale Semiconductor, Inc.
417
Hardware diagnostics
4. Select the Unprotect flash memory before erase checkbox to unprotect flash
memory before erasing the flash device.
5. Type the file name in the File textbox. You can use the Workspace, File System, or
Variables buttons to select the desired file.
6. Type the offset location in the Offset textbox.
7. Click the Erase and Program button.
11.3 Hardware diagnostics
The Hardware Diagnostics utility lets you run a series of diagnostic tests that determine
if the basic hardware is functional.
These tests include:
• Memory read/write: This test only makes a read or write access to the memory to
read or write a byte, word (2 bytes) and long word (4 bytes) to or from the memory.
For this task, the user needs to set the options in the Memory Access group.
• Scope loop: This test makes read and write accesses to memory in a loop at the target
address. The time between accesses is given by the loop speed settings. The loop can
only be stopped by the user, which cancels the test. For this type of test, the user
needs to set the memory access settings and the loop speed.
• Memory tests: This test requires the user to set the access size and target address
from the access settings group and the settings present in the Memory Tests group.
This topic contains the following sub-topics:
• Creating hardware diagnostics task
• Working with Hardware Diagnostic Action editor
• Memory test use cases
11.3.1 Creating hardware diagnostics task
You can create a hardware diagnostic task using the Create New Target Task wizard.
To create a task for hardware diagnostics:
1. Choose Window > Show View > Other from the IDE menu bar.
The Show View dialog appears.
CodeWarrior Development Studio for Power Architecture Processors Targeting Manual, Rev. 10.5.0,
06/2015
418
Freescale Semiconductor, Inc.
Chapter 11 Working with Hardware Tools
2. Expand the Debug group and select Target Tasks.
3. Click OK.
4. Click the Create a new Target Task button on the Target Tasks view toolbar.
Alternatively, right-click in the Target Tasks view and choose New Task from the
shortcut menu.
The Create a New Target Task wizard appears.
5. Type name for the new task in the Task Name textbox.
6. Choose a launch configuration from the Run Configuration pop-up menu.
NOTE
If the task does not successfully launch the configuration
that you specify, the Execute button on the Target Tasks
view toolbar stays unavailable.
7. Choose Hardware Diagnostic from the Task Type pop-up menu.
8. Click Finish.
A new hardware diagnostic task is created in the Target Tasks view.
NOTE
You can perform various actions on a hardware diagnostic
task, such as renaming, deleting, or executing the task,
using the shortcut menu that appears on right-clicking the
task in the Target tasks view.
11.3.2 Working with Hardware Diagnostic Action editor
The Hardware Diagnostic Action editor is used to configure a hardware diagnostic task.
To open the Hardware Diagnostic Action editor for a particular task, double-click the
task in the Target Tasks view.
The following figure shows the Hardware Diagnostics Action editor.
CodeWarrior Development Studio for Power Architecture Processors Targeting Manual, Rev. 10.5.0,
06/2015
Freescale Semiconductor, Inc.
419
Hardware diagnostics
Figure 11-6. Hardware Diagnostics Action editor
The Hardware Diagnostics Action editor window includes the following groups:
•
•
•
•
Action Type
Memory Access
Loop Speed
Memory Tests
11.3.2.1 Action Type
The Action Type group in the Hardware Diagnostics Action editor window is used for
selecting the action type.
You can choose any one of the following actions:
• Memory read/write - Enables the options in the Memory Access group.
CodeWarrior Development Studio for Power Architecture Processors Targeting Manual, Rev. 10.5.0,
06/2015
420
Freescale Semiconductor, Inc.
Chapter 11 Working with Hardware Tools
• Scope loop - Enables the options in the Memory Access and the Loop Speed
groups.
• Memory test - Enables the access size and target address from the access settings
group and the settings present in the Memory Tests group.
11.3.2.2 Memory Access
The Memory Access pane configures diagnostic tests for performing memory reads and
writes over the remote connection interface.
The table below lists and describes the items in the pane.
Table 11-1. Memory Access Pane Items
Item
Description
Read
Select to have the hardware diagnostic tools perform read tests.
Write
Select to have the hardware diagnostic tools perform write tests.
1 unit
Select to have the hardware diagnostic tools perform one memory unit access size operations.
2 units
Select to have the hardware diagnostic tools perform two memory units access size operations.
4 units
Select to have the hardware diagnostic tools perform four memory units access size operations.
Target Address
Specify the address of an area in RAM that the hardware diagnostic tools should analyze. The
tools must be able to access this starting address through the remote connection (after the
hardware initializes).
Value
Specify the value that the hardware diagnostic tools write during testing. Select the Write option
to enable this textbox.
Verify Memory Writes
Select the checkbox to verify success of each data write to the memory.
11.3.2.3 Loop Speed
The Loop Speed pane configures diagnostic tests for performing repeated memory reads
and writes over the remote connection interface.
The tests repeat until you stop them. By performing repeated read and write operations,
you can use a scope analyzer or logic analyzer to debug the hardware device. After the
first 1000 operations, the Status shows the estimated time between operations.
NOTE
For all values of Speed, the time between operations depends
heavily on the processing speed of the host computer.
CodeWarrior Development Studio for Power Architecture Processors Targeting Manual, Rev. 10.5.0,
06/2015
Freescale Semiconductor, Inc.
421
Hardware diagnostics
For Read operations, the Scope Loop test has an additional feature. During the first read
operation, the hardware diagnostic tools store the value read from the hardware. For all
successive read operations, the hardware diagnostic tools compare the read value to the
stored value from the first read operation. If the Scope Loop test determines that the value
read from the hardware is not stable, the diagnostic tools report the number of times that
the read value differs from the first read value. Following table lists and describes the
items in Loop Speed pane.
Table 11-2. Loop Speed Pane Items
Item
Set Loop Speed
Description
Enter a numeric value between 0 to 1000 in the textbox to adjust the speed. You can
also move the slider to adjust the speed at which the hardware diagnostic tools repeat
successive read and write operations. Lower speeds increase the delay between
successive operations. Higher speeds decrease the delay between successive
operations.
11.3.2.4 Memory Tests
The Memory Tests pane lets you perform three hardware tests, Walking Ones, Bus
Noise, and Address.
You can specify any combination of tests and number of passes to perform. For each
pass, the hardware diagnostic tools performs the tests in turn, until all passes are
complete. The tools compare memory test failures and display them in a log window after
all passes are complete. Errors resulting from memory test failures do not stop the testing
process; however, fatal errors immediately stop the testing process.
The following table explains the items in the Memory Tests pane.
Table 11-3. Memory Tests pane items
Item
Explanation
Walking 1's
Select the checkbox to have the hardware diagnostic tools perform the Walking Ones test.
Deselect to have the diagnostic tools skip the Walking Ones test.
Address
Select to have the hardware diagnostic tools perform the Address test. Deselect to have the
diagnostic tools skip the Address test.
Bus Noise
Select to have the hardware diagnostic tools perform the Bus noise test. Deselect to have the
diagnostic tools skip the Bus noise test.
Test Area Size
Specify the size of memory to be tested. This setting along with Target Address defines the
memory range being tested.
Number of Passes
Enter the number of times that you want to repeat the specified tests.
Table continues on the next page...
CodeWarrior Development Studio for Power Architecture Processors Targeting Manual, Rev. 10.5.0,
06/2015
422
Freescale Semiconductor, Inc.
Chapter 11 Working with Hardware Tools
Table 11-3. Memory Tests pane items (continued)
Item
Explanation
Use Target CPU
Select to have the hardware diagnostic tools download the test code to the hardware device.
Deselect to have the hardware diagnostic tools execute the test code through the remote
connection interface. Execution performance improves greatly if you execute the test code on
the hardware CPU, but requires that the hardware has enough stability and robustness to
execute the test code.
NOTE: The option is not applicable for CodeWarrior StarCore devices.
Download Algorithm to
Address
Specify the address where the test driver is downloaded in case the Use target CPU is
selected.
NOTE: The option is not applicable for CodeWarrior StarCore devices.
11.3.2.4.1
Walking Ones
This test detects these memory faults:
• Address Line: The board or chip address lines are shorting or stuck at 0 or 1. Either
condition could result in errors when the hardware reads and writes to the memory
location. Because this error occurs on an address line, the data may end up in the
wrong location on a write operation, or the hardware may access the wrong data on a
read operation.
• Data Line: The board or chip data lines are shorting or stuck at 0 or 1. Either
condition could result in corrupted values as the hardware transfers data to or from
memory.
• Retention: The contents of a memory location change over time. The effect is that the
memory fails to retain its contents over time.
The Walking Ones test includes four sub-tests:
• Walking Ones: This subtest first initializes memory to all zeros. Then the subtest
writes, reads, and verifies bits, with each bit successively set from the least
significant bit ( LSB) to the most significant bit ( MSB). The subtest configures bits
such that by the time it sets the MSB, all bits are set to a value of 1. This pattern
repeats for each location within the memory range that you specify. For example, the
values for a byte-based Walking Ones subtest occur in this order:
0x01, 0x03, 0x07, 0x0F, 0x1F, 0x3F, 0x7F, 0xFF
• Ones Retention: This subtest immediately follows the Walking Ones subtest. The
Walking Ones subtest should leave each memory location with all bits set to 1. The
Ones Retention subtest verifies that each location has all bits set to 1.
• Walking Zeros: This subtest first initializes memory to all ones. Then the subtest
writes, reads, and verifies bits, with each bit successively set from the LSB to the
CodeWarrior Development Studio for Power Architecture Processors Targeting Manual, Rev. 10.5.0,
06/2015
Freescale Semiconductor, Inc.
423
Hardware diagnostics
MSB. The subtest configures bits such that by the time it sets the MSB, all bits are
set to a value of 0. This pattern repeats for each location within the memory range
that you specify. For example, the values for a byte-based Walking Zeros subtest
occur in this order:
0xFE, 0xFC, 0xF8, 0xF0, 0xE0, 0xC0, 0x80, 0x00
• Zeros Retention: This subtest immediately follows the Walking Zeros subtest. The
Walking Zeros subtest should leave each memory location with all bits set to 0. The
Zeros Retention subtest verifies that each location has all bits set to 0.
11.3.2.4.2
Address
This test detects memory aliasing. Memory aliasing exists when a physical memory block
repeats one or more times in a logical memory space. Without knowing about this
condition, you might conclude that there is much more physical memory than what
actually exists.
The address test uses a simplistic technique to detect memory aliasing. The test writes
sequentially increasing data values (starting at one and increasing by one) to each
successive memory location. The maximum data value is a prime number and its specific
value depends on the addressing mode so as to not overflow the memory location.
The test uses a prime number of elements to avoid coinciding with binary math
boundaries:
• For byte mode, the maximum prime number is 28-5 or 251.
• For word mode, the maximum prime number is 216-15 or 65521.
• For long word mode, the maximum prime number is 232-5 or 4294967291.
If the test reaches the maximum value, the value rolls over to 1 and starts incrementing
again. This sequential pattern repeats throughout the memory under test. Then the test
reads back the resulting memory and verifies it against the written patterns. Any
deviation from the written order could indicate a memory aliasing condition.
11.3.2.4.3
Bus noise
This test stresses the memory system by causing many bits to flip from one memory
access to the next (both addresses and data values). Bus noise occurs when many bits
change consecutively from one memory access to another. This condition can occur on
both address and data lines.
CodeWarrior Development Studio for Power Architecture Processors Targeting Manual, Rev. 10.5.0,
06/2015
424
Freescale Semiconductor, Inc.
Chapter 11 Working with Hardware Tools
11.3.2.4.4
Address lines
To force bit flips in address lines, the test uses three approaches:
• Sequential- This approach works sequentially through all of the memory under test,
from lowest address to highest address. This sequential approach results in an
average number of bit flips from one access to the next.
• Full Range Converging- This approach works from the fringes of the memory range
toward the middle of the memory range. Memory access proceeds in this pattern,
where + number and - number indicate the next item location (the specific
increment or decrement depends on byte, word, or long word address mode):
• the lowest address
• the highest address
• (the lowest address) + 1
• (the highest address) - 1
• (the lowest address) + 2
• (the highest address) - 2
• Maximum Invert Convergence- This approach uses calculated end point addresses to
maximize the number of bits flipping from one access to the next. This approach
involves identifying address end points such that the values have the maximum
inverted bits relative to one another. Specifically, the test identifies the lowest
address with all 0x5 values in the least significant nibbles and the highest address
with all 0xA values in the least significant nibbles. After the test identifies these end
points, memory access alternates between low address and high address, working
towards the center of the memory under test. Accessing memory in this manner, the
test achieves the maximum number of bits flips from one access to the next.
11.3.2.4.5
Data lines
To force bit flips in data lines, the test uses two sets of static data, a pseudo-random set
and a fixed-pattern set. Each set contains 31 elements-a prime number. The test uses a
prime number of elements to avoid coinciding with binary math boundaries. The sets are
unique to each addressing mode so as to occupy the full range of bits.
• The test uses the pseudo-random data set to stress the data lines in a repeatable but
pattern-less fashion.
• The test uses the fixed-pattern set to force significant numbers of data bits to flip
from one access to the next.
CodeWarrior Development Studio for Power Architecture Processors Targeting Manual, Rev. 10.5.0,
06/2015
Freescale Semiconductor, Inc.
425
Hardware diagnostics
The sub-tests execute similarly in that each subtest iterates through static data, writing
values to memory. The test combines the three address line approaches with the two data
sets to produce six unique sub-tests:
•
•
•
•
•
•
Sequential with Random Data
Sequential with Fixed Pattern Data
Full Range Converging with Random Data
Full Range Converging with Fixed Pattern Data
Maximum Invert Convergence with Random Data
Maximum Invert Convergence with Fixed Pattern Data
11.3.3 Memory test use cases
The memory read /write and scope loop tests are host based tests. The host machine
issues read and write action to the memory through the connection protocol. For example
CCS.
Memory tests are the complex tests that can be executed in two modes: Host based and
Target based
depending upon the selection made for the Use Target CPU checkbox.
• Selected: Target Based
• Deselected: Host Based
The Host Based tests are slower than the Target Based tests.
11.3.3.1 Use Case 1: Execute host-based Scope Loop on target
You need to perform the following action to execute the host based scope loop on the
target:
1.
2.
3.
4.
5.
Select Scope loop in the Action Type.
Set Memory Access settings from the Memory Access section.
Set the speed used for the scope loop diagnostic from the Loop Speed section.
Save the settings.
Press Execute to execute the action.
CodeWarrior Development Studio for Power Architecture Processors Targeting Manual, Rev. 10.5.0,
06/2015
426
Freescale Semiconductor, Inc.
Chapter 11 Working with Hardware Tools
11.3.3.2 Use Case 2: Execute target-based Memory Tests on target
You need to perform the following action to execute the target based memory test on the
target:
1. Select Memory Test in the Action Type.
2. Specify Target Address and Access Size settings from the Memory Access section.
3. Specify the following settings for Memory Tests section:
• Test Area Size: The tested memory region is computed from Target Address
until Target Address + Test Area Size.
• Tests to Run: Select tests to run on the target.
• Number of passes: Specify number of times a test will be executed.
• Use Target CPU: set the Address to which the test driver (algorithm) is to be
downloaded.
4. Save the settings.
5. Press Execute to execute the action.
11.4 Import/Export/Fill memory
The Import/Export/Fill Memory utility lets you export memory contents to a file and
import data from a file into memory.
The utility also supports filling memory with a user provided data pattern.
11.4.1 Creating task for import/export/fill memory
You can use the Import/Export/Fill Memory utility to perform various tasks on
memory.
The utility can be accessed from the Target Tasks view.
To open the Target Tasks view:
1. Choose Window > Show View > Other from the IDE menu bar.
The Show View dialog appears.
2. Expand the Debug group.
3. Select Target Tasks.
CodeWarrior Development Studio for Power Architecture Processors Targeting Manual, Rev. 10.5.0,
06/2015
Freescale Semiconductor, Inc.
427
Import/Export/Fill memory
4. Click OK.
The first time it opens, the Target Tasks view contains no tasks. You must create a task
to use the Import/Export/Fill Memory utility.
To create a task:
1. Click the Create a new Target Task button on the toolbar of the Target Tasks
view. Alternatively, right-click the left-hand list of tasks and choose New Task from
the shortcut menu that appears.
The Create a New Target Task page appears.
Figure 11-7. Create New Target Task Window
2. In the Task Name textbox, enter a name for the new task.
3. Use the Run Configuration pop-up menu to specify the configuration that the task
launches and uses to connect to the target.
NOTE
If the task does not successfully launch the configuration
that you specify, the Execute button of the Target Tasks
view toolbar stays unavailable.
4. Use the Task Type pop-up menu to specify Import/Export/Fill Memory.
5. Click Finish.
CodeWarrior Development Studio for Power Architecture Processors Targeting Manual, Rev. 10.5.0,
06/2015
428
Freescale Semiconductor, Inc.
Chapter 11 Working with Hardware Tools
The Import/Export/Fill Memory target task is created and it appears in the Import/
Export/Fill Memory Action editor.
Figure 11-8. Import/Export Memory Action editor
11.4.2 Importing data into memory
You can import the encoded data from a user specified file, decode it, and copy it into a
user specified memory range.
Select the Import memory option from the Import/Export/Fill Memory Action editor
to import data into memory.
CodeWarrior Development Studio for Power Architecture Processors Targeting Manual, Rev. 10.5.0,
06/2015
Freescale Semiconductor, Inc.
429
Import/Export/Fill memory
Figure 11-9. Import/Export Memory Action editor - Importing data into memory
The following table explains the import memory options.
Table 11-4. Controls used for importing data into memory
Item
Explanation
Memory space and address
Enter the literal address and memory space on which the data transfer is performed.
The Literal address field allows only decimal and hexadecimal values.
Expression
Enter the memory address or expression at which the data transfer starts.
Access Size
Denotes the number of addressable units of memory that the debugger accesses in
transferring one data element. The default values shown are 1, 2, and 4 units. When
target information is available, this list shall be filtered to display the access sizes that
are supported by the target.
Select file
Enter the path to the file that contains the data to be imported. Click the Workspace
button to select a file from the current project workspace. Click the System button to
select a file from the file system the standard File Open dialog. Click the Variables
button to select a build variable.
File Type
Defines the format in which the imported data is encoded. By default, the following file
types are supported:
• Signed decimal Text
• Unsigned decimal Text
• Motorola S-Record format
• Hex Text
Table continues on the next page...
CodeWarrior Development Studio for Power Architecture Processors Targeting Manual, Rev. 10.5.0,
06/2015
430
Freescale Semiconductor, Inc.
Chapter 11 Working with Hardware Tools
Table 11-4. Controls used for importing data into memory (continued)
Item
Explanation
• Annotated Hex Text
• Raw Binary
Number of Elements
Enter the total number of elements to be transferred.
Verify Memory Writes
Select the checkbox to verify success of each data write to the memory.
11.4.3 Exporting memory to file
You can read data from a user specified memory range, encode it in a user specified
format, and store this encoded data in a user specified output file.
Select the Export memory option from the Import/Export/Fill Memory Action editor
to export memory to a file.
Figure 11-10. Exporting memory
CodeWarrior Development Studio for Power Architecture Processors Targeting Manual, Rev. 10.5.0,
06/2015
Freescale Semiconductor, Inc.
431
Import/Export/Fill memory
The following table explains the export memory options.
Table 11-5. Controls used for exporting data from memory into file
Item
Explanation
Memory space and address
Enter the literal address and memory space on which the data transfer is performed.
The Literal address field allows only decimal and hexadecimal values.
Expression
Enter the memory address or expression at which the data transfer starts.
Access Size
Denotes the number of addressable units of memory that the debugger accesses in
transferring one data element. The default values shown are 1, 2, and 4 units. When
target information is available, this list shall be filtered to display the access sizes that
are supported by the target.
Select file
Enter the path of the file to write data. Click the Workspace button to select a file from
the current project workspace. Click the System button to select a file from the file
system the standard File Open dialog. Click the Variables button to select a build
variable.
File Type
Defines the format in which encoded data is exported. By default, the following file
types are supported:
• Signed decimal Text
• Unsigned decimal Text
• Motorola S-Record format
• Hex Text
• Annotated Hex Text
• Raw Binary
Number of Elements
Enter the total number of elements to be transferred.
11.4.4 Fill memory
You can fill a user specified memory range with a user specified data pattern.
Select the Fill memory option from the Import/Export/Fill Memory Action editor
window to fill memory.
CodeWarrior Development Studio for Power Architecture Processors Targeting Manual, Rev. 10.5.0,
06/2015
432
Freescale Semiconductor, Inc.
Chapter 11 Working with Hardware Tools
Figure 11-11. Fill memory
The following table explains the fill memory options.
Table 11-6. Controls used for filling memory with data pattern
Item
Explanation
Memory space and address
Enter the literal address and memory space on which the fill operation is performed. The
Literal address field allows only decimal and hexadecimal values.
Expression
Enter the memory address or expression at which the fill operation starts.
Access Size
Denotes the number of addressable units of memory that the debugger accesses in
modifying one data element. The default values shown are 1, 2, and 4 units. When target
information is available, this list shall be filtered to display the access sizes that are supported
by the target.
Fill Pattern
Denotes the sequence of bytes, ordered from low to high memory mirrored in the target. The
field accept only hexadecimal values. If the width of the pattern exceeds the access size, an
error message.
Number of Elements
Enter the total number of elements to be modified.
Verify Memory Writes
Select the checkbox to verify success of each data write to the memory.
CodeWarrior Development Studio for Power Architecture Processors Targeting Manual, Rev. 10.5.0,
06/2015
Freescale Semiconductor, Inc.
433
Import/Export/Fill memory
CodeWarrior Development Studio for Power Architecture Processors Targeting Manual, Rev. 10.5.0,
06/2015
434
Freescale Semiconductor, Inc.
Chapter 12
Making a Custom MSL C Library
This chapter describes porting a main standard libraries (MSL) C library to the GNU
compiler collection (GCC) tool to support bareboard applications that execute on the
Power Architecture - based boards.
NOTE
If you target P10*0 or P20*0 bareboard application using
CodeWarrior toolchain, you use Embedded Warrior Library
( EWL) instead of MSL. The CodeWarrior stationery wizard is
already setup to automatically configure the correct library and
toolchain depending on the target processor selected. For more
information on EWL, see EWL C Reference.
Occasionally you must create bareboard applications that, while invoking the services of
the MSL C Library, must execute on new Power Architecture-based boards. You can
manage this by using the GCC tool to customize the MSL C library for the new board's
hardware configuration.
The location of the customized library installation must differ from the existing MSL
libraries to ensure that it does not affect the creation of new projects for the Linux
operating system. Otherwise, every time you run the wizard to create a new bareboard
application, the CodeWarrior IDE would automatically use the customized C library.
NOTE
The custom MSL C Library discussed in this chapter is already
installed as a part of the CodeWarrior installation process and
can be located under the ..\PA\PA_Support\MSL directory.
This chapter explains:
•
•
•
•
Source library modifications
Modifications to avoid errors from GCC LD tool
Software floating point emulation support
Building a custom MSL C library
CodeWarrior Development Studio for Power Architecture Processors Targeting Manual, Rev. 10.5.0,
06/2015
Freescale Semiconductor, Inc.
435
Source library modifications
12.1 Source library modifications
This section describes the modifications done to the existing MSL C library sources to
make them compatible with the GCC compiler.
The existing MSL C library sources, when built with GCC compiler, generate error
messages due to language syntax and implementation differences. To overcome these
errors, some modifications to the existing library sources are necessary. The
modifications handled by the conditional directive _GCCPORT_ are summarized below:
• CodeWarrior directives, such as _option, _has_intrinsic, _has_feature, and _suppports
are treated as macros to the equivalent GCC directives. Therefore, _has_intrinsic,
_has_feature and _suppports have been set to false. Equivalent GCC options are used to
replace the various capabilities provided by the _option directive.
• The declspec keyword has been replaced with _attribute_.
• The _MSL_INLINE_ declaration becomes _inline under CodeWarrior. To avoid multiple
definition errors generated by the GCC linker, replace _inline with with
_attribute_((weak)).
• For function definitions under CodeWarrior, the function attribute _MSL_CANT_THROW
follows the function name. For instance, isalnum(int c)_MSL_CANT_THROW{...... To avoid
an error message under GCC, the function attribute must be moved before the
function name. For instance, _MSL_CANT_THROW isalnum(int c) {......
• GCC does not allow pointer arithmetic unless it results in a lvalue. Otherwise, the
compiler issues an error. For example, l1 = *(++((int*)(left)));
is an error in GCC. To overcome this error, split the pointer arithmetic by introducing
temporary pointers of the appropriate type.
• In the math_api.h file, certain function definitions are located under a conditional
statement, #if_MSL_USE_INLINE. If this condition is not set, the code for these functions
is not generated. The result is a linker error for all the function definitions that fall
under this conditional statement. To prevent the error, enable the declaration
_GCCPORT_.
• GCC requires explicit declarations of global arrays. For instance, static const
mem_size fix_pool_sizes[] = {4, 12, 20, 36, 52, max_fix_pool_size};
is an invalid declaration under GCC, although max_fix_pool_size is a globally
initialized variable. To prevent this error, replace the variable max_fix_pool_size with
an exact value. So, the code becomes:
static const mem_size fix_pool_sizes[] = {4, 12, 20, 36, 52, 6};
CodeWarrior Development Studio for Power Architecture Processors Targeting Manual, Rev. 10.5.0,
06/2015
436
Freescale Semiconductor, Inc.
Chapter 12 Making a Custom MSL C Library
• In CodeWarrior, the variables, _heap_addr, _heap_end, _stack_addr, and _stack_end, are
initialized by preference panels. To work with GCC, you provide the definitions of
these variables through a linker command file (LCF), gccport.lcf.
• The GCC definitions va_list, va_start, va_end, va_arg, and va_copy replace/override the
CodeWarrior definitions.
• The nofralloc directive is not available in GCC. The functions requiring such a
directive have been rewritten in the assembly.
12.1.1 Files modified
A new file, msl_c_directives_to_gcc.h, has been added to the MSL C library sources. This
file is used as a prefix to build all the libraries. This header file maps the features of
CodeWarrior tools and maps them to the features of the GCC tools.
Following files from the MSL C Library are modified:
•
•
•
•
•
•
•
•
•
•
•
•
•
•
•
•
•
•
•
•
•
ansi_parms.h
cctype.h
cinttypes.h
cmath.h
cwctype.h
math_api.h
wstdio.h
alloc.c
math_api.c
math_double.c
math_float.c
math_fma.c
math_longdouble.c
mem_funcs.c
string.c
fminmaxdim.c
math_sun.c
ansi_prefix.
PPCEABI.bare.h
stdarg.EPPC.h
math_ppc.c
CodeWarrior Development Studio for Power Architecture Processors Targeting Manual, Rev. 10.5.0,
06/2015
Freescale Semiconductor, Inc.
437
Software floating point emulation support
12.2 Modifications to avoid errors from GCC LD tool
This section talks about modifications done to avoid getting errors from the GCC linker
load (LD) tool.
The GCC LD tool throws errors for the _rom_copy_info and _bss_init_info symbols when
used with the run-time libraries built with CodeWarrior. This is because the CodeWarrior
linker stores the symbols internally and so they are not available for the GCC LD. To
overcome this problem, a new LCF file, gccport.lcf, which contains the symbols required
by the GCC LD, has been introduced, without changing the MSL C library sources. The
modifications are summarized below:
• The call to _rom_copy_info from _init_data has been commented out.
• The stack is always aligned to 16 bytes.
• Two new symbols, _fsl_bss_start and _fsl_bss_end, have been introduced in the
_ppc_eabi_linker.h file. The values of these symbols are set by the gccport.lcf file.
12.2.1 Files modified
The gccport.lcf file provides definitions for the following symbols:
•
•
•
•
•
•
•
•
_stack_addr
_stack_end
_heap_addr
_heap_end
_SDA_BASE_
_SDA2_BASE_
_fsl_bss_start
_fsl_bss_end
Following files are modified:
•
•
_start.c
_ppc_eabi_linker.h
12.3 Software floating point emulation support
This section tells how to access the emulation functions needed by the GCC compiler.
CodeWarrior Development Studio for Power Architecture Processors Targeting Manual, Rev. 10.5.0,
06/2015
438
Freescale Semiconductor, Inc.
Chapter 12 Making a Custom MSL C Library
The GCC compiler generates calls to the emulation functions found in the libgcc.a
archive. You can access this archive from the following path:
\opt\freescale\usr\local\gcc-4.2.82-eglibc-2.5.82-2\powerpc-linuxgnu\lib\gcc\powerpc-linux-gnu\4.2.1\nof\libgcc.a
12.4 Building a custom MSL C library
A custom MSL C library can be built with the makefile, MSL_C.EPPC.GNU.mak, which was
derived from the MSL C For ARM implementation.
To build a custom MSL C library:
1. Change directory to $<CWInstallDir>/PA_Support/MSL/MSL_C/PPC_EABI/Project
2. Invoke make as follows:
$> make -f MSL_C.EPPC.GNU.mak TARGETS= MSL_C_LINUXABI_bare_N_UC
The make file generates MSL_C_LINUXABI_bare_N_UC.a in the $<CWInstallDir>/
PA_Support/MSL/MSL_C/PPC_EABI/Lib folder.
NOTE
Change the environment variable of $<CWInstallDir>/GCC
accordingly. Some developers use an underscore to change
the name of the GCC built library so that it is different from
the library built by the CodeWarrior tools.
3. CodeWarrior run-time libraries built with CodeWarrior are provided as Build
Runtime Libraries.
NOTE
The _start.o and _ppc_eabi_init.o files are to be included
individually. Otherwise, the linker wont be able to locate
the _start function the in _start.o file.
4. Reuse the pre-built libgcc.a archive.
5. To build an application:
a. Use the below files:
• The MSL header files
• The gccport.lcf linker command file
b. Set up the definitions for _GCCPORT_, _POWERPC_, _PPC_EABI_, and _MWERKS_
c. Use the following compiler options to build the libraries, with the appropriate
processor and compiler settings, and to specify the include files:
• -nostdinc
CodeWarrior Development Studio for Power Architecture Processors Targeting Manual, Rev. 10.5.0,
06/2015
Freescale Semiconductor, Inc.
439
Building a custom MSL C library
•
•
•
$(INCLUDE) -include msl_c_directives_to_gcc.h
-fno-builtin
-mcpu=e500mc -c
NOTE
$(INCLUDE) denotes the path of the MSL header
files.
6. With the program's object file generated, invoke the linker with the following
options:
• -nostdlib
• -nostartfiles
• -nostdlib
• -static
• -T gccport.lcf
• -e _start
7. And link it with the following files:
a. _start.o
b. _ppc_eabi_init.o
c. syscall.a
d. MSL_C_PPCEABI_bare_N_UC.a
e. Runtime.PPCEABI.N.UC.a.
8. Use the gccport.lcf file as an input to the linker. The generated ELF file can be run on
Simics.
CodeWarrior Development Studio for Power Architecture Processors Targeting Manual, Rev. 10.5.0,
06/2015
440
Freescale Semiconductor, Inc.
Chapter 13
Debugger Limitations and Workarounds
This chapter documents processor-specific CodeWarrior debugger limitations and
workarounds.
The chapter includes the following sections:
•
•
•
•
•
•
•
PowerQUICC II processors
PowerQUICC II Pro processors
PowerQUICC III processors
QorIQ communications processors
T-series processors
QorIQ Qonverge processors
Generic processors
13.1 PowerQUICC II processors
This section talks about the limitations and workarounds of the CodeWarrior debugger
for the PowerQUICC II processors.
The PowerQUICC II processor family includes G2: 8250 processors.
Working with watchpoints
G2 cores do not support watchpoints.
Working with hardware breakpoints
G2 cores implement one address instruction breakpoint (hardware breakpoint) that can be
used in a debug session.
Working with memory-mapped registers
CodeWarrior Development Studio for Power Architecture Processors Targeting Manual, Rev. 10.5.0,
06/2015
Freescale Semiconductor, Inc.
441
PowerQUICC II Pro processors
For G2 cores, you must provide the internal memory map base address before the
CodeWarrior debugger can access the internal memory-mapped registers (MMR). There
are two ways to provide this address:
• Use the setMMRBaseAddr command in a target initialization file.
• During a debug session, in the Debugger Shell issue this command:
cmdwin::eppc::setMMRBaseAddr.
13.2 PowerQUICC II Pro processors
This section talks about the limitations and workarounds of the CodeWarrior debugger
for the PowerQUICC II Pro processors.
The PowerQUICC II Pro processor family includes these processors:
• e300c3: 8306 and 8309
• e300c4: 8377
Single-stepping exception generating instructions (e300c2-c4 cores)
When single-stepping a branch instruction (for example, blr) to an address for which the
translation is unavailable, an I-TLB miss exception is generated. However, the runcontrol stops the target while being in an incomplete state. The PC points to the requested
address instead of the I-TLB interrupt vector, the SRR0 and SRR1 do not contain the
values of PC and MSR at the time of the exception, just the IMISS register is updated
correctly. The further execution is not possible because of the incomplete state. The user
has to manually adjust the aforementioned registers to their intended values: PC <= ITLB miss vector address (0x1100), SRR0 <= the value of PC at the time of the
exception, SRR1 <= the interrupt-specific information and MSR bit values.
Working with watchpoints
• Resuming execution after a watchpoint is hit: When a target is under the debugger's
control and a watchpoint (data breakpoint) condition is met, the core stops execution
at the instruction that generated the data access. This instruction is called the
watchpoint hit instruction. Unfortunately, when an e300 core hits a watchpoint, the
debugger cannot determine the circumstances under which the target stopped because
these cores do not update the necessary status registers. As a result, it is impossible to
resume (run or step) the target after a watchpoint has been hit because the debugger
cannot temporarily disable the watchpoint generated by the hit instruction. As a
CodeWarrior Development Studio for Power Architecture Processors Targeting Manual, Rev. 10.5.0,
06/2015
442
Freescale Semiconductor, Inc.
Chapter 13 Debugger Limitations and Workarounds
result, for an e300 core, you must manually disable a watchpoint before you can
resume execution from the watchpoint hit instruction.
• 64-bit alignment: The e300 core implements two data address registers. The
CodeWarrior debugger uses both registers to place a single watchpoint on a variable
or memory range. Any watchpoint set on a variable or memory address is equivalent
to a watchpoint set on an aligned address and a range of 64-bit multiple. This
limitation stems from the e300 cores' data breakpoints implementation.
Working with hardware breakpoints
The e300 core implements two address instruction breakpoints (hardware breakpoints)
that can be used in a debug session.
Working with memory-mapped registers
e300 cores have an internal memory-mapped registers base address register
(IMMRBAR). This is a memory-mapped register that relocates with the whole internal
memory map.
Further, the debugger uses the special purpose memory base address register (MBAR) to
store the base address of the internal memory-mapped registers.
Each time the location of the internal memory map changes, you must maintain the
correspondence between the IMMRBAR and MBAR registers.
13.3 PowerQUICC III processors
This section describes the limitations and workarounds of the CodeWarrior debugger for
the PowerQUICC III processors.
The PowerQUICC III processor family includes these processors:
• e500: 8560
• e500v2: 8536, 8548, 8568, 8569, 8572, C29x, and G1110
MMU configuration through JTAG
For e500 cores, the debugger is able to read the L2 MMU TLBs registers without using
dedicated processor instructions. For e500v2 cores, the debugger can read and write the
L2 MMU TLB registers. You can access these registers from the debugger's Registers
View or using commands in a target initialization script or the Debugger Shell.
For more information on the TLB register structure, see the README.txt file that is included
in the default CodeWarrior project for each supported target board.
CodeWarrior Development Studio for Power Architecture Processors Targeting Manual, Rev. 10.5.0,
06/2015
Freescale Semiconductor, Inc.
443
PowerQUICC III processors
Reset workaround
To put the e500 and e500v2 cores in debug mode at reset, you must ensure that the core
is running. The target initialization file sets a hardware breakpoint at the reset address.
The core is stopped at the reset address to be put in the debug mode.
Working with breakpoints
For e500 and e500v2 cores, the debugger implements software and hardware breakpoints
by using debug exceptions and the corresponding interrupt handler. Therefore, MSR[DE]
bit must remain set to allow debug interrupts to be taken. When a debug exception is
encountered, the target is expected to stop at the debug exception handler pointed by IVPR
+IVOR15.
However, for e500 and e500v2 cores, there is a chance that the first few instructions of
the debug exception handler are fetched and even executed before processor halts.
As a result, the core must be able to fetch and execute valid instructions from the
interrupt handler location pointed by IVPR+IVOR15 without raising a TLB miss exception or
any other exception. Also, the first few instructions of the debug interrupt handler must
not perform any Load or Store operations that would corrupt the application's context if
executed. If any of these conditions is not satisfied, the breakpoints will not work.
Working with watchpoints
The e500 and e500v2 cores implement two data address compare registers. The
CodeWarrior debugger uses both these registers to place a single watchpoint on any
variable or memory range. The variable or memory range is 1-byte aligned.
Working with hardware breakpoints
The e500 core implements two address instruction breakpoints (hardware breakpoints)
that can be used in a debug session.
Debugging interrupt handlers
The e500v2 debug support in CodeWarrior relies on Debug Interrupt functionality. Due
to interrupt priority levels, debugging Machine Check interrupt handlers is not possible.
Also, debugging Critical interrupt handlers is supported only in the range after the prolog
saves the values of CSSR0 and CSRR1 registers, and before the epilogue restores the
aforementioned registers. Otherwise, hitting a breakpoint outside of this range will result
in CSRR registers being overwritten, thus causing incorrect return address for the
interrupt.
Using memory configuration files for bareboard debugging
When debugging bareboard applications, CodeWarrior needs to be informed of the actual
MMU configuration regarding translated areas. For example:
CodeWarrior Development Studio for Power Architecture Processors Targeting Manual, Rev. 10.5.0,
06/2015
444
Freescale Semiconductor, Inc.
Chapter 13 Debugger Limitations and Workarounds
// Translate virtual address to corresponding physical cacheable (p:) address
translate v:0xFE000000 p:0xFFE000000 0x00100000
NOTE
For e500v2 cores, the debugger can also automatically read the
translations from the target MMU. To have this behavior, all
translate directives need to be removed from the memory
configuration file. For more information, see Memory
translations.
13.4 QorIQ communications processors
This section talks about the limitations and workarounds of the CodeWarrior debugger
for the QorIQ communications processors.
The QorIQ processor family includes the following processors:
• e500v2: P1010/11/12/13/14/15/16/17, P1020/21/22/23/24/25, and P2020/10
• e500mc: P2041/0, P3041, and P4080/40
• e5500: P5010, P5020, P5021, and P5040
NOTE
For e500v2 processors, see PowerQUICC III processors. All
the information from PowerQUICC III processors related to
e500v2 cores also applies to QorIQ processors based on e500v2
core.
MMU configuration through JTAG
For e500mc and e5500 cores, the debugger is able to read and write the L2 MMU TLBs
registers without using dedicated processor instructions. You can access these registers
from the debugger's Registers view or using commands in a target initialization script.
For more information on the TLB register structure, see the README.txt file that is included
in the default CodeWarrior project for each supported target board.
Using memory configuration files for bareboard debugging
For e500mc and e5500 cores, it is critical to use the correct cacheable or cache-inhibited
attribute for physical memory accesses. Failing to do so can lead to unreliable memory
access (stale data, data corruption). For more information, see Viewing memory.
CodeWarrior Development Studio for Power Architecture Processors Targeting Manual, Rev. 10.5.0,
06/2015
Freescale Semiconductor, Inc.
445
QorIQ communications processors
When debugging bareboard applications, CodeWarrior needs to be informed of the actual
MMU configuration regarding translated areas and cacheable/cache-inhibited attribute of
the memory ranges. For example:
// Translate virtual addresses to corresponding physical cacheable (p:) or cache-inhibited
(i:) addresses
translate v:0x00000000 p:0x00000000 0x80000000
translate v:0xE0000000 i:0xE0000000 0x10000000
translate v:0xF4000000 p:0xF4000000 0x00100000
translate v:0xF4100000 i:0xF4100000 0x00100000
translate v:0xF4200000 p:0xF4200000 0x00100000
translate v:0xF4300000 i:0xF4300000 0x00100000
translate v:0xFE000000 i:0xFE000000 0x01000000
translate v:0xFFFFF000 i:0xFFFFF000 0x00001000
See translate for more information on the translate command.
NOTE
The debugger can also automatically read the translations from
the target MMU. To have this behavior, all translate directives
need to be removed from the memory configuration file. For
more information, see Memory translations.
Working with software breakpoints
For e500mc and e5500 cores, the debugger implements software breakpoints by using the
dedicated debug notify halt (dnh) instruction. When the dnh opcode is encountered, the
target stops without taking an exception.
Working with watchpoints
The e500mc and e5500 cores implement two data address compare registers. The
CodeWarrior debugger uses both these registers to place a single watchpoint on any
variable or memory range. The variable or memory range is 1-byte aligned.
Working with hardware breakpoints
The e500mc and e5500 cores implement two address instruction breakpoints (hardware
breakpoints) that can be used in a debug session.
Cross-triggering
Cross-triggering (Halt groups) functionality is only available when debugging e500mc
and e5500 processors through a JTAG connection.
Individual Hardware Breakpoints and Watchpoints halt contexts are not working on
current e500mc and e5500 processors. The workaround is to enable all halt contexts for a
group (SW BP + HW BP + WP), thus defining a general debug stop halt group.
CodeWarrior Development Studio for Power Architecture Processors Targeting Manual, Rev. 10.5.0,
06/2015
446
Freescale Semiconductor, Inc.
Chapter 13 Debugger Limitations and Workarounds
The number of multicore groups that can be defined depends on the actual configuration
of the halt contexts defined for each group. Each defined group consumes internal EPU
resources. There is not a simple formula to estimate in advance the number of available
groups. The groups will be configured in the same order as they are defined. In case of
running out of resources, an error will be shown.
The cross-triggering functionality is "edge-based" rather then "state-based", which means
that only transitions from running to stopped state will be considered as triggers. This has
the downside that if any core from the group is already halted when a trigger is happening
on another running core, the cross-trigger will not activate for the group. To work around
this limitation, it is advisable to control the group synchronously by using the multicore
commands (Multicore Run and Multicore Suspend).
Maintaining core time base synchronization
For e500mc and e5500 processors, the CTBHLTCRL register in RCPM block is modified by
the debugger unconditionally on any connection to the target and after any Reset action,
to enable correct time base handling during multi-core debugging, specifically during
Linux kernel debugging. Changing the register value set by the debugger can cause the
target software behave unexpectedly during debug sessions, if the target software relies
on time base synchronization.
P2020 ComExpress (Linux kernel debug)
Linux kernel debug using download launch configuration is not supported. The
workaround is to use Linux kernel debug with attach configuration. For early boot debug,
set a hardware breakpoint at address 0 (debugger shell: bp -hw 0x0) then start the kernel
from u-boot console. After the breakpoint is hit, the kernel can be debugged from the
entry point.
13.5 T-series processors
This section describes the limitations and workarounds of the CodeWarrior debugger for
the T-series processors.
The T-series processor family includes the following processors:
• e5500: T1013, T1014, T1020, T1022, T1023, T1024, T1040, and T1042
• e6500: T2080, T2081, T4160, and T4240
NOTE
For e5500 processors, see QorIQ communications processors.
All the information from QorIQ communications processors
CodeWarrior Development Studio for Power Architecture Processors Targeting Manual, Rev. 10.5.0,
06/2015
Freescale Semiconductor, Inc.
447
T-series processors
related to e5500 cores also applies to T-series processors based
on e5500 core.
MMU configuration through JTAG
For e6500 cores, the debugger is able to read and write the L2 MMU TLB and LRAT
registers without using dedicated processor instructions. You can access these registers
from the debugger's Registers View or using commands in a target initialization script or
Debugger Shell.
For more information on the TLB register structure, see the README.txt file that is included
in the default CodeWarrior project for each supported target board.
Using memory configuration files for bareboard debugging
For e6500 cores, it is critical to use the correct cacheable or cache-inhibited attribute for
physical memory accesses. Failing to do so can lead to unreliable memory access (stale
data, data corruption). For more information, see Viewing memory.
When debugging bareboard applications, CodeWarrior needs to be informed of the actual
MMU configuration regarding translated areas and cacheable/cache-inhibited attribute of
the memory ranges. For example:
// Translate virtual addresses to corresponding physical cacheable (p:) or cache-inhibited
(i:) addresses
translate v:0x00000000 p:0x00000000 0x80000000
translate v:0xE0000000 i:0xE0000000 0x10000000
translate v:0xF4000000 p:0xF4000000 0x00100000
translate v:0xF4100000 i:0xF4100000 0x00100000
translate v:0xF4200000 p:0xF4200000 0x00100000
translate v:0xF4300000 i:0xF4300000 0x00100000
translate v:0xFE000000 i:0xFE000000 0x01000000
translate v:0xFFFFF000 i:0xFFFFF000 0x00001000
See translate for more information on the translate command.
NOTE
The debugger can also automatically read the translations from
the target MMU. To have this behavior, all translate directives
need to be removed from the memory configuration file. For
more information, see Memory translations.
For more information, see Viewing memory.
Working with software breakpoints
For e6500 cores, the debugger implements software breakpoints by using the dedicated
debug notify halt (dnh) instruction. When the dnh opcode is encountered, the target stops
without taking an exception.
Working with watchpoints
CodeWarrior Development Studio for Power Architecture Processors Targeting Manual, Rev. 10.5.0,
06/2015
448
Freescale Semiconductor, Inc.
Chapter 13 Debugger Limitations and Workarounds
The e6500 cores implement two data address compare registers. The CodeWarrior
debugger uses both these registers to place a single watchpoint on any variable or
memory range. The variable or memory range is 1-byte aligned.
As opposed to hardware, simulators are not usually limited by the available comparator
resources and allow a much higher number of watchpoints (1024).
Working with hardware breakpoints
The e6500 cores implement eight address instruction breakpoints (hardware breakpoints)
that can be used in a debug session.
As opposed to hardware, simulators are not usually limited by the available comparator
resources and allow a much higher number of hardware breakpoints(1024).
Thread representation of multi-threaded processor
The e6500 core is multi-threaded implementation of the resources for embedded
processors defined by the Power ISA. The core supports the simultaneous execution of
two threads. CodeWarrior shows each thread as a separate core, thus "core(2n)"
corresponds to thread#0 of the physical core#n, "core(2n+1)" corresponds to thread#1 of
physical core#n.
Individual thread control
For e6500 multi-threaded processors, the EDBCR0[DIS_CTH] register is modified by the
debugger unconditionally on any connection to the target and after any Reset action, to
disable cross-thread halt to allow individual thread control during multi-threaded
debugging. Changing the register value set by the debugger can cause the debugger
behave unexpectedly.
Maintaining thread time base synchronization
For e6500 processors, the TTBHLTCR register in RCPM block is modified by the
debugger unconditionally on any connection to the target and after any Reset action, to
enable correct time base handling during multi-core debugging, specifically during Linux
kernel debugging. Changing the register value set by the debugger can cause the target
software behave unexpectedly during debug sessions, if the target software relies on time
base synchronization.
13.6 QorIQ Qonverge processors
This section talks about the limitations and workarounds of the CodeWarrior debugger
for the QorIQ Qonverge processors.
CodeWarrior Development Studio for Power Architecture Processors Targeting Manual, Rev. 10.5.0,
06/2015
Freescale Semiconductor, Inc.
449
Generic processors
The Qonverge processor family includes the following processors:
• e500v2: BSC9131 and BSC9132
• e6500: B4420, B4460, B4860, and G4860
NOTE
For e500v2 processors, see PowerQUICC III processors. All
the information from PowerQUICC III processors related to
e500v2 cores also applies to Qonverge processors based on
e500v2 core. Similarly, for e6500 processors, see T-series
processors.
Choosing appropriate target type
Qonverge processors bundle together the cores of different architectures, for example,
BSC9131 includes a Power e500v2 core and a StarCore SC3850 core. The JTAG
topology can be configured to either include cores of both architectures in the same
daisy-chain, or to access only the Power cores on the JTAG port.
To distinguish between the two modes in which the processor can be configured, the
debugger uses two different target types (and consequently two sets of launch
configurations referencing the two different systems). For example, the BSC9131 target
type/debug configuration is used when the processor/board is configured for both the PA
and the SC cores in chained mode (Dual TAP mode on Power Architecture JTAG port)
and BSC9131PA target type/debug configuration is used when the processor/board is
configured only for the PA core on the Power Architecture JTAG port (Single TAP
modes).
Preventing debug halt requests caused by cross triggering cores
For BSC9132 processors, the Halted to Halt Request Mask register,
GUTS_HALTED_TO_HALT_REQ_MASK_REG, is modified by the debugger
unconditionally on any connection to the target and after any Reset action, to prevent
debug halt requests caused by cross triggering cores. Changing the register value set by
the debugger can cause the debugger behave unexpectedly.
13.7 Generic processors
This section talks about the limitations and workarounds of the CodeWarrior debugger
for generic Power Architecture processors.
Working with uninitialized stack
CodeWarrior Development Studio for Power Architecture Processors Targeting Manual, Rev. 10.5.0,
06/2015
450
Freescale Semiconductor, Inc.
Chapter 13 Debugger Limitations and Workarounds
Debugging while the stack is not initialized can cause uninitialized memory accesses
errors. This situation occurs when the debugger tries to construct the stack trace.
To avoid this problem, stop the debugger from constructing a stack trace by adding a
command to your target initialization file that sets the stack pointer (SP) register to an
unaligned address.
For example, you could put this command in your target initialization file:
writereg SP 0x0x0000000F
Secure debug
If the processor is in the Secure Debug mode and if the unlock key is not provided, then a
popup is displayed requesting the unlock key. If a wrong unlock key is provided in the
Debugger settings, and an unlock sequence is initiated by the debugger, you will receive
a Secure debug violation error and the connection to the target will fail.
For the P4080 processor, after this error is encountered, you will not be able to
successfully unlock the processor even with a correct key. In such a scenario, the board
should be hard reset first.
For the P1010 processor, if you have one failed attempt with a wrong key then a
subsequent unlock sequence with a valid key will succeed. But, if you provide a wrong
key twice, you will need to hard reset the board before the next attempt.
Hypervisor debug
Kernel download over Hypervisor does not work correctly. For example the kernel is not
stopped at entry point or the kernel module information is incorrect. The workaround is
to use the attach configuration. If you want to debug early phases of the kernel
initialization, after attach, set a hardware breakpoint at address 0x0 or at any kernel
function (for example, start_kernel). Then, in the Hypervisor console restart the partition
(for example, partition 1) with the following commands:
stop 1
start load 1
This is equivalent to download with stop at entry point.
Stepping in interrupt handler
An error sometimes occurs when stepping in an interrupt handler. The workaround to
avoid this problem is to use the default memory configuration file.
CodeWarrior Development Studio for Power Architecture Processors Targeting Manual, Rev. 10.5.0,
06/2015
Freescale Semiconductor, Inc.
451
Generic processors
CodeWarrior Development Studio for Power Architecture Processors Targeting Manual, Rev. 10.5.0,
06/2015
452
Freescale Semiconductor, Inc.
Index
Index
.cfg target initialization commands 382
.tcl target initialization commands 394
A
Accompanying documentation 20
Actions 177
Action Type 420
Add flash device 406
Add Flash Programmer Actions 407
Adding a Register Group 180
Adding CodeWarrior HyperTRK Debug Stub
Support in Hypervisor for Linux Kernel Debugging
346
Adding Memory Monitor 202
Address 424
Address lines 425
Advanced tab 158
alternatePC 382
ANDmem.l 383
ANDmmr 384
Applying New HyperTRK Patches from
CodeWarrior Install Layout 347
Arbitrary TAP state move test 154
Architecture 87
Arguments 105
Assembler 23
Attaching Core to the Debug Application 369
Auto-Build Mode 55
autoEnableTranslations 399
B
Bit Fields 175
Building a custom MSL C library 439
Building Projects 54
Build Properties 59
Build Properties for Power Architecture 60
Build Settings Page 34, 42
Build the executable 266
Build the shared library 266
Bus noise 424
Bypass scan test 153
C
C/C++ compiler 23
C/C++ Language 77
Cache Symbolics Between Sessions is Disabled 318
Cache Symbolics Between Sessions is Enabled 318
Cache View 205
Cache View Toolbar Menu 206
CCSSIM2 ISS 133
Changing Bit Fields 176
Changing Bit Value of a Register 173
Changing Build Properties 59
Changing Program Counter Value 213
Checksum actions 410
Code editing 27
CodeWarrior Bareboard Project Wizard 29
CodeWarrior Build Tool Settings 62
CodeWarrior Command-Line Debugger 159
CodeWarrior Development Studio tools 22
CodeWarrior IDE 26
CodeWarrior Linux Project Wizard 38
CodeWarrior Profiling and Analysis tools 25
CodeWarrior TAP 149
Common 125
Compiling 28
Compiling the DTS file 329
Components of Cache View 208
Configurations Page 36, 218
Configure flash programmer target task 406
Configure hardware to use U-Boot image 275
Configure Linux Process Signal Policy 247
Configure the executable build configuration 265
Configure the launch configuration 267
Configure the shared library build configuration 265
Configure U-Boot and build U-Boot images with
CodeWarrior debugger support 274
Configuring a Download Kernel Debug Scenario
319
Configuring an Attach Kernel Debug Scenario 320
Configuring and Building U-Boot 281
Configuring the Build Tool 314
Configuring the kernel project for debugging 319
Configuring the Linux Kernel 314
Configuring the Modules' Symbolics Mapping 343
Connection types 133
Consistent debug control 132
Contents of this manual 19
Create a CodeWarrior Bareboard Project Page 30
Create a CodeWarrior Download Launch
Configuration for the Linux Application 243
Create a CodeWarrior Linux Project Page 39
Create a CodeWarrior project to debug U-Boot 275
Create a flash programmer target task 404
Create an example project 262
Create launch configurations for U-Boot debug
stages 278
Creating a CodeWarrior Project from the Linux
Kernel Image 341
Creating a CodeWarrior Project to Debug U-Boot
284
Creating a CodeWarrior Project using the Linux
Kernel Image 316
CodeWarrior Development Studio for Power Architecture Processors Targeting Manual
Freescale Semiconductor, Inc.
453
Index
Creating a Download Launch Configuration to
Debug a Linux Partition from an Entry Point or a
User-Defined Function 353
Creating an Attach Launch Configuration to Debug
a Linux Partition after Kernel Boot 350
Creating CodeWarrior Bareboard Library Project 49
Creating CodeWarrior Bareboard Project 45
Creating CodeWarrior Linux Application Project 51
Creating hardware diagnostics task 418
Creating Projects 45
Creating task for import/export/fill memory 427
Customizing Debug Configurations 127
D
Data lines 425
Debug 108
Debug Configurations 101
Debugger 24, 107
Debugger Limitations and Workarounds 441
Debugger Shell Cache Line Commands 210
Debugger Shell Global Cache Commands 209
Debugging 28, 64, 95
Debugging a CodeWarrior project 132
Debugging a Linux Application 239
Debugging All Cores when Starting the Guest
Applications 366
Debugging AMP/SMP Guest Linux Kernels
Running Under Hypervisor 349
Debugging applications that use fork() and exec()
system calls 252
Debugging a shared library 262
Debugging Embedded Linux Software 239
Debugging Externally Built Executable Files 218
Debugging Hypervisor after Release of Secondary
Cores 364
Debugging Hypervisor During the Boot and
Initialization Process 359
Debugging Hypervisor from Relocation Till Release
of Secondary Cores 362
Debugging Hypervisor from the Entry Point 359
Debugging Hypervisor Guest Applications 345
Debugging Loadable Kernel Modules 340
Debugging Multi-Core Projects 227
Debugging Multiple Cores 231
Debugging the Application from the main()
Function 370
Debugging the Hypervisor Partition Manager 367
Debugging the Hypervisor Partitions Image
Loading Process 366
Debugging the Hypervisor Partitions Initialization
Process 365
Debugging the Kernel after the MMU is Enabled
335
Debugging the kernel based on MMU initialization
333
Debugging the Kernel before the MMU is Enabled
333
Debugging the kernel by attaching to a running UBoot 338
Debugging the kernel to download the kernel, RAM
disk, and device tree 331
Debugging the Kernel while the MMU is being
Enabled 334
Debugging the Linux Kernel 309
Debugging the P4080 Embedded Hypervisor 356
Debugging U-Boot after switching back to initial
address space 293, 300, 307
Debugging U-Boot before switching address space
289, 296, 303
Debugging U-Boot in RAM 294, 301, 308
Debugging U-Boot in translated address space 290,
297, 304
Debugging U-Boot using Flash Devices 287
Debugging U-Boot using NAND flash 302
Debugging U-Boot using NOR, NAND, SPI, and
SD Card/MMC Flash Devices 281
Debugging U-Boot using NOR flash 289
Debugging U-Boot using SPI and SD/MMC flash
295
Debug Target Settings Page 32, 217
Debug the Executable File 226
Debug the Linux Application 250
Debug the shared library 270
Default Signal Policy 248
Deleting Projects 56
Description 178
Diagnostics actions 411
Disassembler Settings 82, 99
Download 111
Dump Flash actions 412
Duplicate action 414
E
e500mc Registers 193
e500 Registers 188
e500v2 Registers 190
e5500 Registers 196
e6500 Registers 198
Eclipse IDE 22
Editing a Register Group 181
Editing remote system configuration 154
Editing the DTS File 328
Edit the Launch Configuration 222
Enabling HyperTRK Debug Support Directly in
Build Tool 347
Environment 124
EPPC Exceptions 109
Erase/Blank check actions 408
Erasing flash device 417
Establishing a Console Connection 312
Ethernet TAP 135
CodeWarrior Development Studio for Power Architecture Processors Targeting Manual
454
Freescale Semiconductor, Inc.
Index
Execute flash programmer target task 414
Execute host-based Scope Loop on target 426
Execute target-based Memory Tests on target 427
Exporting memory to file 431
F
Files modified 437, 438
Fill Memory 432
Flash File to Target 416
Flash programmer 403
Flattened Device Tree Initialization 324
G
GCC Build Tool Settings 84
General 68, 81, 88, 97
Generic processors 450
Gigabit TAP 140
Gigabit TAP + Trace 137
H
Hard resetting 213
Hardware diagnostics 418
Hypervisor - An Introduction 345
I
Import/Export/Fill memory 427
Import a CodeWarrior Executable file Page 215
Import a CodeWarrior Executable file Wizard 214
Import an Executable File 219
Import C/C++/Assembler Executable Files Page
215
Importing Classic CodeWarrior Projects 56
Importing data into memory 429
Includes 93
IncorMMR 384
Initialization tab 155
Initializing TLB Registers 187
Input 66, 71, 80
Install BSP 273
Install CodeWarrior TRK on Target System 240
Installing the Board Support Package (BSP) 313
Introduction 19
IR scan test 152
J
JTAG Configuration Files 371
JTAG configuration file syntax 371
JTAG diagnostics tests 152
L
Libraries 89
Linker 24
Linking 28
Link Order 67
Linux Application Launch Configurations Page 216
Linux Application Page 44
Loadable Kernel Modules - An Introduction 340
Loop Speed 421
M
Main 102
Main standard libraries 25
Making a Custom MSL C Library 435
Manual-Build Mode 54
Memory Access 421
Memory configuration commands 398
Memory Configuration Files 397
Memory tab 156
Memory Tests 422
Memory test use cases 426
Memory translations 158
Messages 65
Miscellaneous 90, 96
Modifications to avoid errors from GCC LD tool
438
Modifying a DTS file 330
Modifying and Building the HyperTRK Manually
348
Modifying Signal Policy 248
Multi-Core Commands in CodeWarrior IDE 234
Multi-Core Commands in Debugger Shell 236
Multi-Core Debugging 227
Multi-Core Debugging Commands 234
O
Obtaining a DTS File 326
Optimization 75, 94
ORmem.l 385
OS Awareness 119
Other Executables 116
Output 69
P
PIC 113
Points to remember 288
Power at probe test 152
PowerPC Assembler 79, 97
PowerPC Compiler 71, 91
PowerPC CPU 63
PowerPC Disassembler 81, 99
PowerPC Embedded Application Binary Interface
21
CodeWarrior Development Studio for Power Architecture Processors Targeting Manual
Freescale Semiconductor, Inc.
455
Index
PowerPC Environment 91
PowerPC Linker 65, 88
PowerPC Preprocessor 83, 98
PowerQUICC III processors 443
PowerQUICC II processors 441
PowerQUICC II Pro processors 442
Preparing Connection to P4080DS Target 348
Preparing U-Boot for debugging 272
Preprocessor 71, 92
Preprocessor Settings 83, 98
Prerequisites 350
Prerequisites for Debugging a Guest Application
346
Processor 75
Processor Page 31, 40, 216
Processor-Specific Cache Features 211
Program/Verify actions 409
Programming file 417
Project files 27
Protect/Unprotect actions 412
Q
QorIQ communications processors 445
QorIQ Qonverge processors 449
R
range 400
Reading JTAG IDCODEs test 154
Reading TLB Registers from Debugger Shell 185
Registers View Context Menu 179
Regular Initialization 325
Release notes 19
Remove action 414
Remove Breakpoints using Breakpoints View 167
Remove Breakpoints using Marker Bar 167
Remove Hardware Breakpoints using Debugger
Shell 168
Remove Hardware Breakpoints using the IDE 168
Removing a Register Group 182
Removing Breakpoints 167
Removing Hardware Breakpoints 167
Removing Watchpoints 171
reserved 400
reservedchar 401
reset 385
resetCoreID 387
Restoring Build Properties 60
Reverting Debug Configuration Settings 129
run 386
S
Secure/Unsecure actions 413
Serial Connections 242
setCoreID 386
Setting Breakpoints 163
Setting Hardware Breakpoints 165
Setting Launch Configurations 228
Setting Stack Depth 214
Setting up a remote system to use a JTAG
configuration file 376
Setting up RAM disk 323
Setting Up the Target Hardware 310
Setting Watchpoints 169
Shared Library Settings 90
Signal Inheritance 248
Simics 143
sleep 387
Software floating point emulation support 438
Source 123
Source library modifications 436
Specify Console I/O Redirections for the Linux
Application 246
Specifying the Launch Configuration Settings 285
Specify launch configuration settings 276
Specify target RAM settings 407
Specify the Source Lookup Path 223
Start CodeWarrior TRK on Target System 241
stop 388
Symbolics 117
Symbols 92
System Call Services 114
T
Target initialization commands 381
Target Initialization Files 379
TCF 144
TCP/IP Connections 241
Testing a DTB File 330
TLB Register Details 188
Trace and Profile 121
Trace Configuration Page 37
translate 402
T-series processors 447
U
Updating the Linux Kernel Image 318
USB TAP 146
USB TAP Connections 311
User Space Debugging with On-Chip Debug 367
Using a JTAG configuration file to override RCW
372
Using a JTAG configuration file to specify multiple
linked devices on a JTAG chain 373
Using Debug Configurations Dialog Box 101
Using Debugger Shell to Set Hardware Breakpoints
166
Using Debugger Shell to View Caches 209
Using IDE to Set Hardware Breakpoints 166
Using memory configuration files 398
CodeWarrior Development Studio for Power Architecture Processors Targeting Manual
456
Freescale Semiconductor, Inc.
Index
Using Open Firmware Device Tree Initialization
method 326
Using target initialization files 379
V
Viewing Cache 205
Viewing memory 202
Viewing multiple processes and threads 251
Viewing Register Details 174
Viewing TLB Registers in Registers view 183
W
Walking Ones 423
Warnings 73, 95
Working with Breakpoints 162
Working with Debugger 131
Working with Hardware Diagnostic Action editor
419
Working with Hardware Tools 403
Working with IMMR 201
Working with Projects 29
Working with Register Groups 180
Working with Registers 172
Working with TLB Registers 182
Working with Watchpoints 169
writemem.b 388
writemem.l 389
writemem.w 389
writemmr 390
writereg 391
writereg128 392
writereg192 393
writereg64 391
writespr 394
Writing configuration words in U-Boot code 283
CodeWarrior Development Studio for Power Architecture Processors Targeting Manual
Freescale Semiconductor, Inc.
457
Index
CodeWarrior Development Studio for Power Architecture Processors Targeting Manual
458
Freescale Semiconductor, Inc.
How to Reach Us:
Home Page:
freescale.com
Web Support:
freescale.com/support
Information in this document is provided solely to enable system and
software implementers to use Freescale products. There are no express
or implied copyright licenses granted hereunder to design or fabricate
any integrated circuits based on the information in this document.
Freescale reserves the right to make changes without further notice to
any products herein.
Freescale makes no warranty, representation, or guarantee regarding
the suitability of its products for any particular purpose, nor does
Freescale assume any liability arising out of the application or use of
any product or circuit, and specifically disclaims any and all liability,
including without limitation consequential or incidental damages.
“Typical” parameters that may be provided in Freescale data sheets
and/or specifications can and do vary in different applications, and
actual performance may vary over time. All operating parameters,
including “typicals,” must be validated for each customer application by
customer's technical experts. Freescale does not convey any license
under its patent rights nor the rights of others. Freescale sells products
pursuant to standard terms and conditions of sale, which can be found
at the following address: freescale.com/SalesTermsandConditions.
Freescale, the Freescale logo, CodeWarrior, QorIQ, QorIQ Qonverge,
and StarCore are trademarks of Freescale Semiconductor, Inc., Reg.
U.S. Pat. & Tm. Off. All other product or service names are the property
of their respective owners. The Power Architecture and Power.org word
marks and the Power and Power.org logos and related marks are
trademarks and service marks licensed by Power.org.
© 2008–2015 Freescale Semiconductor, Inc.
Document Number CWPADBGUG
Revision 10.5.0, 06/2015