1
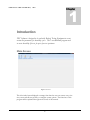
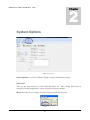
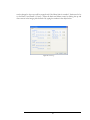
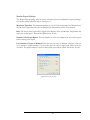
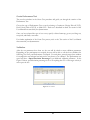
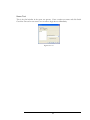
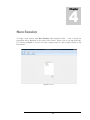
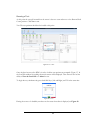
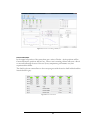
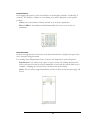
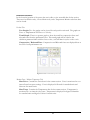
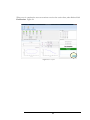
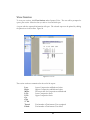
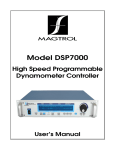
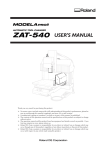
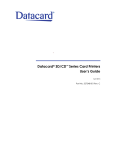
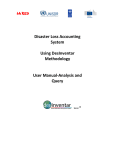
2 Volume ROEHRIG ENGINEERING, INC. Durability Life Test Shock Absorber Testing Software 100-313-540A ROEHRIG ENGINEERING, INC. Production Shock Absorber Testing Software Supplemental Software Manual Roehrig Engineering, INC. 100 Lexington Parkway Lexington, NC 27292 Phone 336-956-3800 • Fax 336-956-3870 Table of Contents INTRODUCTION........................................................................................................................... 1 MAIN SCREEN................................................................................................................................. 1 SYSTEM OPTIONS ....................................................................................................................... 2 HARDWARE ....................................................................................................................................... 2 DISPLAY OPTIONS .......................................................................................................................... 3 TEST OPTIONS ................................................................................................................................ 3 DATA STORAGE AND DISPLAY OPTIONS......................................................................................... 3 MONITOR PREFERENCES................................................................................................................. 3 MEASUREMENT SYSTEM AND UNIT PRECISION .............................................................................. 4 ENGINEERING TASKS ................................................................................................................ 5 TEST MANAGEMENT....................................................................................................................... 5 CREATE TEST ................................................................................................................................. 6 ACTIVE POSITIONS .................................................................................................................... 6 CYCLE LENGTH ........................................................................................................................ 6 TEST SPEED .............................................................................................................................. 7 PULSE GENERATOR / PACER ..................................................................................................... 7 LIMIT SETTINGS ........................................................................................................................ 7 MONITOR REPORT SETTINGS .................................................................................................... 9 CREATE PERFORMANCE TEST ................................................................................................. 10 VALIDATION............................................................................................................................... 10 NAMETEST ................................................................................................................................ 11 EDIT TEST..................................................................................................................................... 12 VALIDATION ................................................................................................................................. 12 DELETE TEST................................................................................................................................ 12 NEW SESSION ............................................................................................................................. 13 RUNNINGATEST................................................................................................................................ 14 Session Information: ............................................................................................................................. 15 Dwell Information: ............................................................................................................................... 16 Status Information: ............................................................................................................................... 16 Detailed Test Information ..................................................................................................................... 17 VIEW SESSION .............................................................................................................................. 19 R O E H R I G E N G I N E E R I N G , 1 Chapter I N C . Introduction DLT Software is designed to be used with Roehrig Testing Equipment to create custom test parameters for durability cycles. This is an additional program used to create durability life tests for up to four test specimens. Main Screen Figure 1: Main Screen This is the initial screen displayed at startup; from here the user can execute tests, view tests, create and edit test profiles, or configure system options. The functions of this program will be explained throughout the course of this manual. 1 R O E H R I G E N G I N E E R I N G , 2 Chapter I N C . System Options Figure 2: System Options System Options are used for Calibration, Display settings, and Parameter settings. Hardware These are the same functions as found in Roehrig Shock 6.0. These settings should only be changed by Roehrig Engineering to ensure the proper settings are retained. Motor allows the user to configure the selected motor and measure the stroke. Figure 3: Motor Configuration 2 Datacard contains the calibration settings for the selected datacard. Figure 4: Datacard PacerCard allows the user to configure digital out voltages during specific times in a test. Display Options Color- Lets the user define the color of each graph and the order in which colors appear. Test Options Gas Test Settle Time- The period of time the dyno is stopped to perform the gas test. Zero Velocity Test Settle Time- The time the dyno is stopped for zero velocity recording. Minimum Data Collection TimeCycles to Collect- Number of cycles run for performance test. Data collection occurs on the second to last cycle. Data Storage and Display Options Sign Convention- Using these options the user may display the data with axis and sign orientated as you like. Default settings can be seen in Figure 2. Monitor Preferences Report- Opens a window to allow the user to set default values for the report settings and spacing. 3 Figure 5: Monitor Report Preferences Cycle Count Velocity Target Percent- When a percentage of the target velocity is reached the cycle count will begin. BDC- The dyno will stop at Bottom Dead Center (Full Extension) after each performance test is completed when this box is checked. Measurement System and Unit Precision Measurement System specifies Standard English, Metric, or Custom units to be defined. Unit Precision changes the number of significant digits displayed to the right of the decimal point for each measurement type. 4 3 Chapter Engineering Tasks The user has the ability to create, edit, and delete custom durability tests as well as change the validation parameters for each test. Test Management Figure 6: Test Management 5 Create Test Active Positions Up to four positions can be selected for monitoring if your Roehrig dyno is equipped with a multiple position frame. Click the check box next to the position you want to activate. In the text box, create a name for each position and select the channels to be monitored. At least one position must be activated to perform a test. Figure 7: Active Positions Cycle Length In this window the dwell cycle length is set to a specific number of counts by clicking the up and down arrows at each integer place or by typing in the box to the right. The dyno will Dwell at a consistent speed for a specified number of cycles. The user has the option to run a Performance Test after each dwell cycle; the Performance Test parameters will follow standard Roehrig Shock test formats of CVP, PVP, or Multi-CVP. A Performance Test will automatically be run at the beginning of each test. Dual Dwell Mode allows for the use of two dwell cycles with different cycle counts. The Max Number of Test Cycles allows the user to control the total number of cycles or to run a test with Infinite Cycles. The total cycle count will be normalized to a divisible increment of the Dwell Cycle Length. Figure 8: Cycle Length 6 Test Speed Here there are two options for each dwell speed. The default speed of the Performance Test can be used, or a custom dwell speed can be set. If Dual Dwell Mode is selected there will be a second tab to enter the custom speed for Dwell 2. Figure 9: Dwell Speeds Pulse Generator / Pacer Figure 10: Pulse Generator / Pacer Limit Settings Limits must be set for Force (Compression and Rebound) and Temperature. When the specific limits for Compression, Rebound, and Temperature are set, the dwell cycles will be monitored and failures will be counted and reported as the test is running. The number of failure counts allowed 7 can be changed so that a test will be stopped only if the failure limit is exceeded. Limits need to be set for Dwell 1 and Dwell 2 (if used). Adjust the limits and failure counts by clicking the up and down arrows in the integer place desired or by typing the number in the adjacent box. Figure 11: Limit Settings 8 Monitor Report Settings The Monitor Report Settings allow the user to customize the rate at which data is reported during a test and the spacing within the report. See Figure 12 Maximum Table Size- The maximum number of rows of live data reported in the Monitor Force and Monitor Temperature tabs. (See the Detailed Test Information section of this manual) Rate- The rate in which cycles will be logged in the Monitor Force and Monitor Temperature tabs and in the session report. Data will be reported every X cycle. Number of Cycles per Report- The total number of cycles to be displayed in each session report before creating a new report. Last Number of Cycles to Maintain- Here the user can select to Maintain All cycles of the test or to maintain a specific number of cycles in the report if a limit is tripped and failure counts are exceeded. If a specific number of cycles is selected the report will be created with the last X cycles. Figure 12: Monitor Report Settings 9 Create Performance Test The next few windows in the Create Test procedure will guide you through the creation of the Performance Test. Choose the type of Performance Test to run by selecting a Continuous Velocity Pick-off (CVP), Peak Velocity Pick-off (PVP), or Multi-CVP. Each test is described in detail Test section of the User Manual that came with your dynamometer. Once you have selected the type of test to run, specify a desired warm-up, gas test, seal drag test, test speed, and finally a test name. For further explanation of the Create Test process, refer to the Test section of the User Manual that came with your dynamometer. Validation After the test parameters have been set, the user will be asked to enter validation parameters. Depending on the performance test created, the user will be able to edit the force validation for Seal Drag, Gas Force, and Performance Test Speed. For each phase, enter the target force window for compression and rebound and activate the test phases to be validated. The performance test speed will have a Speed Deviation Percentage as an additional validation parameter. In the Figure 13 below, speed deviation percentage is set to 95 requiring that 95% of the target velocity is met to pass the test. Figure 13: Force Validation 10 Name Test This is the final window in the create test process. Enter a unique test name and click finish. Check the “Proceed to test screen” box in order to begin the test immediately. Figure 14: Name Test 11 Edit Test By clicking Edit Test in the Test Management window the user is able to edit the selected test. The following windows to edit a test will follow the same format as the create test process, allowing the user to change existing test parameters. Validation This button allows the user to edit the validation parameters for a selected test, opens the validation window as seen in Figure 13. Delete Test Deletes the selected test from the list. 12 4 Chapter New Session To begin a new session, click New Session under Operator Tasks. A list of saved test parameters will be displayed in the center of the screen. Select a test to run and click Start. You will be prompted to save the test with a unique name in a time stamped folder in ‘My Documents’. Figure 16: New Session 13 Running a Test At this point the user will warned that the motor is about to start and move to the Bottom Dead Center position. Click Yes to start. Note: The test specimen should not be loaded at this point. Figure 17: Move to BDC Once the dyno has moved to BDC it is safe to load the test specimen as prompted. (Figure 17) In the Load Part window live readings from each sensor will be displayed. Here the user also has the ability to Zero the Load Cell or to Abort the test. To begin the test, simultaneously press both Shift keys (Left and Right) and F12 at the same time. Figure 18: Load Part During the course of a durability run there are four areas where data is displayed, see Figure 18. 14 Figure 19: Test window as seen during a durability test. Session Information: In the upper left portion of the screen there are a series of blocks. Active positions will be Green and inactive positions will be Grey. When a test is running, failures will cause a block to turn red indicating the area of the test (force, temperature, performance test) that experienced the failure. The dwell cycles are counted here to show test progress with the active dwell in black and the inactive dwell in grey. Figure 20: Session Information 15 Dwell Information: In the upper right portion of the screen failures are monitored for Dwell 1 and Dwell 2 (if selected). The number of failures to occur during a test will be displayed at each specific position. Count is the total number of failures allowed as set in the test parameters. Max and Min are the maximum and minimum limits for the test as set in the test parameters. Figure 21: Dwell Information Status Information: In the lower right portion of the screen is the Status Information to display what part of the test is currently being performed. Live readings from Displacement, Force, Velocity, and Temperature are also displayed. Stop Session- Users will have the option to stop a session. By clicking this button the user has the option to end the session immediately or end once the current dwell cycle is complete. Stopping the session will save the data in the session folder. Abort- The test will be stopped immediately and the test data for the last report page will be lost. Figure 22: Status Information 16 Detailed Test Information In the lower left portion of the screen the user is able to view recorded data for the session. There are four Position tabs, a Force Monitor tab, and a Temperature Monitor tab where data can be viewed. Position Tabs Live Graphs: Two live graphs can be viewed for each position activated. The graphs are Force vs. Displacement and Force vs. Velocity. Trend Graph: There is a separate graph to show the trend for compression force and rebound force from the performance test. This trend graph will be scaled to the validation parameter limits with the force on the y-axis and time in cycles on the x-axis. Compression / Rebound Data: Compression and Rebound forces are displayed here at the end of each performance test. Figure 23: Detailed Test Informaiton_Position Tab Monitor Force / Monitor Temperature Tabs Mon Force: Contains the Force data for the current session. Force is monitored at a set interval based on report settings. Force is displayed in Pounds for standard units and Newtons for metric units. Mon Temp: Contains the Temperature data for the current session. Temperature is monitored at a set interval cycle count. Temperature is displayed in degrees Fahrenheit for standard units and degrees Celsius for metric units. 17 When a test is complete the user can continue to review the session data, when finished click End Session. Figure 24 Figure 24: Test Complete 18 View Session To view past sessions, click View Session under Operator Tasks. The user will be prompted to open a past session. Select the data you wish to view and click open. A report with the requested information will open. The selected report can be printed by clicking the printer icon in the toolbar. Figure 24 Figure 25: Session Results The session results are summarized at the end of the report: Low: High: Mean: LCL: UCL: Cp: Cpk: % Tol: Tested: Failed: Lowest Compression and Rebound values Highest Compression and Rebound values The mean value for Compression and Rebound Lower Compression Limit Upper Compression Limit Total number of Performance Tests completed Total number of Performance Tests failed 19