1
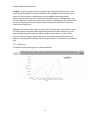
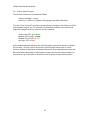
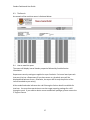
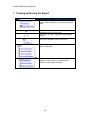
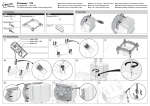
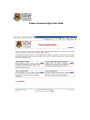
Finance General Ledger User Guide Student Dashboard User Guide 1 OVERVIEW .......................................................................................................... 2 1.1 What is Finance/General Ledger? ..............................................................................2 1.2 How current is the data? ............................................................................................2 1.3 What reports are available? .......................................................................................2 1.4 Getting help and information .....................................................................................2 2 ACCESSING THE FINANCE MAIN PAGE ......................................................... 3 2.1 How to access .............................................................................................................3 2.2 What is this page for?.................................................................................................6 3 FINANCE ANALYSIS SUMMARY ...................................................................... 7 3.1 What is this report for? ..............................................................................................7 3.2 Mandatory parameters ..............................................................................................7 3.3 Optional parameters ..................................................................................................7 3.4 Additional Parameters ................................................................................................7 3.5 The Results .................................................................................................................8 3.6 How to read the report ..............................................................................................9 4 FINANCE ANALYSIS DETAIL .......................................................................... 10 4.1 What is this report for? ............................................................................................10 4.2 Mandatory parameters ............................................................................................10 4.3 Optional parameters ................................................................................................10 4.4 Additional parameters..............................................................................................10 4.5 The Results ...............................................................................................................11 4.6 How to read the report ............................................................................................11 5 FINANCE FACULTY/UNIT MANAGEMENT SUMMARY ................................. 13 5.1 What is this report for? ............................................................................................13 5.2 Mandatory parameters ............................................................................................13 5.3 Optional parameters ................................................................................................13 5.4 Additional parameters..............................................................................................13 5.5 The Results ...............................................................................................................14 5.6 How to read the report ............................................................................................15 6 FINANCE JOURNAL DETAIL ........................................................................... 16 6.1 What is this report for? ............................................................................................16 6.2 Mandatory parameters ............................................................................................16 6.3 The Results ...............................................................................................................17 6.4 How to read the report ............................................................................................17 7 VIEWING AND SAVING THE REPORT............................................................ 18 8 APPENDIX: PS GENERAL LEDGER CHARTFIELDS .................................... 19 1 Student Dashboard User Guide 1 Overview 1.1 What is Finance/General Ledger? The Finance Reporting suite allows you to explore the General Ledger and related subsystems in a flexible manner. High-level analytics can be performed, with linkages to transaction details on demand. 1.2 How current is the data? Report data is updated nightly. The numbers shown on a report run today are current as of the previous day. 1.3 What reports are available? Finance Analysis Summary o Flexible display of various financial measures summarized by chartfields and time periods. Offers crosstab or graphical chart layouts, as well as drill through to transaction details. Finance Analysis Detail o Lists transactions for various financial measures grouped by Fund and Account. Drill throughs to other modules (e.g. Procure to Pay) are available for certain items. Finance Faculty/Unit Management Summary o Budget, Actual and Variance summarized by chartfields and time periods. Account breakdown by row is the recommended layout for this report. Finance Journal Detail o Lists General Ledger journal entries for a specified journal ID. Only those lines for which you have the appropriate Department ID access are displayed. 1.4 Getting help and information If the user manual does not provide you with the information you need, or to request access to Enterprise Reporting, contact IT by: Phone – (403) 220-5555 Email – [email protected] Submit a help ticket – Click the help ticket link at the bottom of any report page and follow the instructions. 2 Student Dashboard User Guide 2 Accessing the Finance Main Page 2.1 How to access 1. Go to https://ereports2.ucalgary.ca and click on “Login to Enterprise Reporting” in the Quick Links sidebar: 3 Student Dashboard User Guide 2. The My UofC screen will appear. Type in your eID and your password in the form of “PIN/SecureID”: The following page, the main page, will appear: The main page displays the various content and actions you can perform from within the Cognos reporting environment. Select “My home” to access the reports. 4 Student Dashboard User Guide The resulting page is the “Public Folders” page: From the Public Folders page, select “PS General Ledger” to bring up the General Ledger/Finance page: 5 Student Dashboard User Guide From the General Ledger main page, select “Finance Reports Menu” to bring up the menu of all available reports: 2.2 What is this page for? This page is the entry point for viewing all Finance reports. All reports can be run from this page. Currently there are four reports: 1. Finance Analysis Summary 2. Finance Analysis Detail 3. Finance Faculty/Unit Management Summary 4. Finance Journal Detail 6 Student Dashboard User Guide 3 Finance Analysis Summary 3.1 What is this report for? This report displays various financial measures summarized by chartfields and time periods. 3.2 Mandatory parameters Rows – Select the item to be displayed along the left side of the crosstab, or the Y-axis of a chart. Columns – Select the item to be displayed along the top of the crosstab, or the X-axis of a chart. Values – The financial measure to summarize by the selected row and column items. Subtotals are displayed along the bottom and right sides of the crosstab, except for when time periods are displayed with Encumbrance and Pre-Encumbrance. Display – Choose how the data is to be presented on screen. More than one display type can be enabled. Period – Select a time frame for the data. You can click on a single period in the right hand box, or select multiple values by holding down the CTRL or SHIFT key while clicking. The default level applied is Fiscal Year. To filter by a different time granularity, select a period type in the left hand box and press the Apply >> button. This is the only mandatory filter for the report. 3.3 Optional parameters Department – Choose one or more Departments to filter the report by. To quickly scroll to a particular Department, highlight any entry in the right hand box and begin typing the first few numbers of the ID. You can change the scope of the prompt by selecting a different Department hierarchy level in the left hand box and pressing the Apply >> button. Please note that even if you select an entire Faculty or VP area, you will only receive data for those Department IDs you are authorized to view; contact the IT Support Centre if you are unsure about your security settings. If nothing is selected, the report will run for all Departments that you have access to. Fund – Click on one or more checkboxes to narrow your search down to specific Fund(s). If nothing is selected, the report will run for all available Funds. 3.4 Additional Parameters Less commonly used filters are hidden by default to save space, but they can be revealed by selecting ON and pressing the Refresh button. 7 Student Dashboard User Guide Program – Type a Program code into the search box and click the Search button. Any match found will appear in the left hand Results box; highlight it and press the Insert button to filter the report. Multiple items can be added to the Choices box by performing additional searches. Please note that data security is by Department; you will see values for Programs as long as they are within the Department IDs that you have access to. Filtering by a specific Program will not display all transactions if some are outside your faculty/unit. Internal – The Internal code search prompt works the same way as the Program search. If a series of desired Internal codes begin with the same first few characters, you can type the beginning of the code and obtain multiple search results. In order to filter Internals out of the report, type a single space in the search box and click the Search button. A “Not Assigned to Internal” item will appear which can be added to the Choices box. 3.5 The Results An example of the resulting report is displayed below: 8 Student Dashboard User Guide 3.6 How to read the report This report displays summarized data in a customizable crosstab format. The rows and columns of the crosstab can be set to any combination of chartfield or time period, with one of four different financial measures as the contents. Results can optionally be displayed as bar, line or pie graphs using the selected rows and columns as the X and Y-axis, as shown above. Actual and Budget are cumulative across all chartfields and fiscal periods. Encumbrance and Pre-Encumbrance are monthly snapshots that represent commitment levels at a point in time. They can be aggregated by chartfield, but not by period. A blue underlined value indicates that a drill through to transaction details is available for that item. Click on a link to launch the Finance Analysis Detail report in a new browser window. It will display all detailed information that composed a particular crosstab cell. Charts can also be clicked on to see transaction data for specific bars, line points or pie slices. Be careful when attempting to drill through on items that may have large numbers of transactions (e.g. entire years or faculties), as this may take a long time to produce. 9 Student Dashboard User Guide 4 Finance Analysis Detail 4.1 What is this report for? This report displays transaction level information for any one of four different financial measures, grouped and subtotaled by Fund and Account. 4.2 Mandatory parameters Values – The financial measure for which to display transactions. Subtotals are provided by Fund and Account group. Period – Select a time frame for the data. You can click on a single period in the right hand box, or select multiple values by holding down the CTRL or SHIFT key while clicking. The default level applied is Month. To filter by a different time granularity, select a period type in the left hand box and press the Apply >> button. This is the only mandatory filter for the report. It is highly recommended that you limit the chosen Period to a few months or less, especially for Actuals due to the potentially large number of transactions. 4.3 Optional parameters Department – Choose one or more Departments to filter the report by. To quickly scroll to a particular Department, highlight any entry in the right hand box and begin typing the first few numbers of the ID. You can change the scope of the prompt by selecting a different Department hierarchy level in the left hand box and pressing the Apply >> button. Please note that even if you select an entire Faculty or VP area, you will only receive data for those Department IDs you are authorized to view; contact the IT Support Centre if you are unsure about your security settings. If nothing is selected, the report will run for all Departments that you have access to. It is highly recommended that you choose only a few Departments at most, especially for Actuals due to the potentially large number of transactions. Fund – Click on one or more checkboxes to narrow your search down to specific Fund(s). If nothing is selected, the report will run for all available Funds. 4.4 Additional parameters Less commonly used filters (e.g. Program and Internal) are hidden by default to save space, but they can be revealed by selecting ON and pressing the Refresh button. Program – Type a Program code into the search box and click the Search button. Any match found will appear in the left hand Results box; highlight it and press the Insert button to filter the report. Multiple items can be added to the Choices box by performing additional searches. Please note that data security is by Department; you will see values for Programs as long as they are within the Department IDs that you have 10 Student Dashboard User Guide access to. Filtering by a specific Program will not display all transactions if some are outside your faculty/unit. Internal – The Internal code search prompt works the same way as the Program search. If a series of desired Internal codes begin with the same first few characters, you can type the beginning of the code and obtain multiple search results. In order to filter Internals out of the report, type a single space in the search box and click the Search button. A “Not Assigned to Internal” item will appear which can be added to the Choices box. Project – The Project code search prompt works the same way as the Program search. If a series of desired Project codes begin with the same first few characters, you can type the beginning of the code and obtain multiple search results. In order to filter Projects out of the report, type a single space in the search box and click the Search button. A “Not Assigned to Project” item will appear which can be added to the Choices box. This filter is provided for troubleshooting purposes only; accurate Project balances cannot be obtained, particularly if some transactions are input to the wrong Department. 4.5 The Results An example of the resulting report is displayed below: 4.6 How to read the report The data is arranged to group by fund and account, and to display details about the fund and account across the columns. Actual and Budget are cumulative across all chartfields and fiscal periods. Encumbrance and Pre-Encumbrance are monthly snapshots that represent commitment levels at a point in time. They can be aggregated by chartfield, but not by period. 11 Student Dashboard User Guide A blue underlined value indicates that a drill through to further details is available for that item. Click on a Journal ID to launch the Finance Journal Detail report in a new browser window. In addition, some transaction types have a drill through link to other reporting packages outside of PS General Ledger, such as Accounts Payable Vouchers, Expense Sheets, Purchase Orders, Requisitions, and others which are being continually added to the report. You must have permission to use the target reporting package for a drill through to work. If you need to obtain access to additional packages, please contact the IT Support Centre. 12 Student Dashboard User Guide 5 Finance Faculty/Unit Management Summary 5.1 What is this report for? This report is a specialized version of the Finance Analysis Summary, meant for Budget to Actual comparison. A Variance calculation is provided, as well as a color-coded Variance percentage ranging from green (healthy) to red (requires attention). 5.2 Mandatory parameters Rows – Select the item to be displayed along the left side of the statement. Account Mid-Level and Detail are rendered in a nested layout. All other row types are displayed as a single level, similar to the Finance Analysis Summary report. Columns – Select the item to be displayed along the top of the statement. For each value, the columns Budget, Actual, Variance and Variance % are shown. Column Totals – Optionally display an extra column showing the sum of all other columns. For example, if the twelve months April 2008 – March 2009 are displayed along the top of the report, the total Budget, Actual, Variance and Variance % for all months will also be shown. Period – Select a time frame for the data. You can click on a single period in the right hand box, or select multiple values by holding down the CTRL or SHIFT key while clicking. The default level applied is Fiscal Year. To filter by a different time granularity, select a period type in the left hand box and press the Apply >> button. This is the only mandatory filter for the report. 5.3 Optional parameters Department – Choose one or more Departments to filter the report by. To quickly scroll to a particular Department, highlight any entry in the right hand box and begin typing the first few numbers of the ID. You can change the scope of the prompt by selecting a different Department hierarchy level in the left hand box and pressing the Apply >> button. Please note that even if you select an entire Faculty or VP area, you will only receive data for those Department IDs you are authorized to view; contact the IT Support Centre if you are unsure about your security settings. If nothing is selected, the report will run for all Departments that you have access to. Fund – Click on one or more checkboxes to narrow your search down to specific Fund(s). If nothing is selected, the report will run for all available Funds. 5.4 Additional parameters Less commonly used filters (e.g. Program and Internal) are hidden by default to save space, but they can be revealed by selecting ON and pressing the Refresh button. 13 Student Dashboard User Guide Program – Type a Program code into the search box and click the Search button. Any match found will appear in the left hand Results box; highlight it and press the Insert button to filter the report. Multiple items can be added to the Choices box by performing additional searches. Please note that data security is by Department; you will see values for Programs as long as they are within the Department IDs that you have access to. Filtering by a specific Program will not display all transactions if some are outside your faculty/unit. Internal – The Internal code search prompt works the same way as the Program search. If a series of desired Internal codes begin with the same first few characters, you can type the beginning of the code and obtain multiple search results. In order to filter Internals out of the report, type a single space in the search box and click the Search button. A “Not Assigned to Internal” item will appear which can be added to the Choices box. 5.5 The Results An example of the resulting report is displayed below: 14 Student Dashboard User Guide 5.6 How to read the report The Variance columns are calculated as follows: Variance = Budget – Actual Variance % = Variance / Budget x 100 (signage reversed for Revenue) The color of the Variance % provides a visual indicator of whether the Variance is within an acceptable range or not. For revenues, the favorable condition is for Actual to be larger than Budget, while the reverse is true for expenses: Greater than 25% → Excellent Between 25% and 0% → Good Between 0% and -25% → Fair Less than -25% → Poor A blue underlined value indicates that a drill through to transaction details is available for that item. Click on a link to launch the Finance Analysis Detail report in a new browser window. It will display all detailed information that composed a particular cell. Be careful when attempting to drill through on items that may have large numbers of transactions (e.g. entire years or faculties), as this may take a long time to produce. 15 Student Dashboard User Guide 6 Finance Journal Detail 6.1 What is this report for? This report shows General Ledger Journal header and line information for a given Journal entry. 6.2 Mandatory parameters Journal ID – Type a Journal ID in the left hand text box and press the Apply >> button. Journals are identified by Business Unit, ID, Date and Unpost Sequence, so there may be more than one search result displayed. If you do not know the entire Journal ID, you can type the first few characters and the Results box will show all matching entries. Only those Journals with at least one line to which you have Departmental access are viewable. Select one search result from the right hand box and press the Finish button. 16 Student Dashboard User Guide 6.3 The Results An example of the resulting report is displayed below: 6.4 How to read the report The report will display Journal header properties followed by line distribution information. Department security settings are applied on a per-line basis. If a Journal was input such that every line has a Department ID you have access to, the whole entry will be displayed and balance to zero. Otherwise, the report will list only the portion of the Journal encoded to your unit(s). A blue underlined value indicates that a drill through to further details is available for that item. You must have permission to use the target reporting package for a drill through to work. If you need to obtain access to additional packages, please contact the IT Support Centre. 17 Student Dashboard User Guide 7 Viewing and Saving the Report Icon Description Keep This Version - keep a copy of the generated report, either by emailing it, or saving it as a report view Run – returns to the previous screen to set new parameters and run a new report Drill Down / Drill Up - changes the level of detail shown Go To (Links) - identifies any links within the report that can be selected to open a new report View Options - exports the report to an HTML, PDF, XML, or Excel view Add This Report - saves a version of the report by adding it to “My Folders” or “My Bookmarks” sections in IBM Cognos Connection 18 Student Dashboard User Guide 8 Appendix: PS General Ledger Chartfields Chartfield GL Business Unit Description 5 characters Designates a separate legal entity Fund 2 characters Segregate financial information to reflect the nature and restrictions of funding Dept_ID 5 characters Lowest level of responsibility centre reporting within the university First two characters in a range will be “assigned” to a department 5 characters Designates balance sheet or income statement account Account Program Internal 5 characters Activity across faculties or departments such as a building, initiative, or academic session 9 characters Activity specific to one faculty or department Project 8 characters Designates a research & trust project (RT , PP or OP) or a PER (EX) project Activity 5 characters Represents further subproject detail Values ARCTC = Arctic Institute of North America FHOBO = Funds Held on Behalf of Others UCALG = University of Calgary UCFND = U of C Foundation UTECH = University Technologies Inc. 10 = Central Operating 20 = Other Operating 30 = Carryover Reserves 40 = Board Approved Reserves 50 = Capital 60 = Research 70 = Other Restricted conversion xxxx0 - where “xxxx” = faculty INTER xxxxx - no relationship to INTER for non faculty units post conversion xxxxx - where "xxxxx" = next sequential number in department’s range 1xxxx = Asset 2xxxx = Liability 3xxxx = Net Assets (Equity) 4xxxx = Revenue 5xxxx = Salary & Benefit Expenses 6xxxx = Non-Salary Expenses 7xxxx = Internal Transfers conversion xxxxx - where "xxxxx" = MEMO post conversion xxxxx - where "xxxxx" = next sequential number conversion aaa0xxxxx – where "aaa" = source code & "xxxxx" = MEMO post conversion aaaxxxxxx – where "aaa" = source code & "xxxxxx" = next sequential number conversion aaxxyyyy – where aa = RT, PP, or PE, xx = MAJOR, yyyy = INTER aazzzzzz – where aa = OP, zzzzzz = FEXT project number post conversion aaxxxxxx – aa = RT, PP, OP, PE and “xxxxxx” = next sequential number conversion xxxxx – where "xxxxx" = MEMO post conversion xxxxx – “xxxxx” = next sequential number 19