1
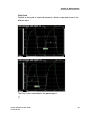
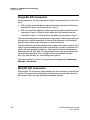
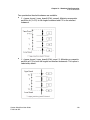
Chapter 6: Displaying Waveforms
Logic Panel
the signal value of a regular signal; valuey can be either the value of a realsignal or the magnitude/phase/real/imaginary part of a complex signal. The
zoom operation is supported along both axes, and the logarithmic scale is also
supported along both axes.
Waveforms in linear X-Y panels can be displayed with different plotting options
including PWL (piece-wise-linear) line-type, PWC (piece-wise-constant) linetype, bar chart and data-point only mode. Choose Panel > Display Preference
to change the plotting mode.
Logic Panel
A logic panel displays signals using digital timing diagram. It is permitted only in
vertical stack waveviews. Logic panels accept signals that are represented in
(time, logic) pairs. Various logic states including logic strength levels are
supported. Zoom operation is supported along the x-axis direction.
Logic panels cannot be manually added from the application top menu. They
are automatically created when logic signals are dropped into a vertical
waveview.
Current vector width (number of bits) and radix setting of a logic panel are
indicated in the left column of each panel (B: binary, O: octal, D: decimal, H:
Hex-decimal, A: ASCII). The width digits are red color-coded for bus signals
formed from originally separated bits, or yellow color-coded for a single bit
extracted from an originally grouped bus signal.
Logic panels can be arbitrarily mixed with linear X-Y panels in a vertical stack
waveview.
Mnemonic Mapping for Bus Signals
WaveView supports mapping bus values to pre-defined text strings. The
translation table can be provided in an external file.
Syntax:
# comment lines start with '#'
value1 name1
value2 name2
…
The values are the bus values to be mapped.
50
Custom WaveView User Guide
F-2011.09-SP1