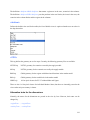
1
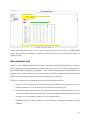
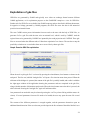
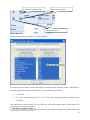
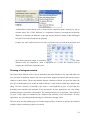
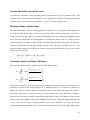
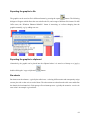
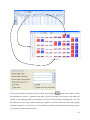
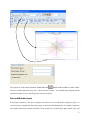
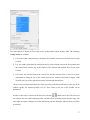
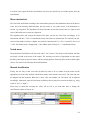
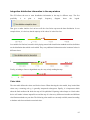
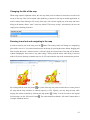
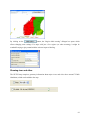
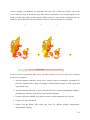
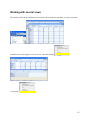
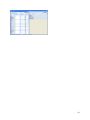
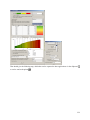
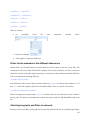
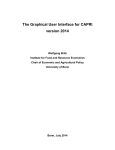
Line and point charts
Line and point charts assume that the columns of the table present some ordered sets e.g. years or
iterations. There is currently a default of 25 such observations which can be increased by the user. The
different series to plot are taken from the table rows. If different column groups are present, those receive
their own plot with an own value axis.
70