1
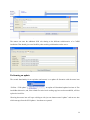
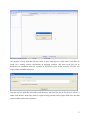
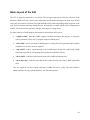
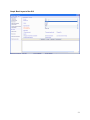
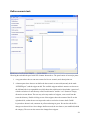
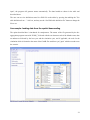
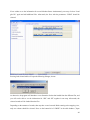
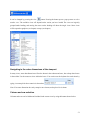
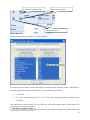
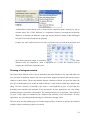
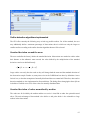
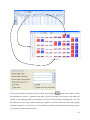
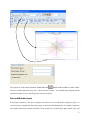
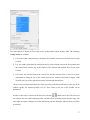
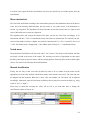
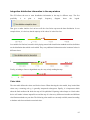
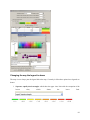
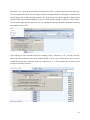
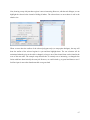
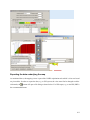
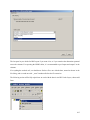
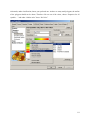
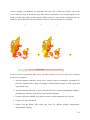
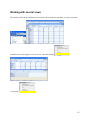
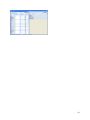
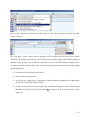
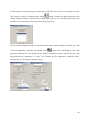
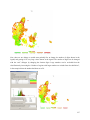
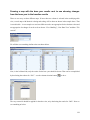
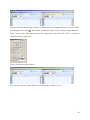
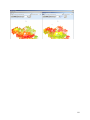
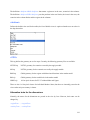
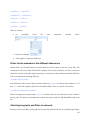
The main options of interest for flow maps are the scaling model and the display width. The following scaling models are available: Linear: the width is determined by relating the flow quantity to the sum of all flows for the same scenario. Log: the width is determined by multiplying the log of the relation between the flow quantity and the minimal flow with the log of the relation of the maximal and minimal flows for the same scenario. Polynomial: the relation between the current flow and the maximal flow is raised to a power determined by taking the log of the relation between the maximal and minimal display width divided by the log of the regional between the maximal and minimal flow. The user can prevent that small flows are drawn by setting a minimal width relative to the size of the window; equally, the maximal possible size of a flow relative to the size of the window can be determined. In order to show only a selection of the flows, the selection buttons can be used. The lower left one relates to the rows of the underlying tables, and thus allows excluding origins from the maps. The lower right one opens a dialogue to exclude destinations, whereas the upper right one allows exclusion of scenarios. 77